SWDY's New Upward Region Waiting for Chart Pattern ConfirmationSWDY stock is still trying to peak up, but unfortunately, it's rebounding back from the resistance line of 82.662. It had already broken the support line 81.970. In case of continuing, it'll break the support line 81.849 till reaching the support line 81.759. In case of rising, it'll breach the 1st resistance line to the 2nd resistance line at 82.933 points and the 3rd resistance line at 83.097. In general, it's expected to rise, especially for the presence of a double bottom, which will lead to a bullish reversal pattern and orient a new upward region, but the chart pattern confirmation is still in progress.
Bottomline

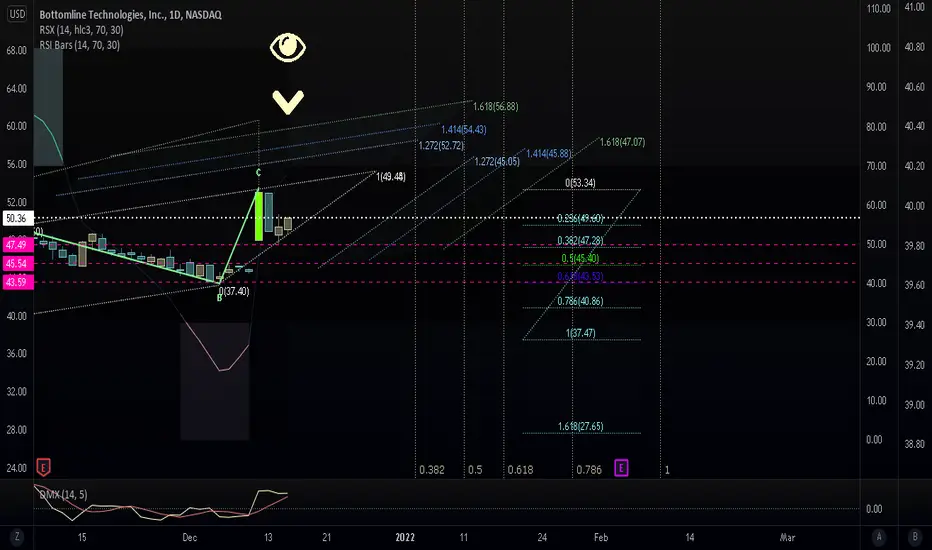
Bottomline Tech bottoming (how ironic). EPAYWe soundly lolled at the irony on this one. A classical picture of an impending drop if you have ben following our ideas. Down we go.
We are not in the business of getting every prediction right, no one ever does and that is not the aim of the game. The Fibonacci targets are highlighted in purple with invalidation in red. Fibonacci goals, it is prudent to suggest, are nothing more than mere fractally evident and therefore statistically likely levels that the market will go to. Having said that, the market will always do what it wants and always has a mind of its own. Therefore, none of this is financial advice, so do your own research and rely only on your own analysis. Trading is a true one man sport. Good luck out there and stay safe!