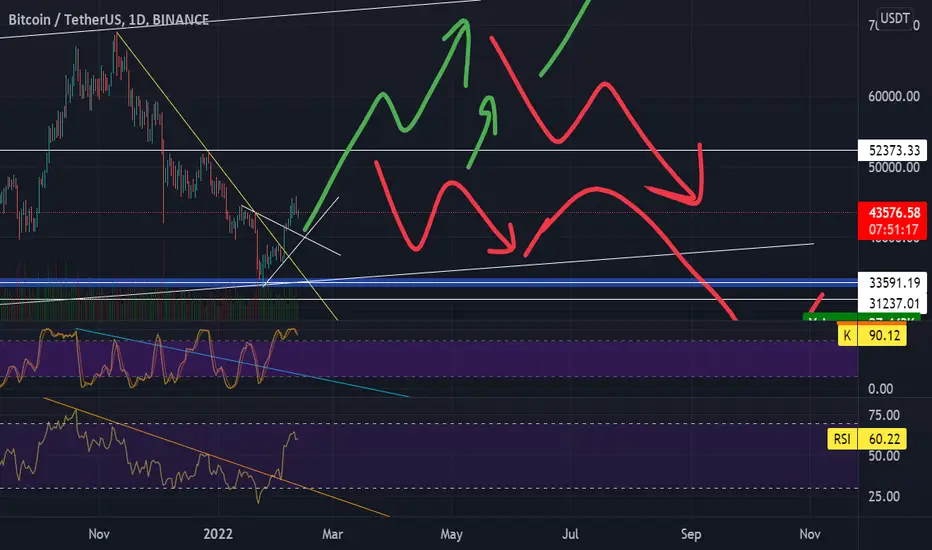
30% chance of ATH soon for BTCIn this theory, there seems to be 3 equally weighted scenarios that may play out in the short term. Regardless, I believe the long term is still a slow trend to the upwards side. However, this could become a more exponential growth if 1 of these scenarios plays out, which has a 30% chance of occurring.
Continuation to ATH: 33%
"Dead-cat bounce" with a head and shoulders forming in the $48K-55k range: 33%
Immediate rejection around $48k-52k, then a drop down to the $30k range: 33%
Yea..."it could go up down or sideways"... I get that, however this is my "more detailed" version of that here.
A healthy movement on the RSI over the next week or two will be the best indicator here for the bullish scenario, and an over correction of the RSI will most likely signify the bearish scenarios.
Bounce
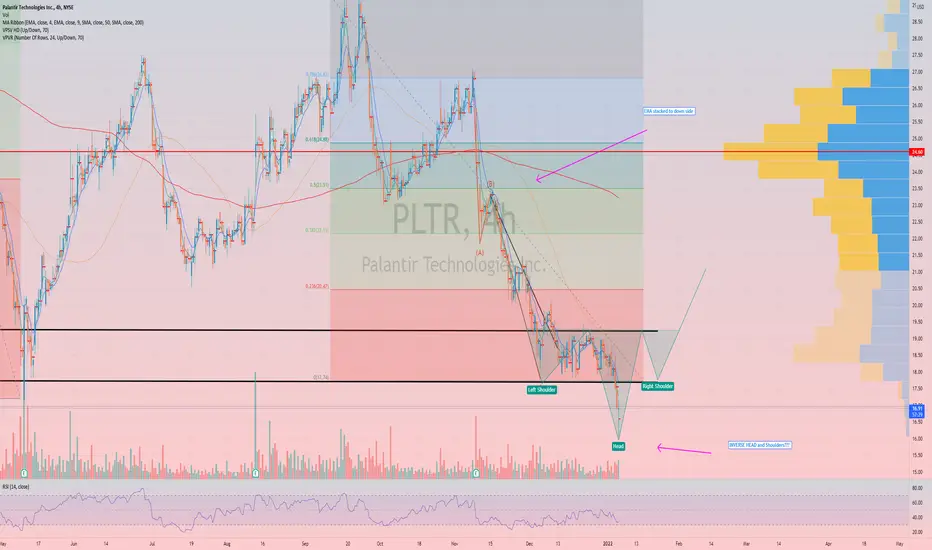
Analysis of HOOD for 7/8HOOD has been doing some interesting things lately, and unfortunately its starting to look weak but also prime for a bounce if market is bullish! Below I have charted out what I believe is the key levels it wants to move towards dependent on market conditions. If VPVR is given up I believe next stop is 13.30, which could bring another rally, orrrr just continue to sell off. Other scenarios in bullish market are a run and stop at 14.50, before then struggling and falling, completing the head and shoulders and most certainly bringing 13.30. Unless it can rally past 14.50, 15.20 and continue on its recovery.
All around plenty of movement if the volume is there.

USDINR set up for a bounce?USDINR has met a perfect confluence of lower trendline support and horizontal support on the Daily, and has just seen a small bounce of this support as confirmation. Before the bounce we saw RSI drop to 26 on the Daily and even lower on the smaller timeframes.
In our last idea we predicted an incoming bounce, with potential to drop to this horizontal support level before the bounce occurs. If we see further positive movement it creates a strong risk/reward opportunity, so setting a stop limit order a little ahead of the current price with a view to catching the early stage of a reversal after confirmation could set us up for a nice trade (NOT financial or trading advice).

$SBUX finding support after pre/post earnings selloff?$SBUX seems to have found a support in this range after a month long sell off leading to earnings and a nice dip after weak report
Holding multiple days support on 1D with a bullish hammer going in to the week of 2/5/22
RSI 28.87 oversold on 1D
MACD tight is tight - looking for continuation or cross to downside
Confirmed break of $98.8 could easily see a move to $102-105 range
Will be on watch to hold support and have continuation to the upside
Wait for confirmations as downside is always possible with current market
Looks like this one might be fun to trade for a bit!
Enjoy and, as always, manage your risk!

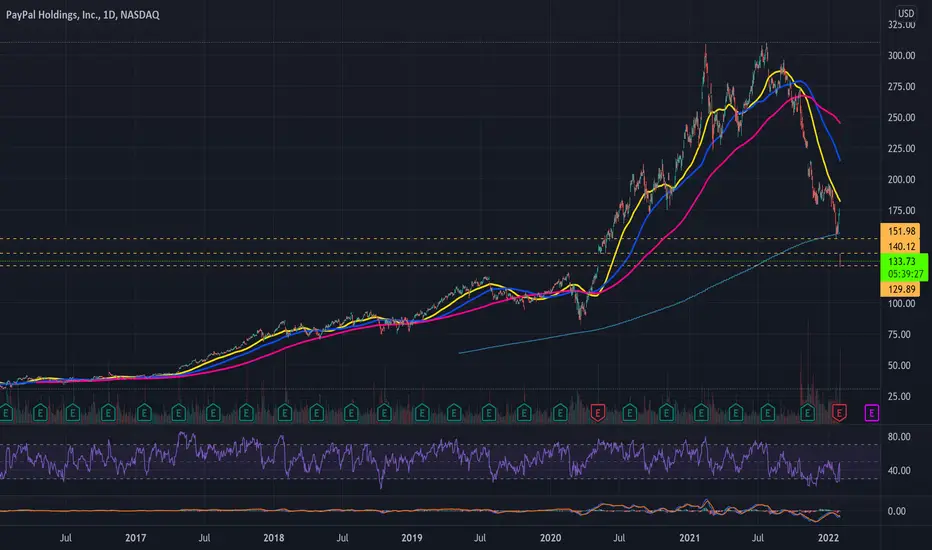
Gap Fill opportunity Hello Friends!
Took a position at $129.89 and looking to fill that $140 to $151 gap fill. That sharp selloff might find traders to fill that gap.
As always thanks for your follows, likes, and comments. Let’s learn and grow together. Cheers!
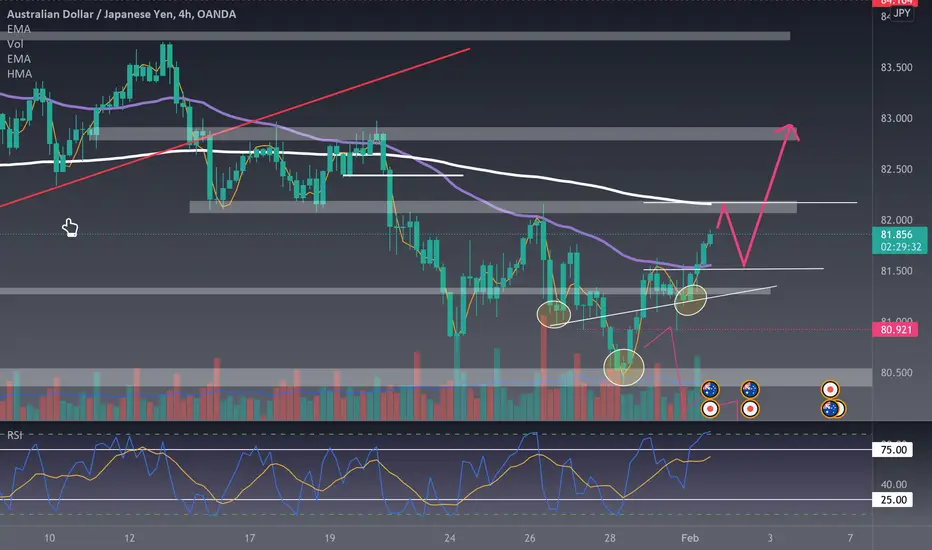
AUD/JPY Inverted H/SAUD/JPY showing strong bullish confirmations. I'll be watching to see if price can get to resistance zone for about a 20% pullback to set itself up for a long-setup. If price does this it will be a high probability trade to the upside.
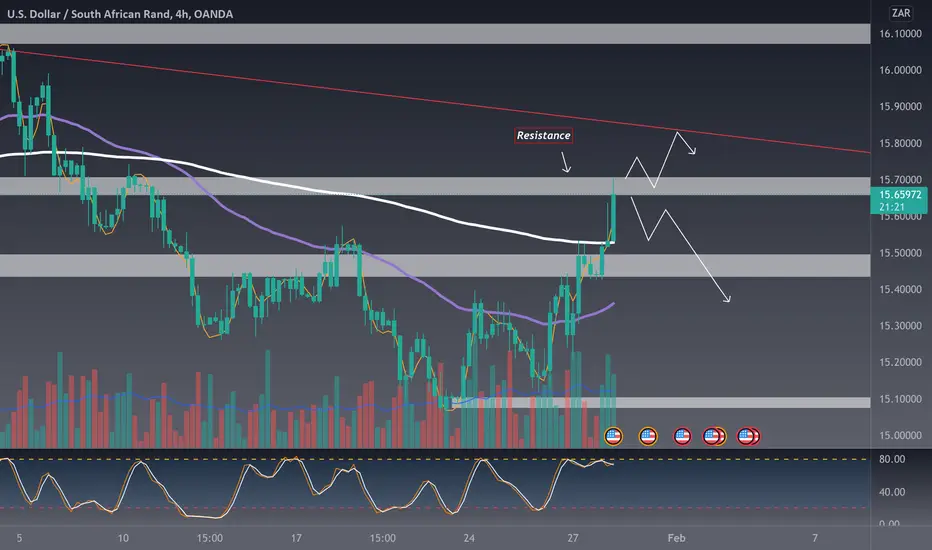
USD/ZAR PossibilitiesThe Rand ran it up the past few days, A few doji's before and during the rally are signs of it getting weaker. So Price can either nearly touch descending trend zone, or bounce down & continue. All in all I'll be watching diligently for some solid confirmation in candle play around these zones. What are your thoughts?
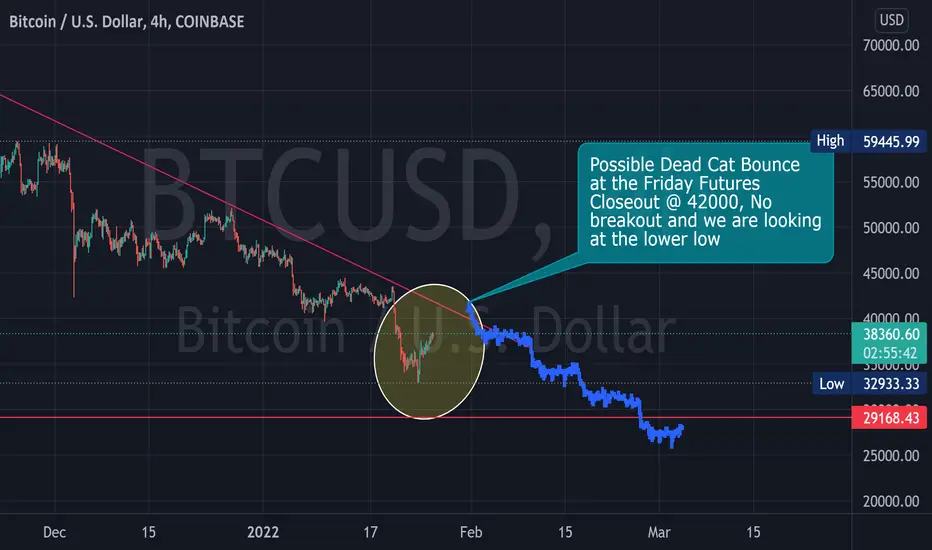
Potential Dead Cat Bounce Looking for the Retracement to the 42000 level by the Friday Options closeout. Strong Break out at 42000 with volume backing it and we continue the Bull Cycle, otherwise, the Dead Cat will bring us to a lower low.
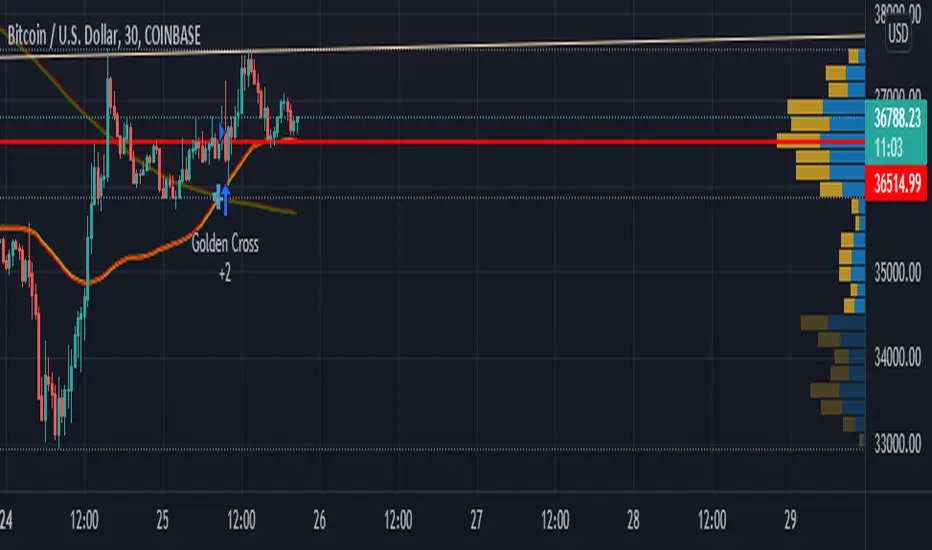
Golden Cross on the 30 min chartIt looks like it is almost ready to cross on the 45 min as well this could play out for a nice reversal bitcoin is like a box of chocolates you never know what you are going to get.
SPY reversal areaLooking for SPY to pull back to the potential reversal area. Several big S&P stocks looking to pull back to the trendline.

If we get a tradable bounce this is the first step🟢 $Tick making new highs and 5SMA on the 5min chart goes positive and is hitting aggressive +1000levels. It has to stay here ange get steadily stronger for a rally. This would give us idea if we will get a bounce into mid week.

BTC: Panicking for no reason...yetBTC
~ Interesting how everyone is panicking when it has clearly yet to break key support on the weekly and has even begun to bounce off of it
~ There is even bullish divergence on the RSI as well.
~ I am no expert but it ain't raining until it's raining.
If we break that support line, that when I would be worried. As of now it seems to be a BTFD

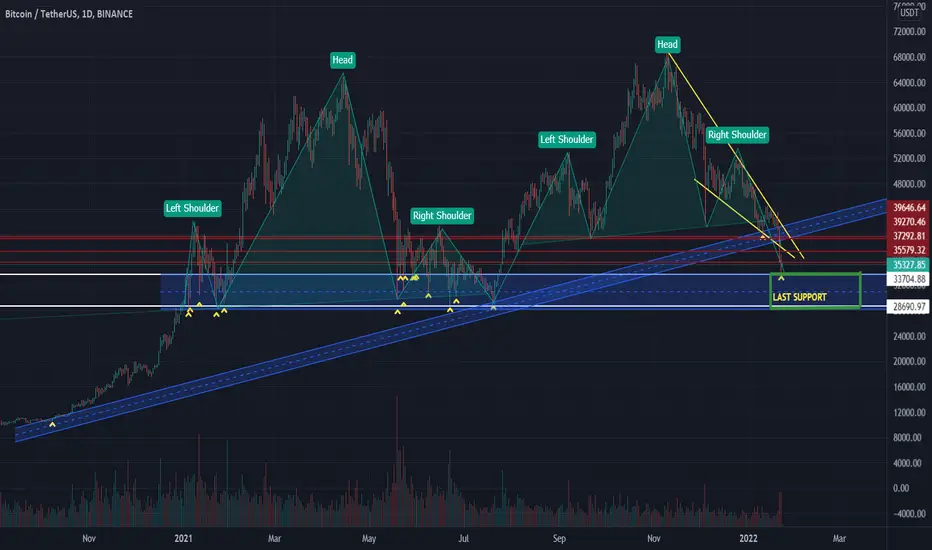
BITCOIN'S LAST STAND! THERE IS THE MOMMENT OF TRUTH!Bitcoin had 2 massive head and shoulders patterns, with huge correction effects!, but the blue support zone deffended the price for more than 15 times! Will it hold for once more? If it hold we will have a huge bounce to the upside? If it breaks the SUPPORT the price Target is at 20k range!!... But never panic Sale! The bitcoin is here to stay longer than some people thinks! It's a REVOLUTION and now or later everyone will understand it! The late ones will regret it!
CRYPTODROU
Stay Strong
ES Correction & Potential Bounce LevelsWe have been in a recent downtrend on $ES $SPX and a lot of traders are probably wondering where the bottom will be. A break back up toward 4553 and a hold above 4565 would signal that we have bottomed in the short term. That would not necessarily mean the bounce wouldn't fail to retest the lows but here are some potential bounce levels.
Fibonacci levels near 4361, 4278 and lower support zone below October lows near 4170-4180. This would be considered an extreme target and unlikely to reach in the short term. However with recent political headlines and the market having a risk off nature, no one really knows where it will bottom.
Thanks for following and watching. Feel free to comment and share. Stay tactical and stay safe.

Eth goes lower, might have a impulse wave upwardI think eth will touch the bottom or near bottom of the triangle and then have an impulsive bounce. The bounce might not occur but is worth watching for a good swing set up

$GME bounce at the 78.6% Fib level???Looks like we had decent support around this 78.6 fib level. It is also the top of a gap zone from previous price action last Feb. The question is, how hard can we bounce off this fib level?


MSFT - Bounce in 3DCovering algos returned MSFT to the Daily Gap lower bound, the choppy action of last week has been replaced with ranging stair steps. MSFT recovered the daily LBB, currently in a Doji .

ENPH - bounce here? on watchVery strong support here
Oversold RSI
Can bounce from here at least to 177
Good fundamentals and forecast

DDOG - can it bounce?30% from the high
It looks like the stock can bounce hard from the strong support level

Blackrock at key supportAs you can see, the price has respected the 200sma (blue) since the break from Covid lows.
Risk-reward-ratio presented is interesting as you will figure out if you are right or wrong pretty quickly; especially since the Bollinger bands have been contracting as we have consolidated.
Trade setup:
Target around $1000 for profit-exit.
Loss-protection exit 1-2% under the 200sma.
Fundamental Analysis '
- The $TNX (interest rates) has broken out which is positive for financial institutions.
- There is a cyclical tilt to the market as high valuation companies in the technology sector are hit hard.
* Note: Earnings are starting at the end of next week for the financial sector.

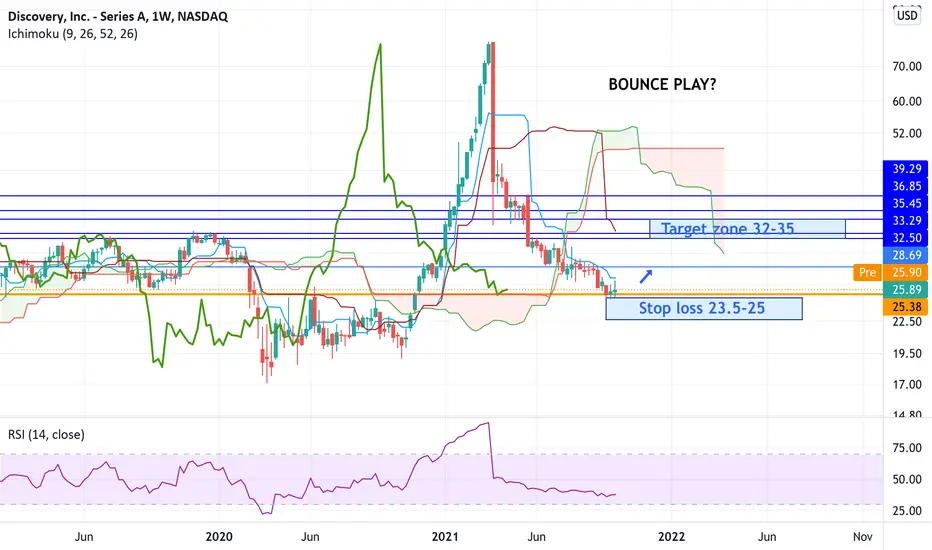
DISCA: LOW RISK BOUNCE SWING PLAY
Disca has been dropping since March and has now reached an Ichimoku support on the weekly chart.
My support is based on the flat side of the cloud.
Quiet good risk/reward play . One could buy at the current price level with a stop between 24.90 and 23.5 depending on your risk tolerance and sizing.
My target is between 32 and 35 as you can see on the chart. If we reach these target we will reassess and see whether we have a sustained trend reversal.
Trade safe!
More on Ichimoku (by Investopedia):
The Ichimoku Cloud is a collection of technical indicators that show support and resistance levels, as well as momentum and trend direction. It does this by taking multiple averages and plotting them on a chart. It also uses these figures to compute a “cloud” that attempts to forecast where the price may find support or resistance in the future.
Key takeaways:
The Ichimoku Cloud is composed of five lines or calculations, two of which comprise a cloud where the difference between the two lines is shaded in.
The lines include a nine-period average, a 26-period average, an average of those two averages, a 52-period average, and a lagging closing price line.
The cloud is a key part of the indicator. When the price is below the cloud, the trend is down. When the price is above the cloud, the trend is up.
The above trend signals are strengthened if the cloud is moving in the same direction as the price. For example, during an uptrend, the top of the cloud is moving up, or during a downtrend, the bottom of the cloud is moving down.