TO BOUNCE OR NOT TO BOUNCE, THAT IS THE QUESTION..
Bounce still looks like it has some life in it, right?
Overall, the chart looks good. When crypto has a massive push, you can always count on it to consolidate. Unless it is something that is revolutionary, but even then it has to have a cooldown. Bounce looks like it is about to go. All the signs point to yes on my side, but of course, be cautious and make sure you have a strategy before you get in. Y'all have a good one, and happy Holloween.
Bounce

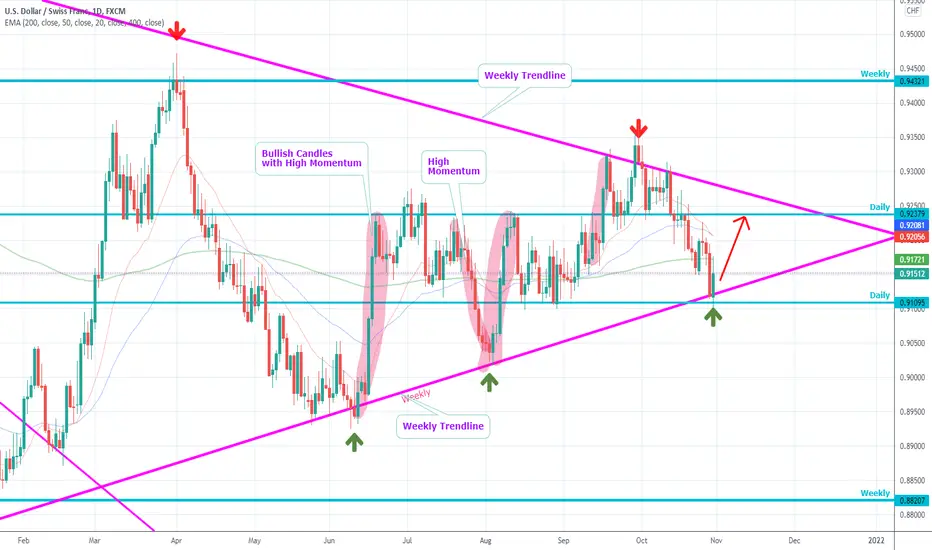
USDCHF - Price @ Trendline + SupportSummary of the indications:
Daily Trend --> Symmetrical Triangle
Weekly Trendline Support
Daily Support
---------------
Hi Traders!
The main setup of the market is that the market reached the weekly lower Trendline,
which is often respected. This Area also confluences with the daily Support.
Also, the high momentum on the bullish movements in comparison to the bearish indicates
strength on the bullish side.
If you have anything to add, another point of view or something else to share, feel free to comment!
Thanks and successful Trading :-)!
#ANKR 4HR Chart - DCB Possible?Ankr just had a nice run up but it looks like a Dead Cat Bounce (DCB) may be at play comparing it to the last pump. Remember the 786 fib line with a DCB.
What are your thoughts? Comment below and hit the like please. Thank you!
Disclosure: This is just my opinion and not any type of financial advice. I enjoy charting and discussing technical analysis . Don't trade based on my advice. Do your own research! #cryptopickk #bitcoin #altcoins

MAXR Cup & Handle + Fibonacci Bounce?!WEEKLY CHART
- Cup and Handle pattern. The handle needs stay above this level.
- Needs to bounce around $25.40. (.65 or .618 fib level)
- Zacks Investment Research Upgrades Maxar Technologies to Buy. (3 weeks ago)
- NGA Awards Maxar With G-EGD Contract Renewal For Mission-Ready Satellite Imagery (Valued at $44 million. This is the second of three option years for the contract, which has a total value of up to $176 million.)
Dislike:
- Volume is getting weaker.
- Earnings on 11/3.
-----------------------------------------> I like MAXR $40 Call 4/14/22 <-------------------------------------------------------

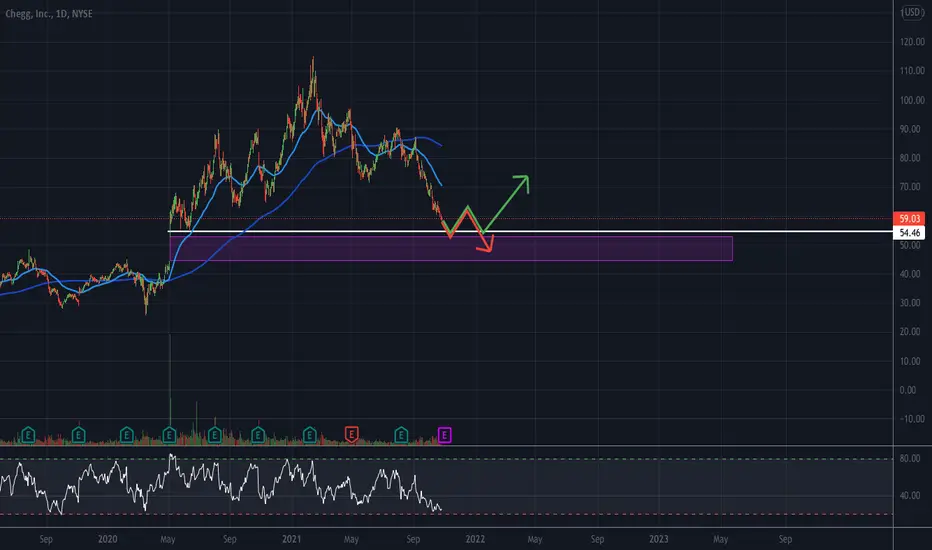
CHGG Bounce??- Currently in a downtrend on the daily chart (50MA below 200MA) but still in an uptrend on the weekly chart (50MA above 200MA).
- Support near 54.80.
- CAUTION: $10 gap below (between $44.33-$53). CHGG could fall through support near 54.80 and attempt to close the gap near $44.33.
- Earnings on Nov. 1st. Could go either way... 50/50.
6-10 Week Outlook: Could drop to $56 before climbing back near $64.50
Hopefully this will help you formulate your own trading strategy for CHGG.
PTON: ARE WE GETTING THIS BOUNCE?PTON:
Winter is coming. It's cold outside. Shall we exercise at home?
PTON bounced off a big support at 82. Is the bounce over? I don't know.
Is it too late to buy? For a long term investment, not too late. For a trade, maybe not too late, but I like it only above 88.20-88.50
Targets on the chart.
Trade safe!

SO, WHEN ARE WE GOING BOUNCE? It seems a little off, but I like how this crypto is moving. Once it tags a resistance or support it has a reversal. The consolidation time is short, which helps leverage and be a little more predictable. At this time, it's on the way down, which is not bad. If you are an impatient trader, this movement is good for you. Once this crypto starts "Bouncing" it will be tough to stop, or you know what else could happen.... It could just dribble off the court into oblivion...

WILL BOUNCE, BOUNCE? Well. It played out like I thought it would.. Bounce, Bounced in the early morning and had a 15ish percent run. I believe by mid-noon, you will see a surge of vol and buyers coming in to play. If not, you know how it goes. Anyways, you all stay cautious and use leverage to your advantage when you are trading something like this. I am not your financial advisor, so this is not financial advice. If anything.. run....

All we need to do is BOUNCE...It looks like we have another Coin on Coinbase that has just been listed and is making some pretty steady moves. BOUNCE has the potential to 2-3X... You know how it goes. Once the movement has started, it is hard to stop. I mean, heck, It took the bad news from China, for like the 6-7th time to slow down SOL. Now, please do not think I am comparing this coin to SOl, but to me, crypto is crypto. There will always be one that is better than the other. I see some promise in this one for the short term, a quick in and out, then reinvest in some other coins. If there is something that I'm missing, please let me know. I am here to learn and pass on. Thank you, and have a good one...

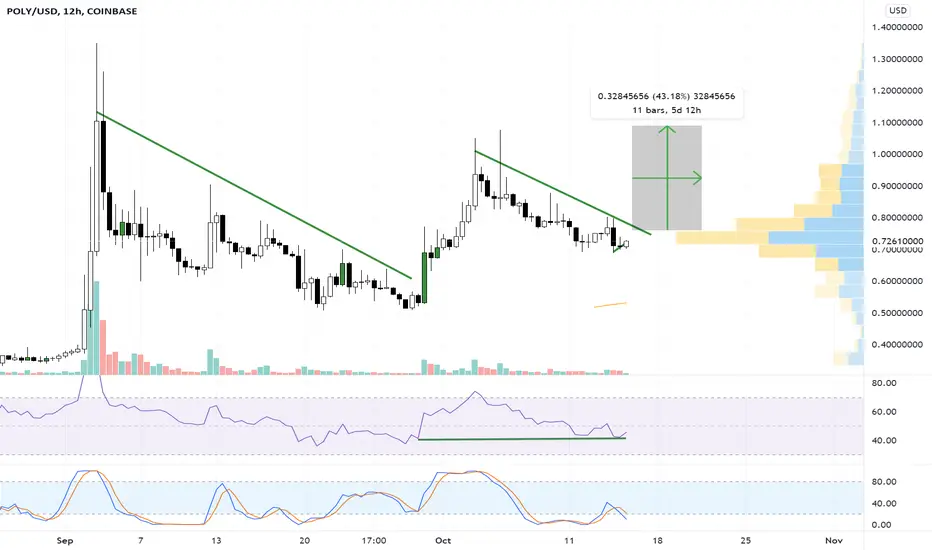
$POLY RSI trendline $POLY one more bounce 🤔???
Lookig for bounce on RSI trendline, good consolidation last 2 week. We need it!
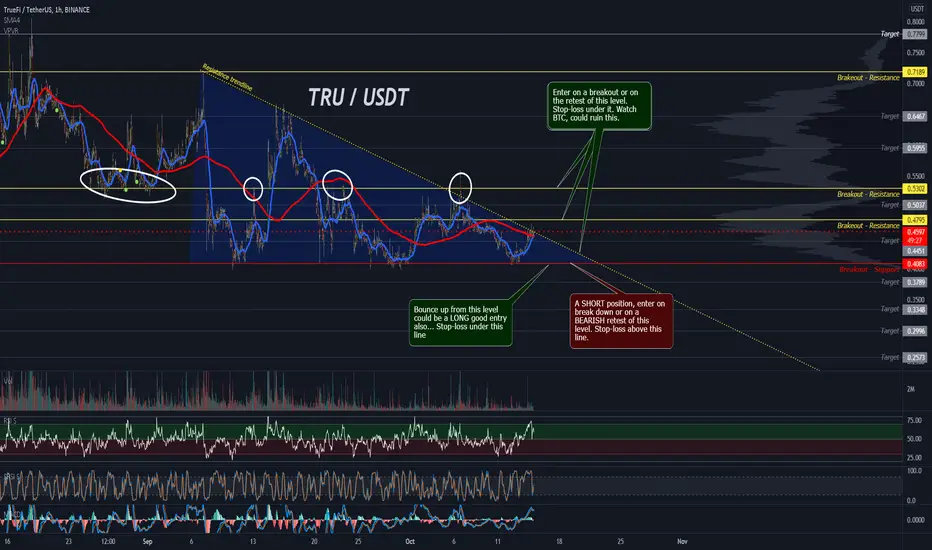
TRU descending triangleThe bearish figure, but seen many times it break to the upside. More chance for one more retest of support level, but in a nice position regarding 20 and 200SMA. If going up, watch that big resistance at 0,53, It was big support before but also bounced down from it... Good luck traders
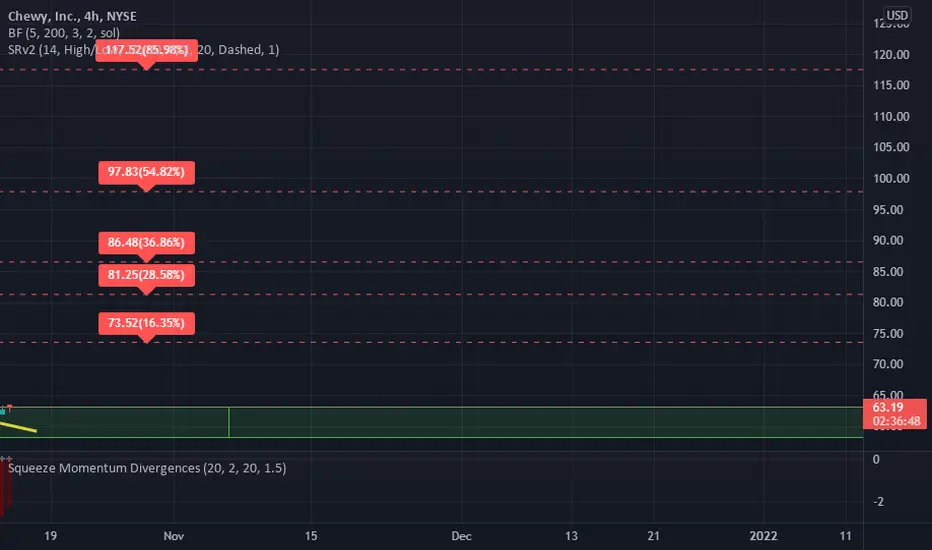
CHEWY MAJOR BULLISH DIVERGENCE!!4HR Time frame shows Bulllish divergence into major demand Zone .
Fundamentals for this company are nice, nothing but nice accumulation by the big boys.
1st Target $73, lock in profit right there and ride out the rest
Patience Pays and I am 100% expecting a huge run from CHEWY going into the end of the month. Option IV is dirt cheap, this will be the next big play. I trade the naked chart just using supply and demand zones.
2 years if experience in the market. I believe tops and bottom are shown by divergences. Not Rand candles and Elliot /Fibs counts
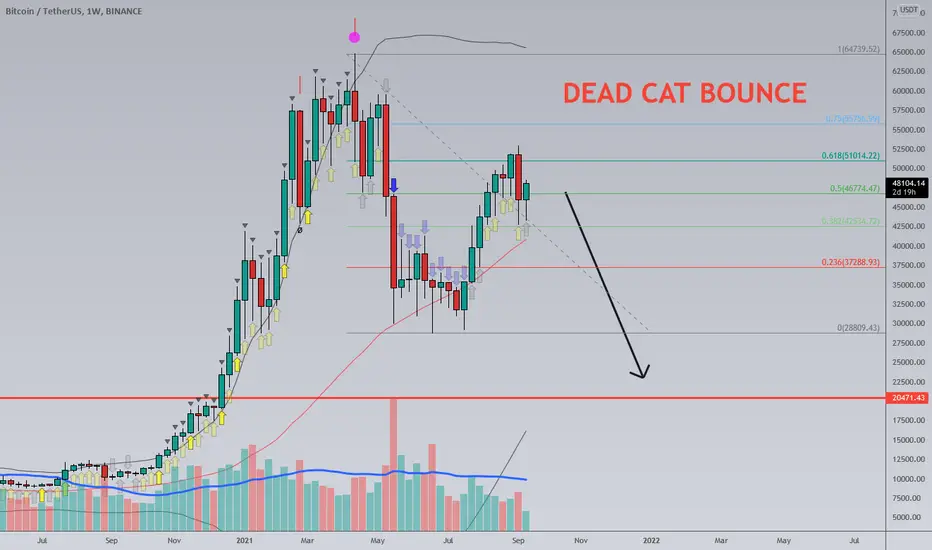
Be Ready For a Major Crash on BTCAs we can see, we fall on the 61% which is often the dead cat bounce level or the B wave in Elliott Wave.
The stock market is probably ready to make a major correction soon the Evergrande news can make it faster.
And we have to remember we have some single print in 19.8k to 21k (this is price was hit only a single time which market often retest.) without talk about unfilled CME gap which people think now it will be never filled again.
FTM new channelMade a nice profit from the last FTM idea, pls check the link below. Since breakout, two weeks ago, FTM respecting this ascending channel and now looks like it could create a new one above it... Respected new parallel, but it was also horizontal resistance level so it still waiting for confirmation. Now I have some ideas about new entry points... Interesting is that the lower channel resistance level (now should be support) is near fib 0,382 so it could be the first level to watch on for possible bounce... Breaking that high we got rejected is also a good entry. Entry points are on the chart. Good luck traders

US500 approaching support levelsThe US500 might find some support around this 4280 support zone. Will wait for a pause in that area to confirm actual buyers stepping in.

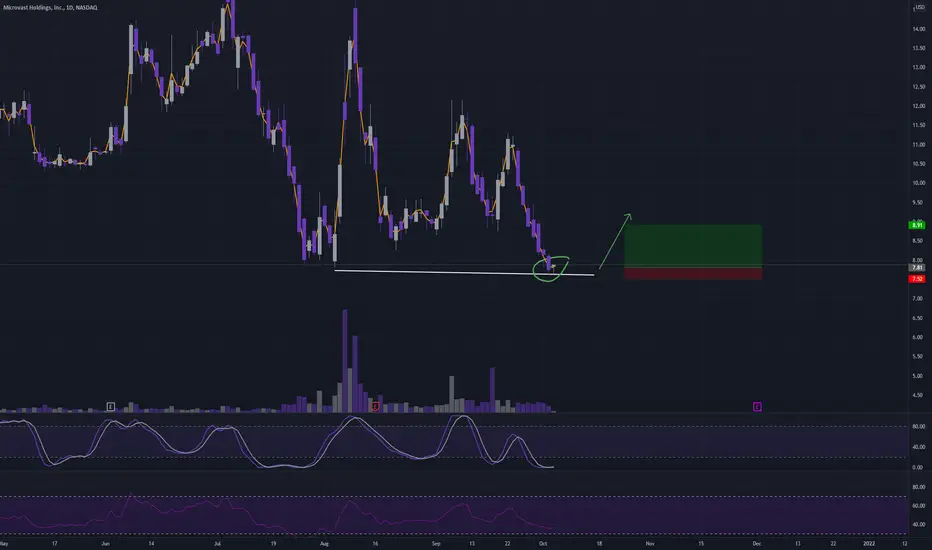
MVST - Tweezer Bottoms - ReversalThe daily formation is turning into tweezer bottom signaling a potential reversal from this low.
14% upside
3.7% downside
3.79 R/R Ratio.
AUDUSD: London SetupThis setup could provide plenty of profits if executed correctly.
I will be looking to see how we react after breaking the small head and shoulders pattern.
If we reject the order block holding below it, I will be buying into the region as illustrated.
Leave a comment and/or message us on how we can improve and provide better content, we are open to suggestions to create a better experience for you!
Keep in mind that the analysis provided is not 100% accurate and that you can never be certain of the markets. This information given is not financial advice, always do your own research.
Thank you for reading,

1VG | Bounce play-Consecutive violent drops (3 is ideal)
-5% to 10% red candles.
-Last candle showed sign of reversal - hammer.
TP: Next day candle or near next fib resistance.
Exit: Below ATH

i said SOLAUD would bounce like a KangarooAnd it bounced like a Big Red Aussie Kangaroo.
Brilliant trade-in SOL.
Go and lay on Solana Beach now.

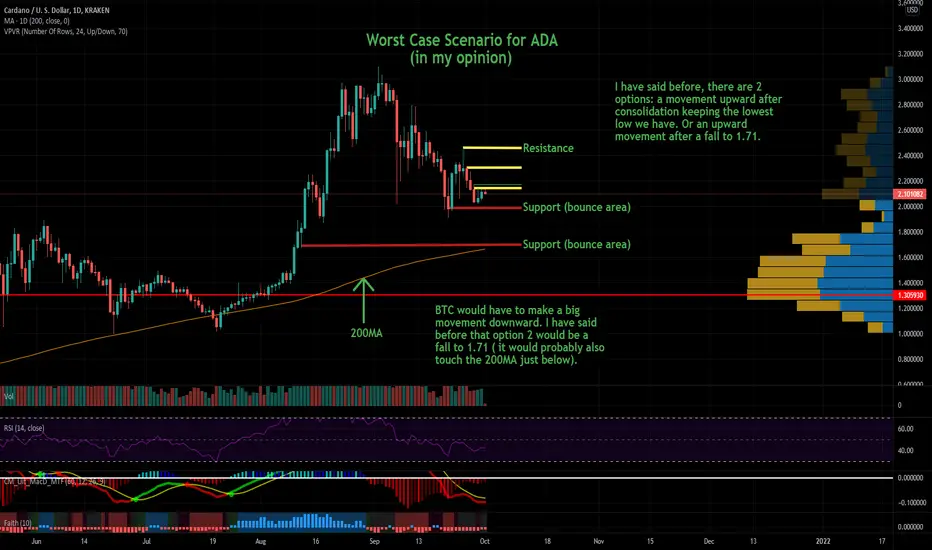
ADAUSD Worst Case ScenarioImportant things to note:
This is just the roadmap if I am wrong and the price of BTC falls for 1 more movement or ADA over corrects.
Price would fall to 1.71 and likely touch the 200MA.
Right now, we look bullish so this isn't the most likely scenario, it is the 2nd option.
The price would have to fall below 1.91 to signal this movement.
This is the option I had originally believed was the likely move.
Once, I saw the bullish signal from BTC, this changed my mind.
The price drop to 1.71 would be the end of the correction.
So a lot of people have been asking me what will happen if I am wrong and BTC creates another low or the retracement of BTC do not represent the movements of ADA. The answer to this question is my original target of 1.71. As I said before there are 2 options, the one I choose would be the current low of 1.91 remains intact and the price consolidates and moves up from here. The second option would be the movement to 1.71 with a touch of the 200MA and a move upward from there. These are the only 2 likely scenarios that I can see at the moment. The first option of a move up from our current lowest low is what I think will happen. This may not matter to you much because the outcome of both scenarios are a movement upward and an end to the correction. If I am wrong, this is the scenario that will play out. We will see what happens. Right now, my idea seems to be looking pretty good! BTC and ADA are very close to a cross via the MACD on the 1D and I see bullish structure starting to form. I will keep an eye on ADA and update you all accordingly! Thanks again!
I am going to make a video soon teaching everyone my approach to charting. I will cover the entire workflow process I go through. I hope you enjoy it.
Tell me what you think?
This is not financial advice. DYODD.
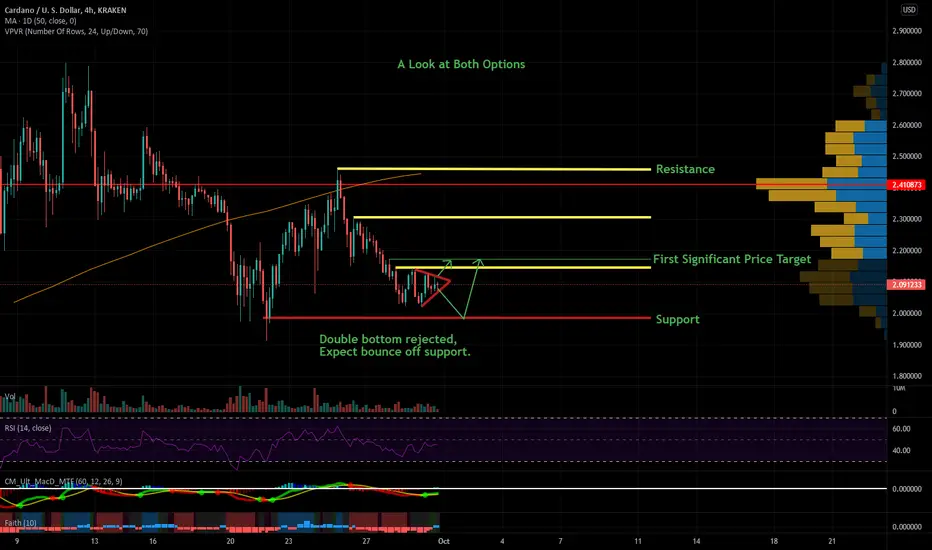
ADAUSD A Look At Both OptionsImportant things to note:
Everything looks great.
Price movements have bullish structure and we are in the start of a bullish trend.
This means we have likely seen the lowest low and the price will move upward.
The double bottom we saw was denied.
We will have a price decision.
Watch for a break in the first resistance to our first significant price target.
Set alert for 1.91 and the first resistance line if you want to be aware of all scenarios.
Important dates:
I will update this soon when I post about the summit.
This will probably be my shortest post ever! So, I thought we would get our push from the double bottom, however it looks like ADA has other plans. There will be a price decision here soon. It will either break to the upside of the pattern I made, or to the downside. If it breaks to the upside, we will simply break the resistance and hit the target, if it breaks to the downside, we will likely see a bounce off of support followed by a resistance break and target hit. Nothing is different in the targets from last time. BTC gave us an important confirmation yesterday. Now we will see the bullish trend start to move. There really isn't too much to talk about right now. Everything is the same at the moment. If you are worried about the price movements, set an alert at resistance, support, and 1.91. Things are looking great! I will continue to watch ADA and update accordingly. Remember, try to relax, we are past the hard part at the moment.
I am going to make a video soon teaching everyone my approach to charting. I will cover the entire workflow process I go through. I hope you enjoy it.
Tell me what you think?
This is not financial advice. DYODD.
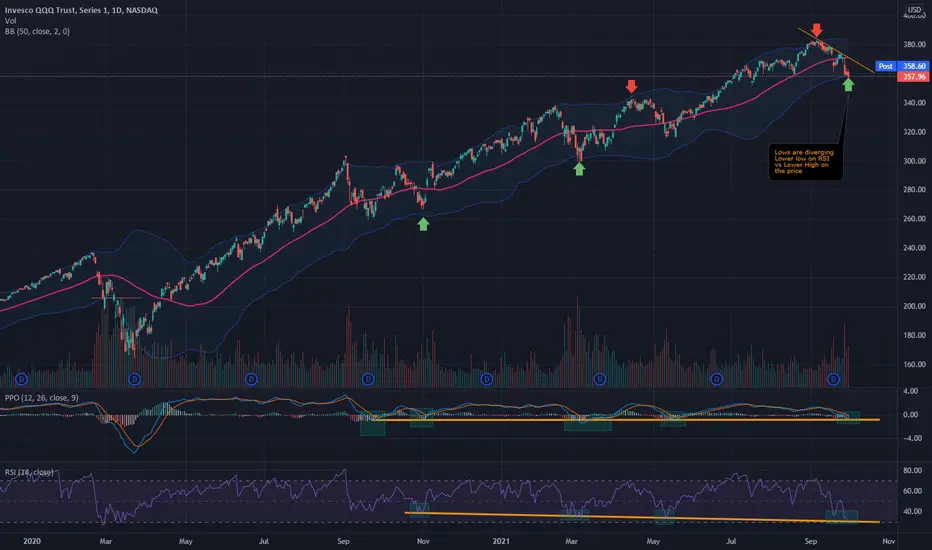
QQQ Daily - Is time for a bouncePrice laying on bottom of 50 Bollinger Band
Also at RSI & PPO Resistance
BA looking for trendline BA broke down under 200 and 50 MA. High selling pressure across SPY today. I expect it to hit 218 trendline. Under trendline is dangerous short term
This is not any form of financial advice.
