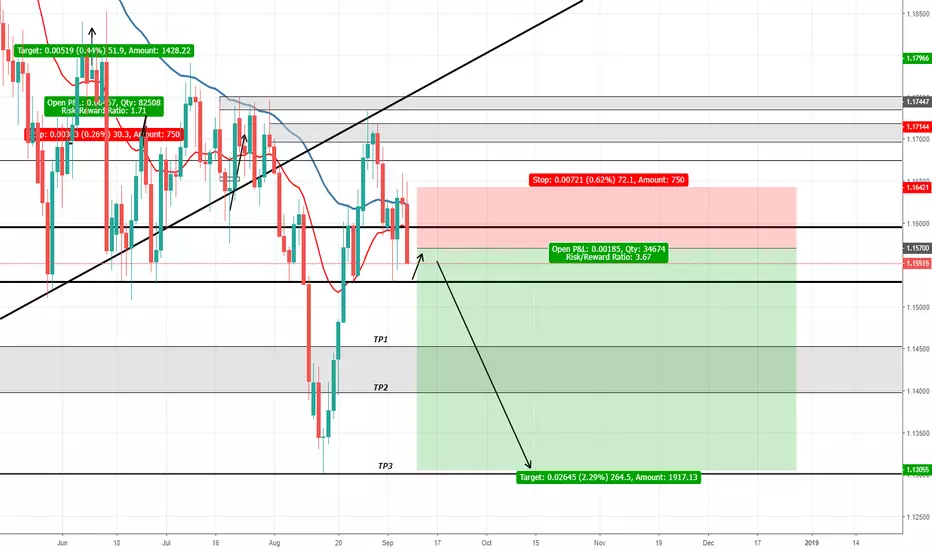
eur/jpy ideaWe are going to wait for the channel to be broken as there is a double bottom recorded on the 4 hour chart as well as this there is an engulfing candle on the daily where there is also a major support level, I will buy on the retest when it breaks out of the channel.
Break
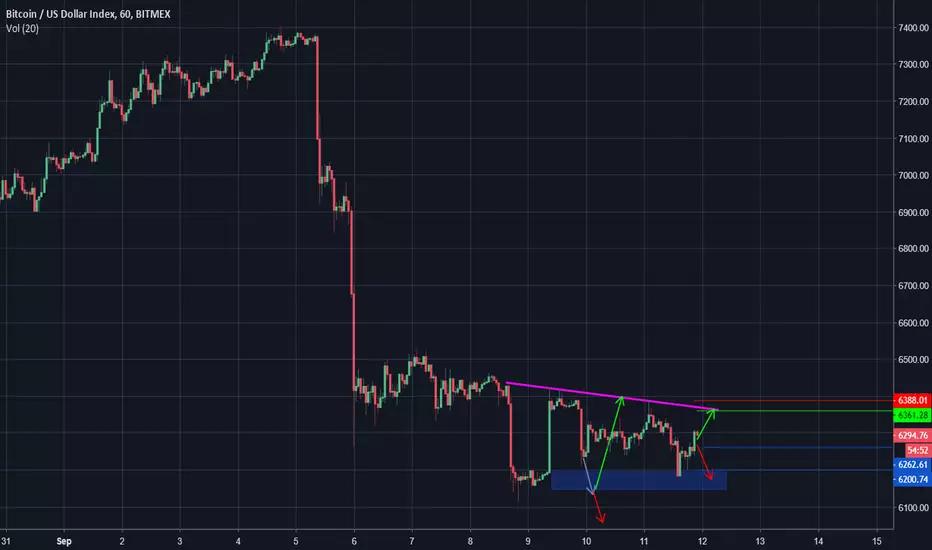
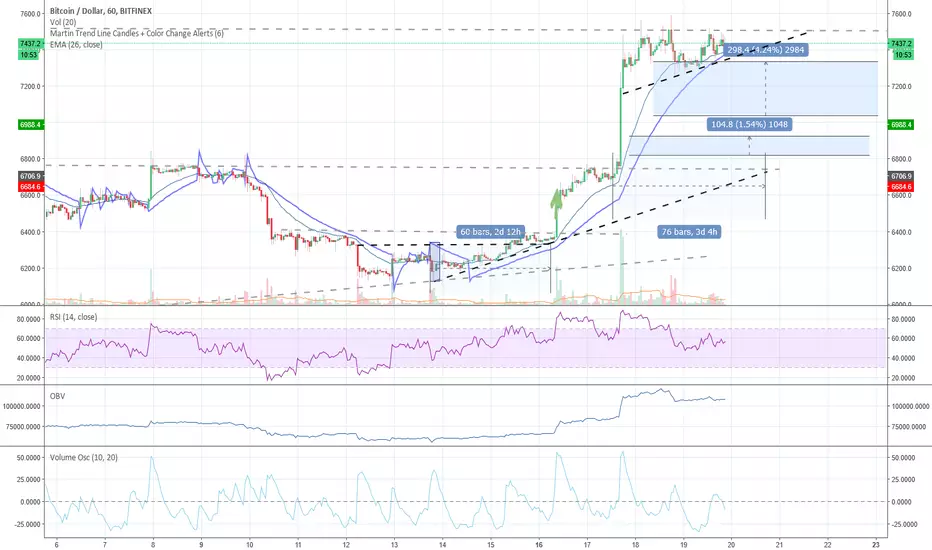
BTC continues to tighten up! Break incoming...Well we continue to tighten this pattern up. Last chart I discussed a few levels, mainly our resistance which had our triple top of $6640, 6641, and 6642 at it and the bulls trying to form their higher low which the 4 hour chart at the time was setting $6511. I personally did use this as a stop for a small position and then used a much looser stop in case the whales were fishing for stops. We got a quick spike down to $6492 so did stop out and lock in profits for some more of my position and rest remained in position. Bulls pushed up to $6585 and I re-added on brief consolidation around $6560 just to re-fill what I had stopped out on. Bulls are now back to testing $6600 area with our spike high at $6613. Otherwise we wait patiently for $6640s resistance to break. New support is at $6492 which lines up perfectly for daily chart. This is an extremely tight range for a daily chart so we know a break is coming likely today or tomorrow. I have my stops in place for current position in case we see a bear break and have my stop buys in place for a bull break to add to the position.
Just My 2 Sats!
*** Edit - and as I was typing/posting the bulls are making their move. MUST see follow through here

Buy order on BTCUSDFirst post on BITCOIN!! Break and retest of structure// plotted where our targets are.

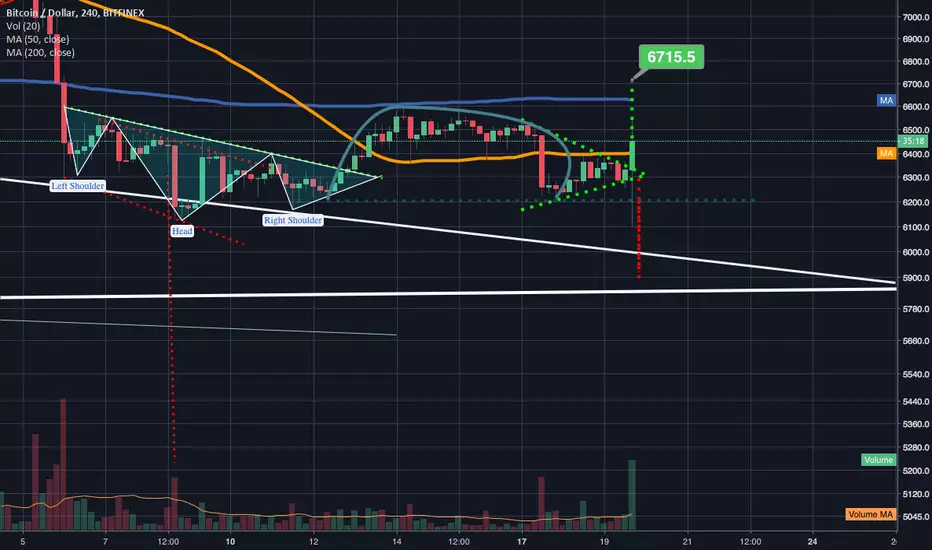
Big bull pump after mega bearfake should send us to $6715Very exciting price action in the past hour looks like we are now back above the 4hr 50ma and appear to be breaking up out of the symmetrical triangle...this could be another megafake the other way of course so we must take that into consideration and still watch for candle close and follow up confirmation candle price action but at the rate it is flying upward probability is very high that we will see a bull break...be prepared for a bull trap though just to be safe.
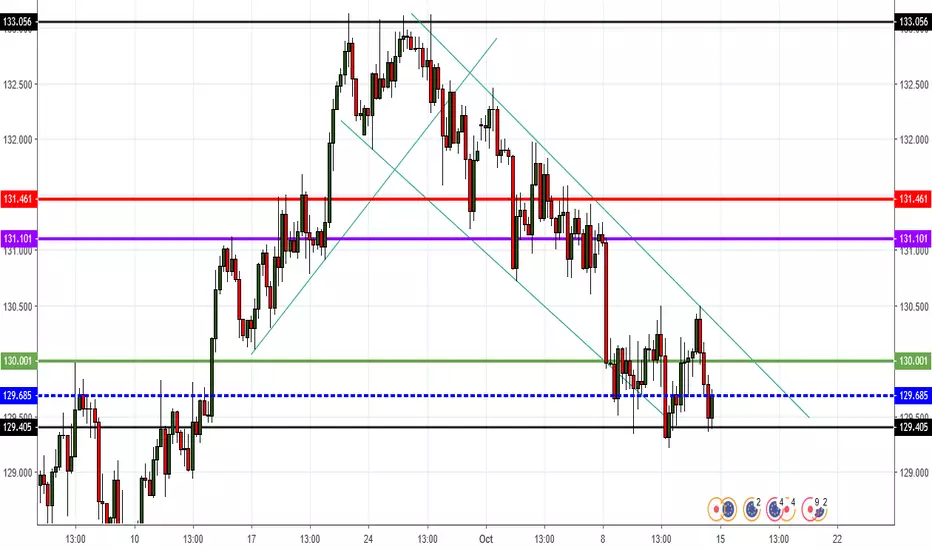
Will the bart end soon? We touched the support levels i mentioned before and it bounced back bit, but we still cant hit the 6400 POC. I think the 6360 might be good entry for short and the redline is stop loss i will look for my short ( if we gonna break the 6400) . I think 70:30 we may touch the 6360 above soon and 30:70 we go down back to support levels at 6160-80 without touching the 6350 above . If the 6360 hits without stop loss trigger i may look for 1. PT at 6260 level and second one on 6200 level. After first PT i trail my stop loss to 6280 levels. What do you think are we gonna break the 6400 or stay bouncing around here for longer?
EUR/USD - 700 Pips Down Potential!Hello traders,
I bring you here an interesting view LONG TERM on EUR/USD.
In this chart we can see EUR/USD is about to become a long time bear.
We have a bearish cross on MAs, Broke an almost 2 year old support trend line and now after retest the trendline a Shooting Star Candle.
This trade has big downside potential and for those who love swing trading will certanly appreciate this analysis.
I personally am more of a Daily trader, but i spotted this oportunity and wanted to share with you all.
If you find this post useful dont forget to leave a like :)
See you on next trade,
ForexAcademyClub

EUR/USD - From Bull to Bear! Hello traders,
I bring you here a trade on EUR/USD, and i must say, EUR/USD is about to Become a Bear for a long time!!
I was analyzing the weekly chart and price broke a trendline with almost 2 years and has just retested it and made a Shooting star on the weekly chart.
Bearish MAs crossover on the Weekly chart also confirms more downside movement, the final target on the weekly is almost 1000 pips down. I will post later a weekly chart technical analysis if you want to so you can see how crazy can things get on this pair on long term! Big opportunity for us traders for sure.
We are now going to touch de 0.5 Fib area and maybe going to retest the 0.382 area, and after that a big move down is expected.
Wait for the entry zone to SELL!
Feel free to comment your ideia below! If you like this post dont forget to leave a LIKE i appreciate it very much ;)
I will update this trade when needed.
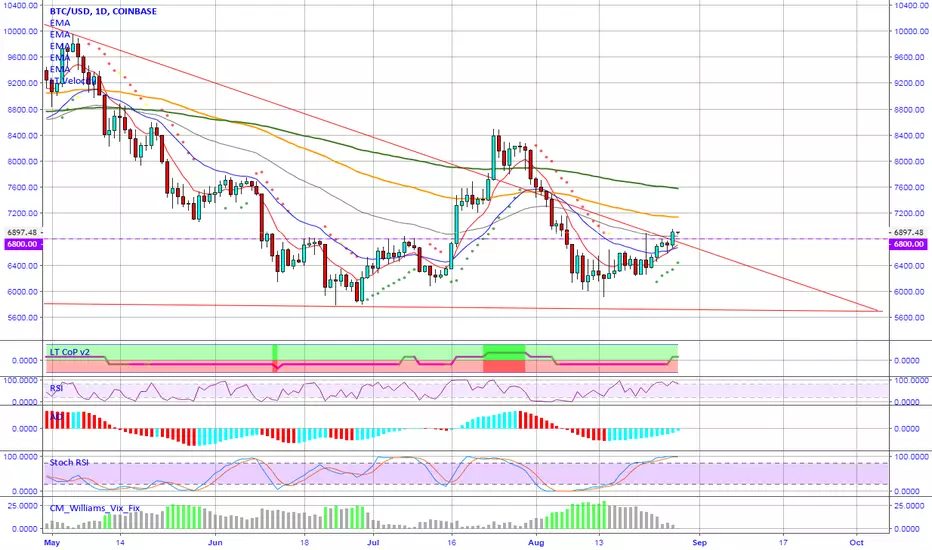
Bitcoin fake out or make out? $8.3k?? [BTFD]quick chart to show some important changes with the indicators after the lil boom towards $7k
mega squeeze or does this have momentum to go higher?
gotta close above 6800 on the daily to get bulltarded dreams back again
the nice collection of rather swish indicators showing a very good signs of a change towards the upside and further gains would bring a golden cross, all good signs for TA based trading
bless ya trades :)
Big Experiment (part 2). Line Break ChartBITFINEX:BTCUSD
Dear friends,
I continue my big experiment with different chart types. In the previous training article, I described the advantages and disadvantages of Renko chart. After that, I was testing the signals, sent by Renko, and those, provided by common technical analysis tools, like MACD and moving averages, on different cryptocurrency pairs.
I analyze four-hour timeframe in my experiment.
Finally, after one week of tests, I can draw the following conclusions:
• The quality of Renko signals mostly depends on the right box size.
• MACD oscillator is quite good to find out the appropriate box size. You adjust the box size in the selected timeframe until there are as few false signals as possible, or there aren’t any.
• As Renko chart hardly indicates the minor sideways price movements, you can reduce the periods of moving averages by a few times, so that their signals won’t be too late.
• To filter false signals, sent by Renko, you also need to use candlestick chart at the same time.
• A perfect buy/sell entry point is when the signals in the candlestick chart coincide with the Renko signals.
An example of a perfect buy position:
An example of a perfect sell position.
Finally, I can conclude that Renko chart is an excellent instrument that will perfectly supplement any trading system. The drawbacks are the need to adjust the brick size to each timeframe and the time lags in signals, compared to the corresponding ones in the candlestick chart.
The next chart type in my experiment will be Line Break Chart.
Although it may seem complicated, it is quite simple to apply. It displays only the price moves that break through the last three closing price levels.
The default number of Line settings is three, but you can change it just like the Renko box size, in order to make the chart more or less responsive.
Unfortunately, I haven’t discovered the way to change the type of the levels displayed. I believe it would far more interesting to see not the closing price lines, but, rather, the highs or lows, because these movements provide the final signal to determine the trend direction. So, I really hope that someone will hear me and develop such an indicator ;))
To make it clearer for you how a Line Break Chart is built, let’s study it on a real example.
There are two charts of the weekly timeframe above. The candlestick chart is on the left. The Line Break chart is on the right.
I marked the analyzed zone with the green circle. You see, a long bullish candlestick emerged on July 16. It broke through the closing price levels of the three previous candlesticks (I marked close levels by numbers), and so there is a bullish bar in the Line Break chart (green). Besides, the bar’s high coincides not with the high of the Japanese candlestick, but with its closing level.
As you see, in this case, the opening level of a bar in the Line Break chart is always the closing price level of the previous bar.
The indicator alone sends quite simple signals.
1. A buy signal is when three consecutive bearish bars (down lines) are followed by a bullish one (an up line).
2. A sell signal is when three consecutive bullish bars (up lines) are followed by a bearish one (a down line).
Here, I should mention that many Line Break chart users suggest expecting an additional bar in the signal direction, following the reversal bar (breakout).
Therefore, if the pattern is not complete, and down lines are alternated with up lines, you’d better avoid trading.
As known, Japanese like creating names for their patterns, and this case is no exception.
For clarity, I presented the bullish pattern in the Line Break chart.
I marked three bearish bars with the red circle, Japanese call it Black Shoes.
The bullish bar, following three black shoes, is marked with the yellow circle. It is called Suit. A white suit means to buy, and a black suit means sell.
The line in the green circle is the confirming bar, it is called Neck.
Japanese say that you are to buy when the market “puts on black shoes and shows the neck in the white suit”, that is the market a kind of puts on a white bullish or a black bearish suit before it moves on))
It is important, how long is the Suit line; if it is not that long, a false breakout is likely to occur. It occurred in the first case, when the Suite was rather short.
In the BTCUSD price chart above, I present an example of a sell signal (similar to the bullish one), when the market has put on a black suit.
Basically, this pattern has a big flaw; by the time there is the Neck, a half or even the most of the general trend can be over.
To reduce the time lag, you can cut the number of break lines. In addition to this, I suggest doing the experiment with the standard indicators, MACD and moving averages.
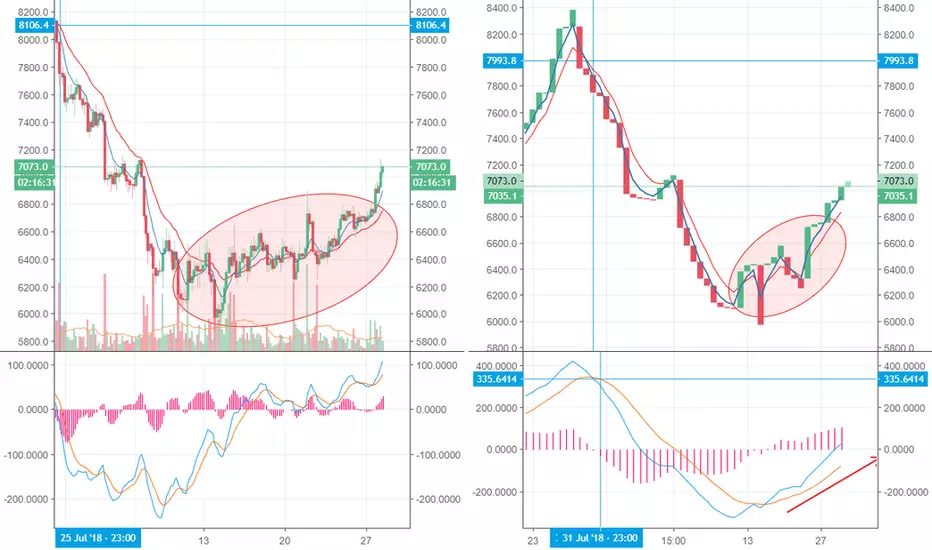
In the Bitcoin/Dollar four-hour char above, you see that the Line Break chart sends the signal a little later. However, if there is the price sideways move (marked with the red circle), the indicator sends many false signals and is not efficient. There, MACD is of help. In case with the Line Break chart, the indicator doesn’t suggest strong volatility and indicates the sentiment rather definitely; it doesn’t feature the same in the Japanese candlestick chart.
Summary:
The Line (Three-Line) Break Chart is obviously worth studying and can serve as a confirming indicator of the trend reversal. Like Renko chart, Line Break can remove the noise, resulted from minor volatility during short time periods; however, it is likely to send many false during a long sideways trend inside a wide price range. Moreover, I don’t think it is right to analyze the close levels to spot the breakout, as, according to technical analysis, the more important levels during the price breakouts are the highs or lows for previous periods.
To study the indicator in more detail, I’m going to test in practice, applied to different trading instruments. I will present the results of my tests, traditionally, the in the next educational post.
I wish you good luck and good profits!
PS. If you agree with the forecast write “+” in the comments, if you don’t agree, put “-”. If you liked the post, just write thank you, and don’t forget to share the post. It is easy for you and I will be very pleased :)
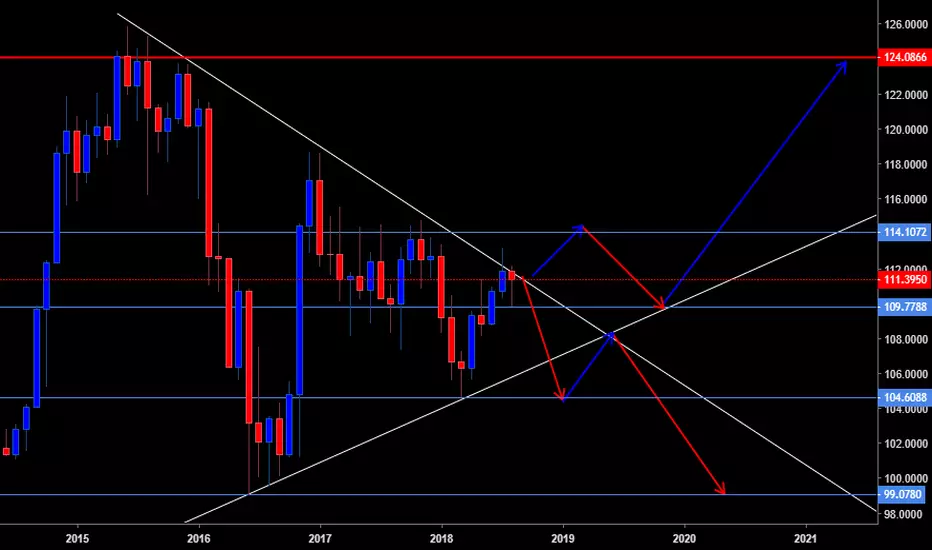
UJ Neutral Monthly Uj has shown alot of indecisive price action on the past month, this pair unlike other Yen pairs has shown more bullish arsenal than bearish.
I will wait to see which end price breaks towards in the MONTHS to come before engaging in this market again.
At the moment it is not worth the risk.
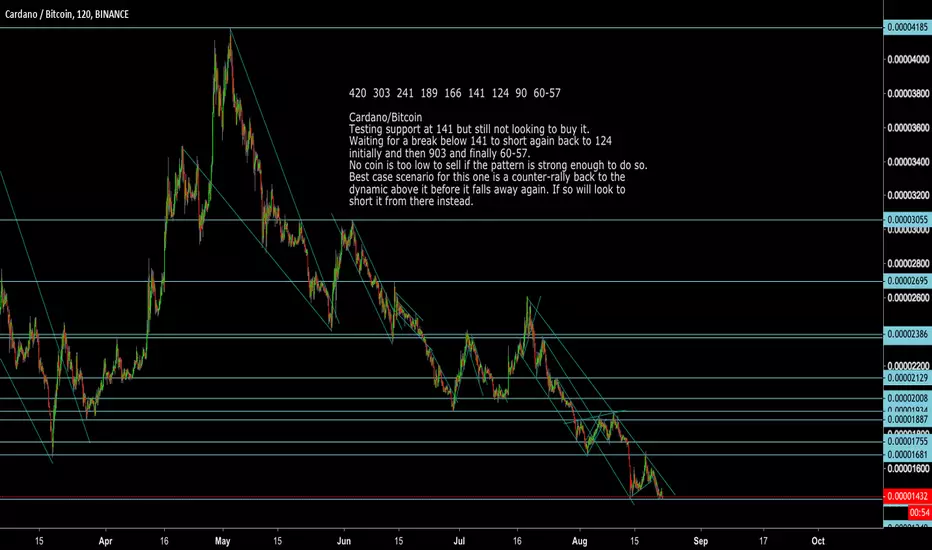
ADABTC Cardano/Bitcoin Get ready to short the break lower againADABTC Cardano/Bitcoin
Testing support at 141 but still not looking to buy it.
Waiting for a break below 141 to short again back to 124
initially and then 903 and finally 60-57.
No coin is too low to sell if the pattern is strong enough to do so.
Best case scenario for this one is a counter-rally back to the
dynamic above it before it falls away again. If so will look to
short it from there instead.
Hurry up? Don`t miss that chance?Hey tradomaniacs ;-)
Chart is wonderfull and could give us a nice signal.
Observe it carefully take a look at the horizontal support plus the trend-support-line. :-)
I expect some profit-safes at this point which could cause a price-drop till the 61,8% Retracement which is the markets favourite golden cut BUY-Signal ;-d
CHEERS AND GREAT TRADES
GBP/AUD Broken Head and Shoulders - EntryHead and shoulders pattern on the daily chart. Now currently pulling back. Awaiting break of trendline on H1 chart to enter. Possible 1000 pip plus move to be had over the next couple of months (hopefully).
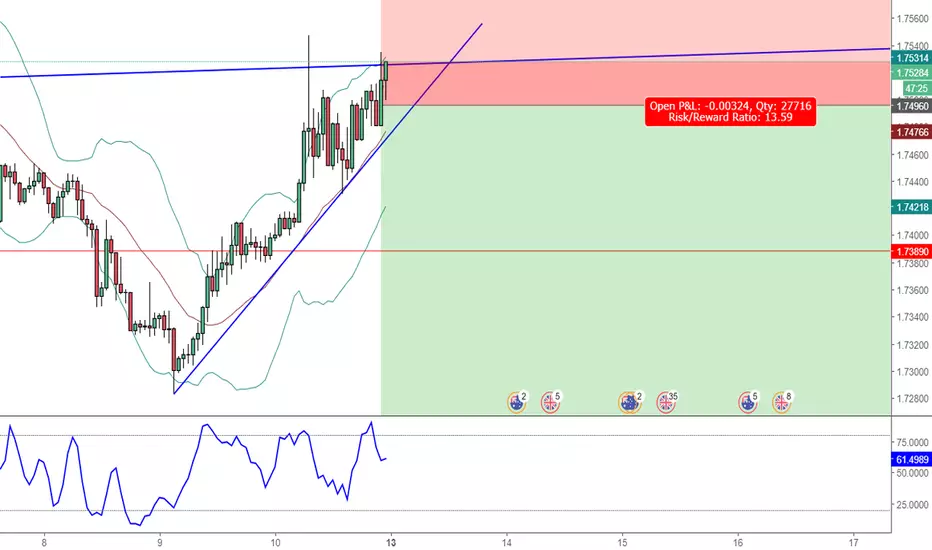

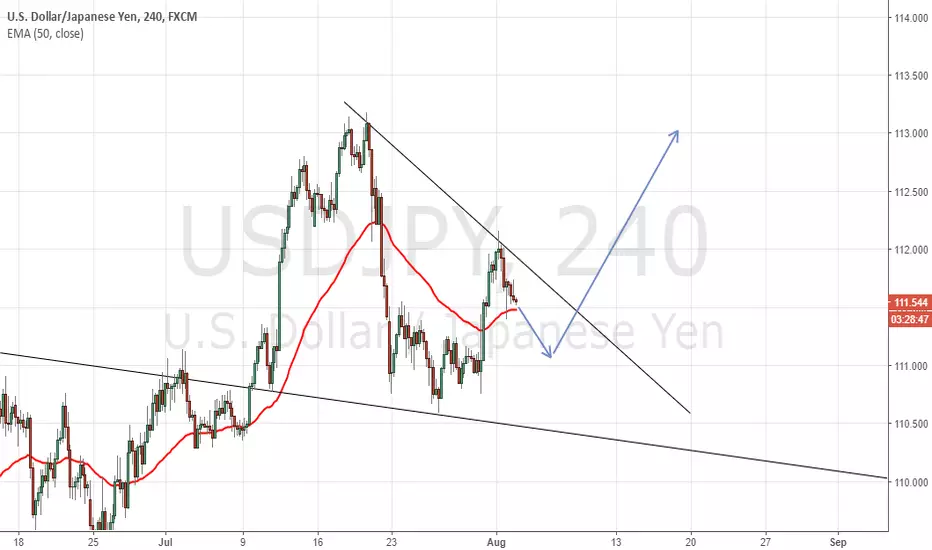
USDJPY Weekly Trendline Violated! Chance To Go LONG
The weekly long term trendline on this pair has been broken and a potential long opportunity is setting up.
I am currently waiting for the channel that is forming on the 4 hour chart to break and retest the 50 EMA on 4 hr chart. Stay tuned for any updates!
However i will only take this trade when i exit my other active USD position. I do not want to risk my capital buying 2 USD pair at the same time. Nevertheless its a good opportunity and if your analysis meets the criteria you can execute at your own risk!
mini 1hr h&s pattern triggers reaches target forms higher lowI wouldn't be worried about more downside unless we achieve a lower low...we will have to get below 7800 to do so. until then I will ladder in moderate dip buys. *not financial advice*

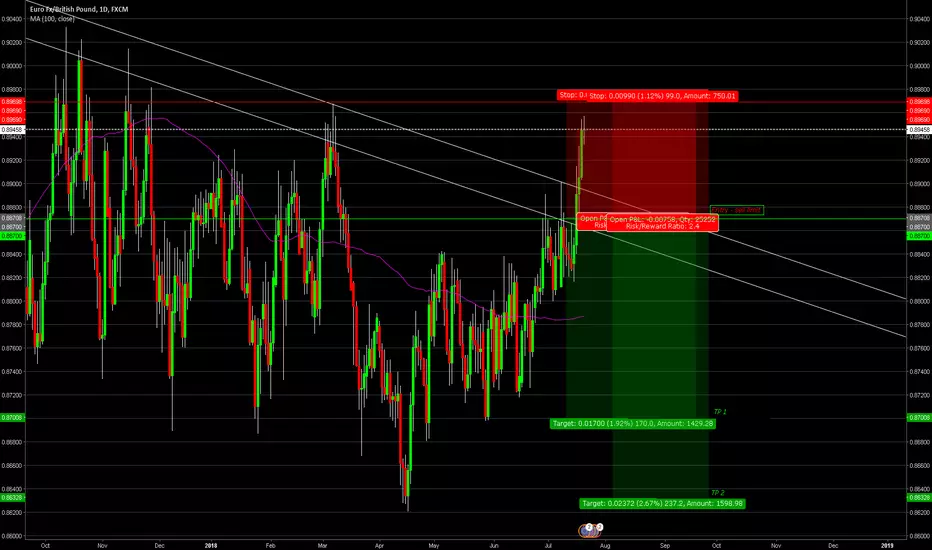
EUR/GBP UPDATEA break out occurred, hoping it is a false one and that it doesnt hit the sl
Good Trading!
BTCUSD Bullish Continuation Seeing the same thing we've seen twice already i think, i think we see 7600 at least most likely 7800, but we will see how strong the rally is.
Make or Break for Bitcoin in week of 16th July 2018 [BTFD]Looking at four hour chart on Bitcoin/USD we see over the weekend it good bounced from around the 0.618% fib level...
The new Cycle of Power Indicator is showing a change from bearish to bullish conditions and the RSI coming into the overbought levels - this is shown by the change of colour of the line to grey
We also have a Death Cross on a 55/100MA that has just formed
So very mixed signals for bitcoin starting this week, if the 0.618% fib level holds and some buying momentum takes us up over 6800 during the week, then we may see some gains and be good for longs, firstly 6400 need to be broken and established as a floor support and solid buying action as the week starts and then going up to 6600 and above....
IF the 0.618% fib level breaks (currently around 6180 area) then most likely we will be back in power with the Bears and price will come down to touch just below $6,000, even going as low as 5800 area, now if buy support is strong and this does play out we will examine the market after we see the moves that start the week
weekday markets open 10pm GMT +1, so get used to checking the price and movement once the institutions are back on the board and moving pieces around, expect a few squeezes along the way
i'm calling neutral for this chart but im kinda leaning towards the bearish scenario, the psyche levels of 6300 and 6200 are pretty important, so keep eyes peeled on these levels of support and watch for opposite from 6600 & 6800

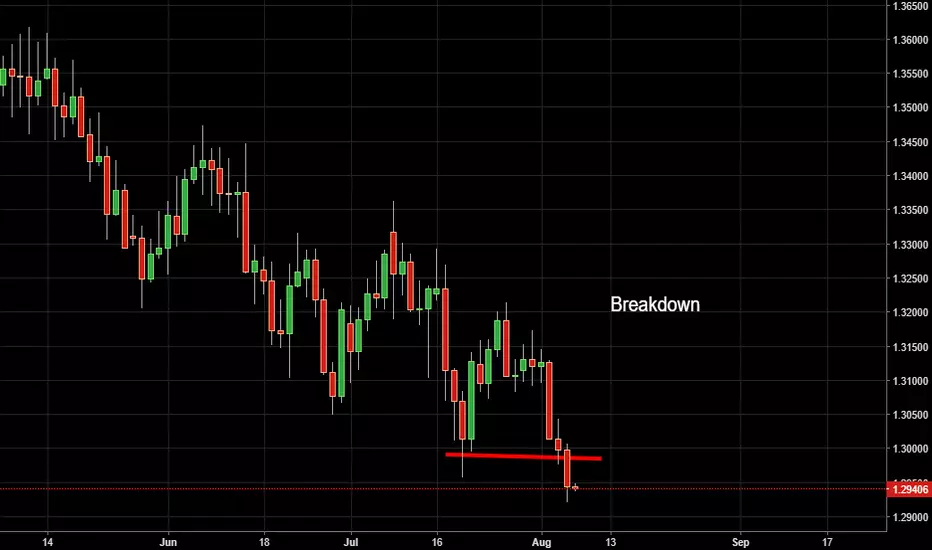
GBP/JPY Looking for a Sell NOWGBP/JPY finally broke the Daily trendline and is not retesting it. Will be looking for seller pressure and will join them.

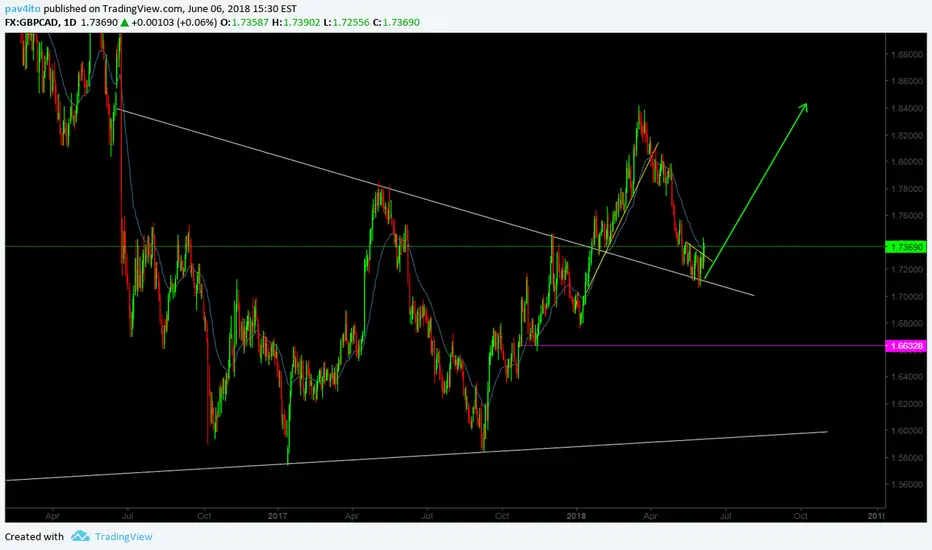
GBP/CAD Retesting the trendlineIve been following this for a while, we finally had a trendline retest. I believe this will be making a move to the upside. All of my trades are swing trades.
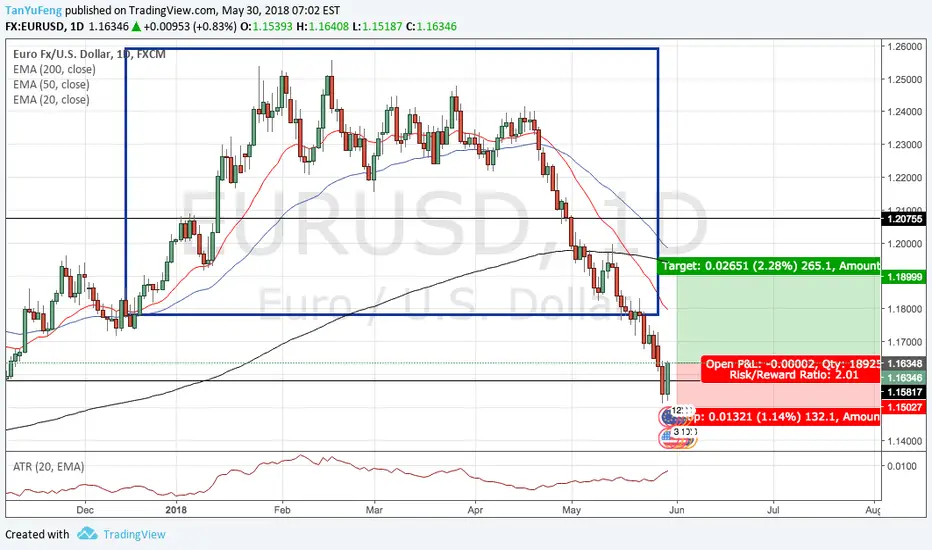
EURUSD [Daily, Long] False Break/Failure TestMarket has been in a range from the 1.163 level to 1.207 level. Price action towards support at 1.163 is clean. Price took out the previous candle structure low on 7 Nov 2017. There was strong price rejection following this. Sellers who short the break of the support are now trapped, many would sell off their position when price goes to breakeven, fuelling the buying pressure.
Entry: Market order of 1.16373
Stop: I placed a more aggressive stop loss just a few wicks below the candle structure, referenced on the 4hr timeframe as that is where my trade would be invalidated. Also to trade with a larger position to fulfil a 1:2 risk reward ratio.
TP: 1.19 as I foresee price rejection at this region due to resistance.