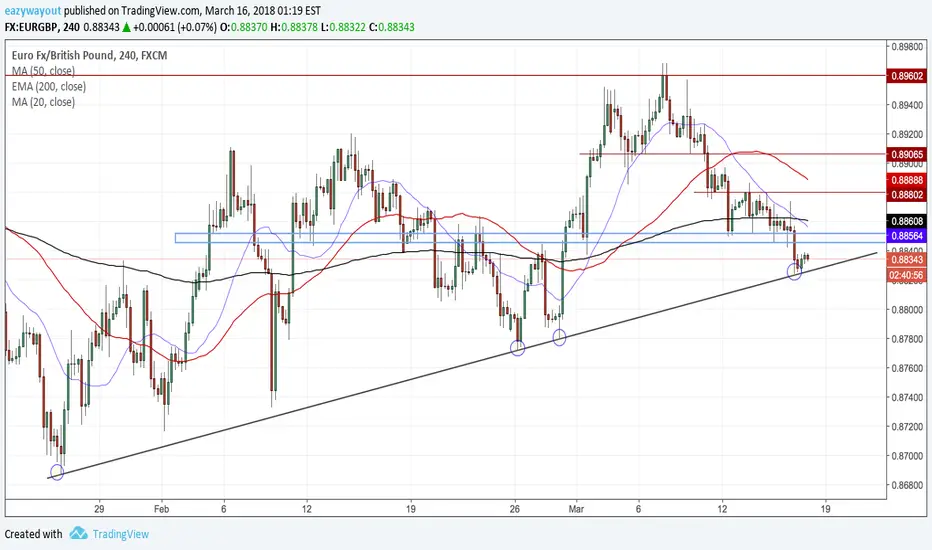
We leave the corridorOur pair has been trading for a long time in the corridor. For two weeks it had found levels of support and resistance on the levels of 1.2755 and 1.2890
However, yesterday the dollar went on the offensive and overcame the upper boundary of the channel.
At the moment, we assume that the pair will continue the upward movement to the next resistance level drawn on the chart. Therefore, we advise you to occupy long positions and consider the resistance levels as your goals.
Break

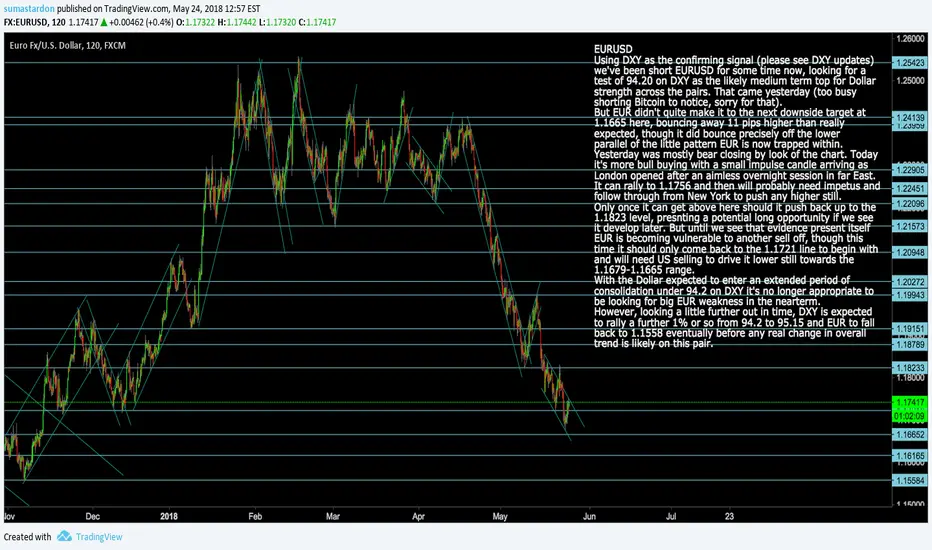
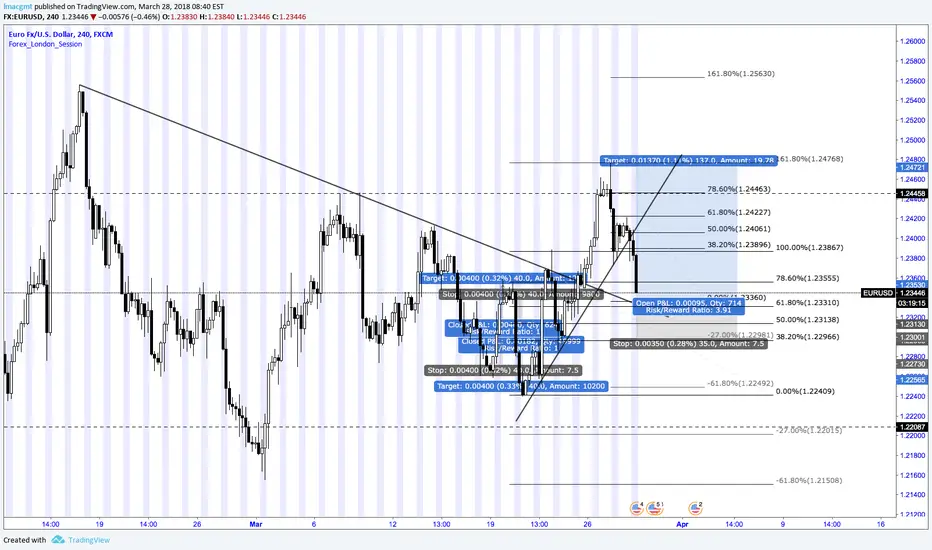
EURUSD Trying For Break-Out Counter-Rally HereEURUSD Trying For Break-Out Counter-Rally now
Using DXY as the confirming signal (please see DXY updates)
we've been short EURUSD for some time now, looking for a
test of 94.20 on DXY as the likely medium term top for Dollar
strength across the pairs. That came yesterday (too busy
shorting Bitcoin to notice, sorry for that).
But EUR didn't quite make it to the next downside target at
1.1665 here, bouncing away 11 pips higher than really
expected, though it did bounce precisely off the lower
parallel of the little pattern EUR is now trapped within.
Yesterday was mostly bear closing by look of the chart. Today
it's more bull buying with a small impulse candle arriving as
London opened after an aimless overnight session in far East.
It can rally to 1.1756 and then will probably need impetus and
follow through from New York to push any higher still.
Only once it can get above here should it push back up to the
1.1823 level, presnting a potential long opportunity if we see
it develop later. But until we see that evidence present itself
EUR is becoming vulnerable to another sell off, though this
time it should only come back to the 1.1721 line to begin with
and will need US selling to drive it lower still towards the
1.1679-1.1665 range.
With the Dollar expected to enter an extended period of
consolidation under 94.2 on DXY it's no longer appropriate to
be looking for big EUR weakness in the nearterm.
However, looking a little further out in time, DXY is expected
to rally a further 1% or so from 94.2 to 95.15 and EUR to fall
back to 1.1558 eventually before any real change in overall
trend is likely on this pair.
This update was posted shortly after the DXY companion forecast this morning. It never loaded correctly. Very annoying. Anyway, what was expected above is happening pretty much as it should so far - EUR is about to break higher as DXY unravels under the dynamic from the highs a while longer.
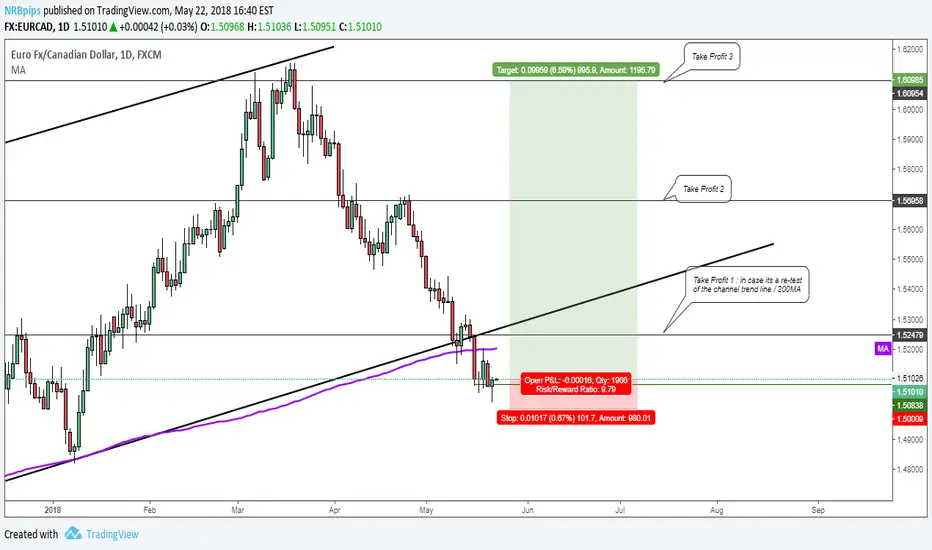
Long on EURCAD Double bottom false break out of the channel?EURCAD broke out of the uptrend channel & formed a double bottom with a stop hunt on the 1hr time frame. this could mean a pullback to re-test the channel or resistance area 1.52479 at which TP 1 profit will be booked in. if it breaks back into the channel, we looking at 12: 1 trade where TP 2 at 1.5695 and TP3 at 1.6098 could be reached.
DJIA: Dow Jones: Breakout to Upside Likely Soon DJIA Dow Jones Industrial Average Futures
The Dow has had a torrid time for 3 months now, falling 14%
from the highs and bouncing three times directly off the
longer term parallel underpinning the rally - and which had
acted as major resistance right up to the point when the new
President/Paradigm took office.
Over those 3 months of wild gyration and whipsaw the Dow
has formed a neat triangle and is now now re-testing the the
falling dynamic which forms the last big resistance line to the
upside.
It's had 3 attempts so far to break this line and now we're
looking at a 4th.
It can do this up to 4 times but on the 5th at latest should
break higher.
Can either follow the break when it arrives and hope the rest
of the world follows it too, in which case volumes will rise and
it will begin to power upwards (stops under the line) or wait
for a potential retest of the dynamic once broken to the
upside - which not come, depending on volumes at that point.
Once broken the first resistance line lies at 24793-24800 and
it may come back from there towards the dynamic one last
time before surging higher again - this will most likely be the
last chance to get long at lower levels if we see it a little
further out in time.
Otherwise, if the Dow does come off from the dynamic for a
4th and likely last time, look to buy around 23869 levels if the
chance presents itself.
The Global Dow chart (next update) should help to provide
confirmation of the break when it comes.

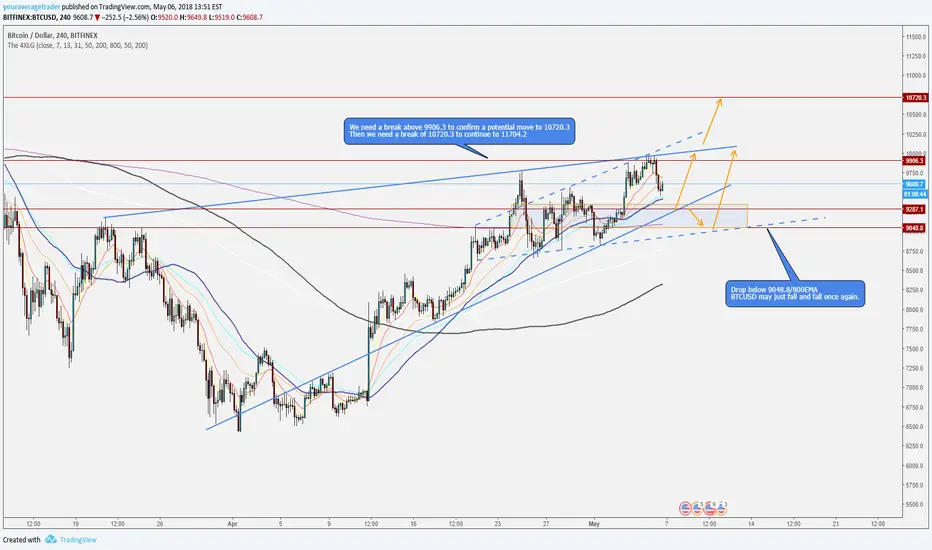
BTCUSD - Will IT regain it's former Crown? (Potential BUY)All information on the chart.
Patterns included:
1) Ascending Triangle: If BTCUSD breaks above, confirmed bull run.
2) Broadening Formation (Bullhorn pattern)
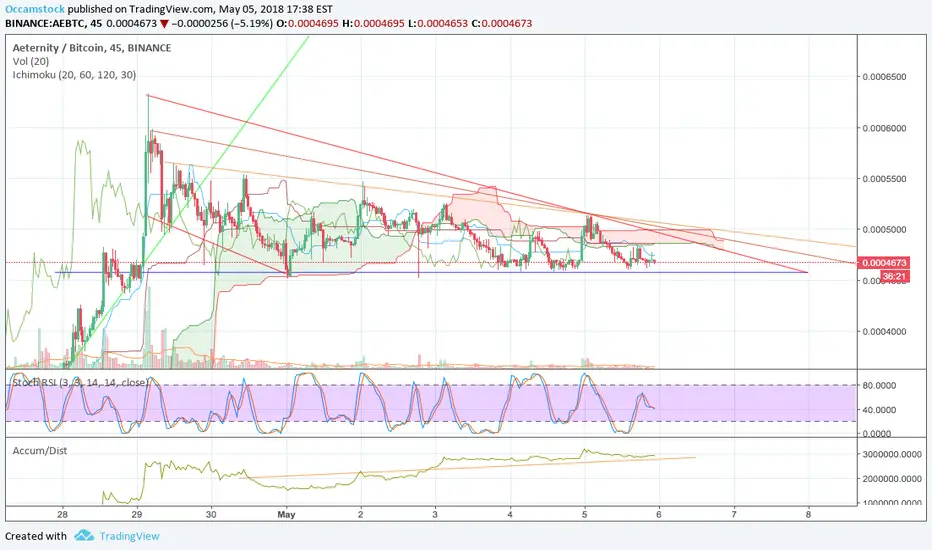
$AE Aeternity Update; Priming after ConsolidationLooks like we have a potential inflection point ahead as it tests the cloud. Has shown tons of strength holding at 47000-4800, could be a nice time for entry.

The pair has crossed the resistance lineOur pair has gone beyond the descending channel and is currently demonstrating growth. Against the backdrop of investors' expectations that the interest rate will be raised at the next Fed meeting, investors are returning their interest in the dollar.
Given that our price has received a new upward support line we can expect further growth in the pair. In case the pair falls below this level we anticipate the possibility that the boundary of the descending channel has shifted by the channel value from the resistance level.
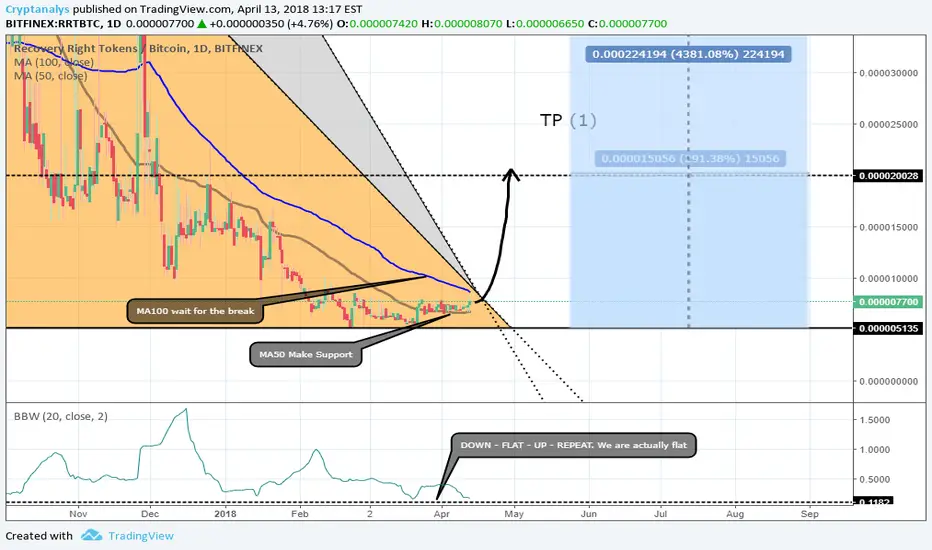
[RRT/BTC] Potential +300 Soon !!!Hi,
I watch RRT/BTC since January, now the pattern is close to the end of his road. I'm already in but it's not too late if you want to get some RRT (Bitfinex token - Recovery Right Tokens).
We need big volume for break the triangle pattern and MA100 but all it's possible many trader just wait for confirmation before buy..
Have a good day, GLHF.
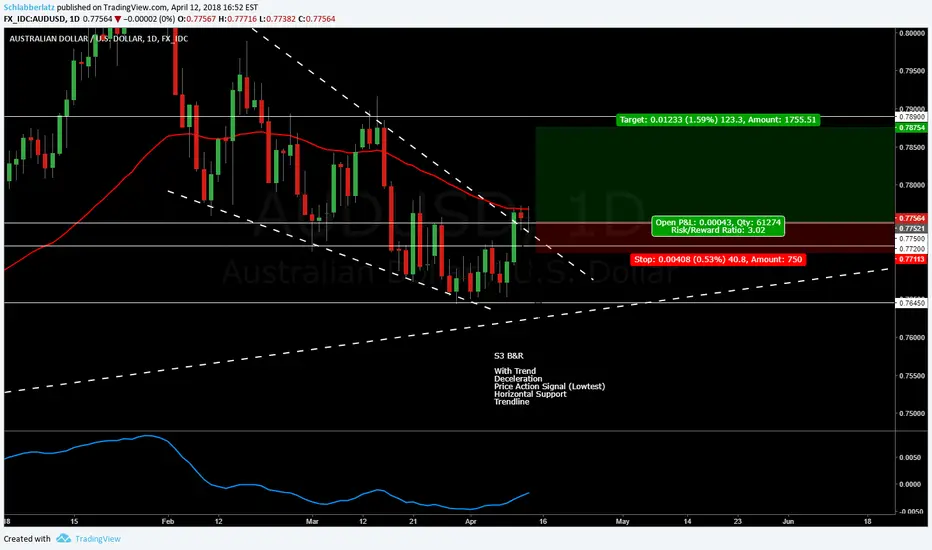
Busy week continues, Retest of Rising Wedge, Long AUDUSDHi guys,
The busy week continues, I just put in a buy order on AUDUSD as shown on the chart. Price has broken out of a horizontal resistance/support zone aswell as a trendline which is part of a rising wedge, it has now rejected the top of the zone twice in the same day and decelerated.
I don't like the 50 EMA being in the way and getting rejected. I am also not satisfied with the lack of a deeper pullback. Significant MACD Divergence would've been great also. However this trade still has 5 confluence factors. Because I know my strike rate on those setups I know that I posses an edge over a great amount of trades. That is why it's crucial that I trade my plan regardless how I'm feeling about the trade.
Happy trading
USDCHF Long, Break & Retest PatternHi guys,
coming from a slow week last week we are now getting another setup. USDCHF is retesting the recent horizontal support zone with a lowtest, while also rejecting the major 0.5 Fibonacci retracement level. A 50 EMA retest would've been awesome, but this price action is enough for me to justify an entry. With 5 confluence factors this trade is a B in my category, and thus its fitting my trading plan.
The stop will be set below recent price action, the target is set at the recent highs and the next horizontal resistance level.
Happy trading

ENJ pivot point; watching closely for directional trendI know I've got that chart tatted-up like an inmate, but these trend lines give us a good indication of what kind of support/resistance we're looking at moving forward. The mid-term support line I calculated seems to be holding up despite a good amount of sell pressure, and this incoming squeeze will test it further. With some momentum or a news catalyst I could really see this taking off any day now -- chart looks great from multiple frames.

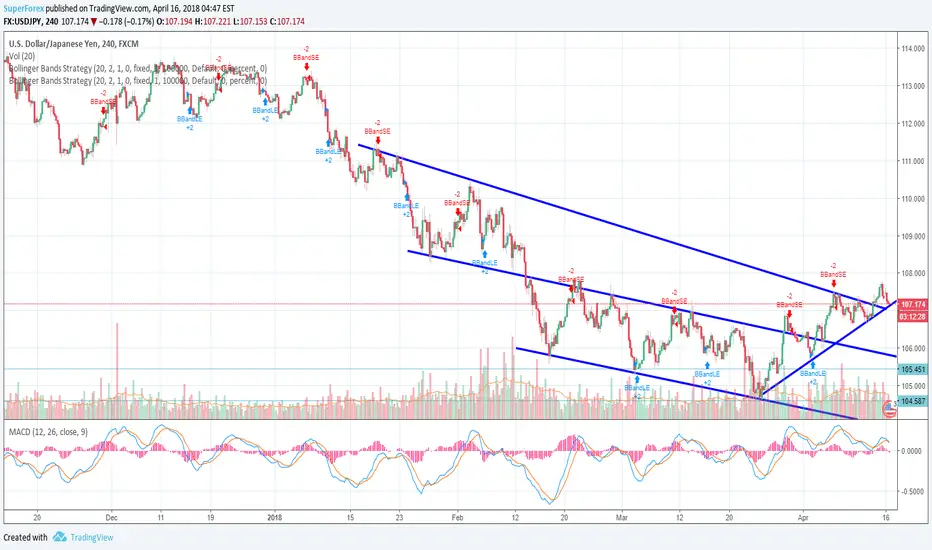
A possible long opportunity on USD/JPY Hi guys,
I want to share my vision of USDJPY.
I was looking at this pair for the last days and waiting for a nice trade opportunity, finally i found a great pattern that could make a lot of pips.
As you can see, we have a inverted Shoulder Head Shoulder pattern with a breakout of the channel, when a breakout happens, mostly i wait for a retest of previous resistance now support.
The only thing that i don't like at all is the NFP result which was horrible for the USD, this can lead to invalidate our inverted shoulder head shoulder pattern and bring the price back to 105.000 levels
Personally im going to wait for a candle pattern that gives me confirmation to enter.
Trade Safe!
Greetings,
D. Sayan


NCASH near squeeze point, oversold, accumulation/MACD shiftingIndicators and buying behavior tells me this one should be heading north once it breaks its wedge pattern. I'm expecting a healthy jump with the amplitude determined by the influx of volume. Should be a solid gain once (if) it gains enough momentum. Buy until 410, stop loss at 370

Bitcoin: BTCUSD Bad Friday turns Good on break above 7316 Bitcoin Good Friday?
Some spectacular price action overnight with a massive
counter rally from lows at 6630.
No obvious reason for this rally either. No imaginary Fibo, no
trend-line, nothing.
It looks untrustworthy and has rallied to the spot where it
should stop and fall away again at 7316.
If still short can stay that way with stops above 7316 for now.
The only way this can flip back to positive from here is by
breaking above 7316 and holding (if we see this happen later
on at any point we have to flip back to long once 7551 is
broken to upside using stops at least 50 points lower).
Until that happens this is a counter-rally in the downtrend and
we can stay short looking for 6000-5879 range on Coinbase
feed. Lower stop on short to 7110 to trap in profit now.
Be ready on upside in case a FUD free weekend starts a bigger
rally from 7316.

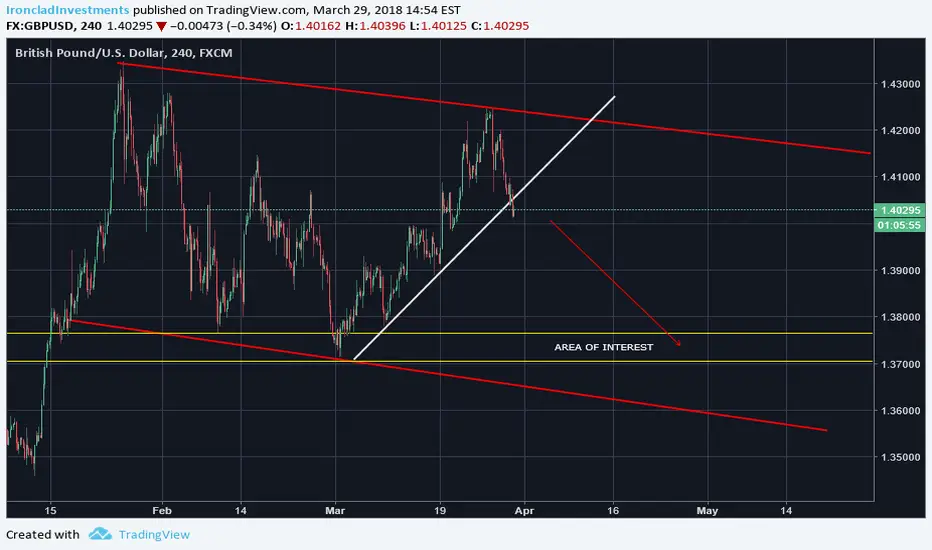
SHORT GBPUSD BREAKOUT CHANNELPrice has broken from upward trend line so we could be in for some downside movement in the descending channel. Wait for confirmation and more bearish price action before entry, we have highlighted our area of interest.
EURUSD Break retestEUR USD long, break and retest from 4 Hour trend line.
Technical analysis, any news going to ruin this?

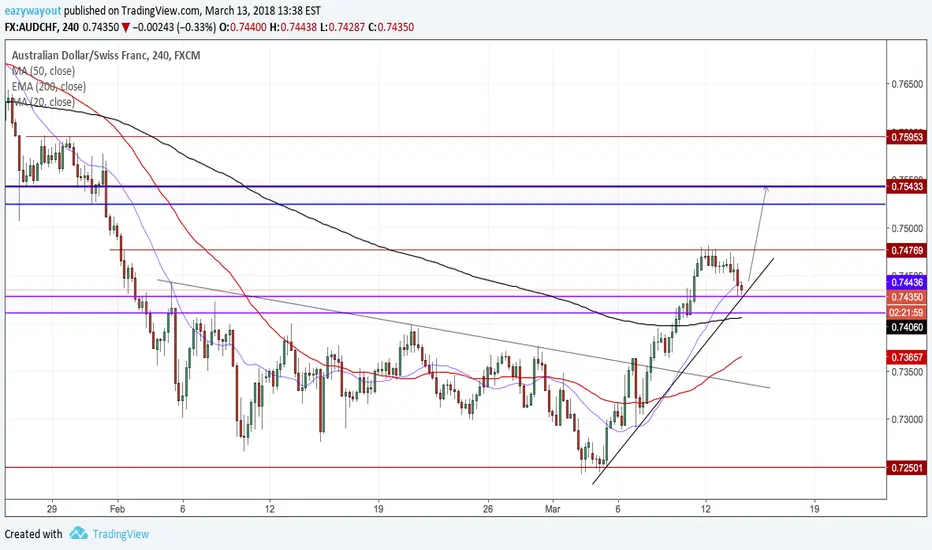
AUDCHF 4HAfter a bounce off a daily demand zone 0.72500 area, price has gone bullish & has been making higher highs & lows. Price now came back to retest broken resistance as new support, where we could see a new higher high coming shortly..