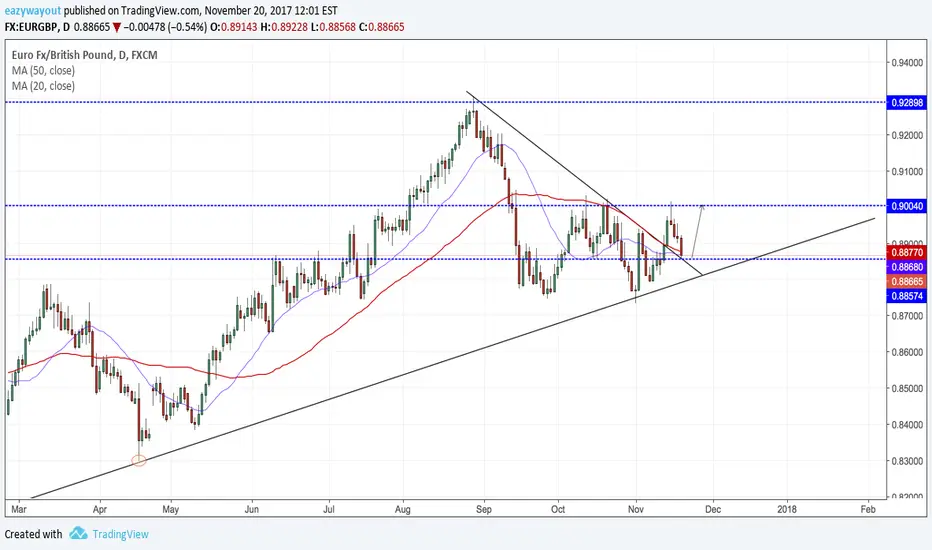
EURGBP DAILYPotential trade of the week here as price is sitting above its broken counter downtrend line / daily support. Waiting for a daily close for more confirmation.. Lets see how it plays out! :)
Break
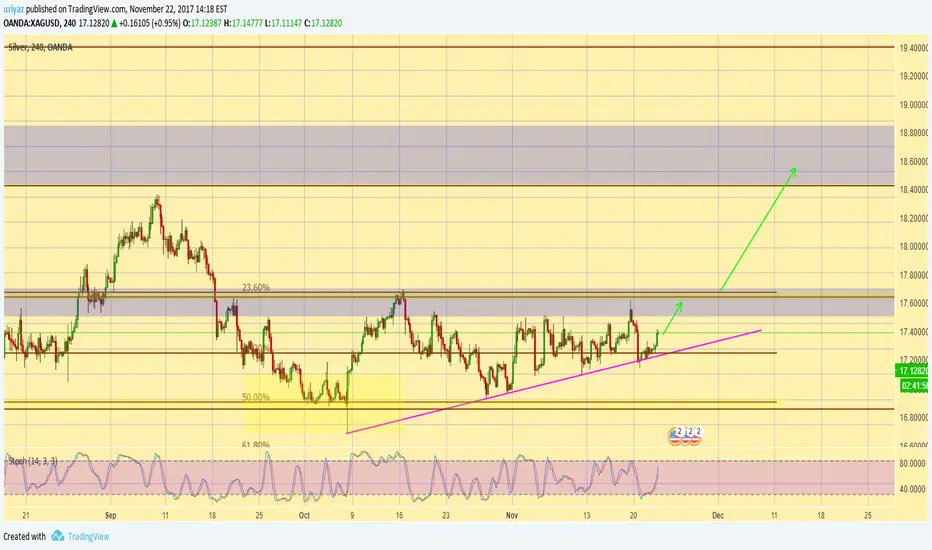
XAGUSD : low risk buy , high rewardLooking on the daily chart and 4h chart , it looks like price will rise to the next resistance zone but I'm aiming to the second resistance zone which is 19.0 zone - marked on the chart...
Best of luck :-)
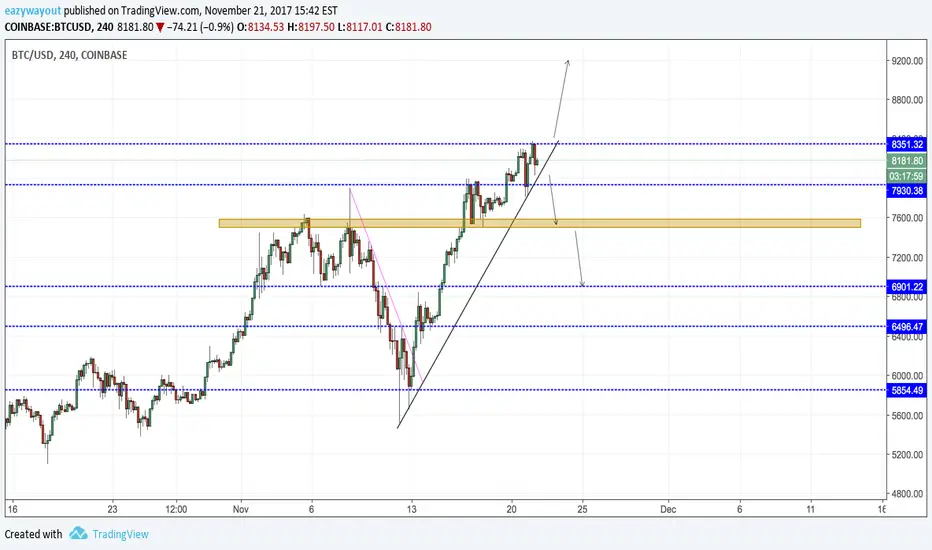
BTCUSDWatch for a break of resistance & close above for longs or break of the 4 hour uptrend line & support for shorts.. A correction is likely soon however price could reach 10k before doing so
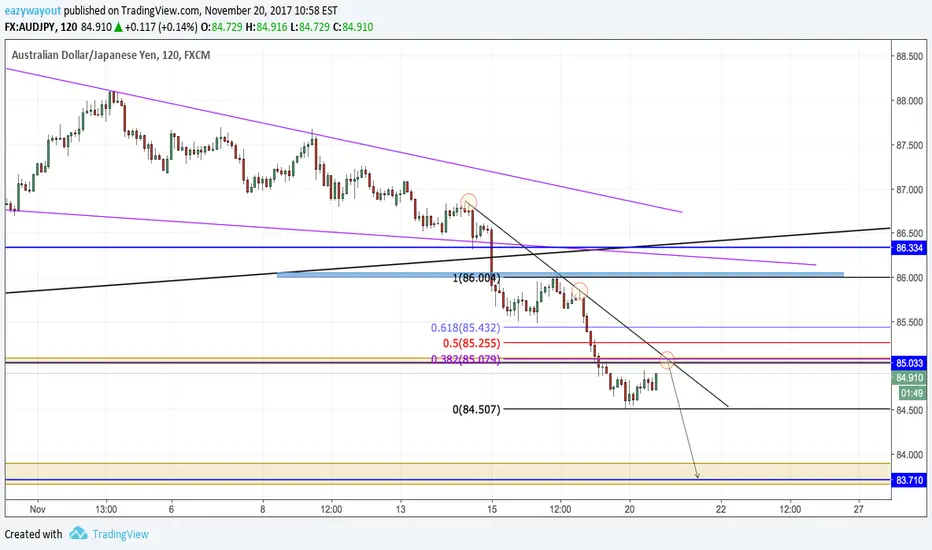
AUDJPY 2HShort at counter trend line / support turning resistance.. Another push down to weekly support is likely
Example of a Support and Resistance lines.I want to show with this example how the price in a lateral movement oscillate in ranges between supports and resistances lines.
The target is the following, if the price bounces on a resistance, make a short until it reaches the support level.
If it bounces on a support, make a long until it reaches the resistance.
If the price breaks a resistance, make a long until the next resistance level.
If it breaks a support, make a short until the next support level.
Sometimes a price level can behave as support and as resistance, this indicates that it is a strong level.

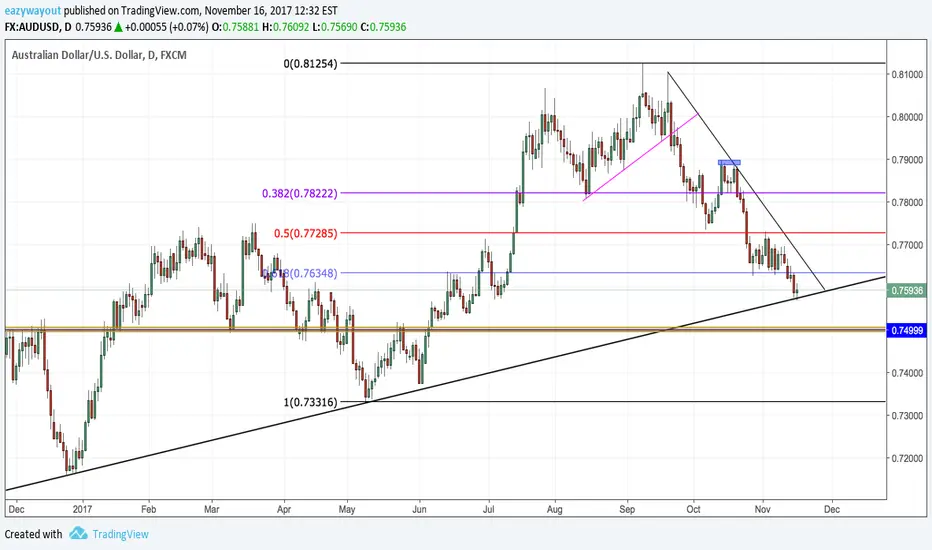
AUDUSD DAILYAt a decision area.. Will we get a break or bounce off weekly uptrend line? I am leaning more towards a bounce but waiting for confirmation is all I can do at this point.. Definitely on my radar
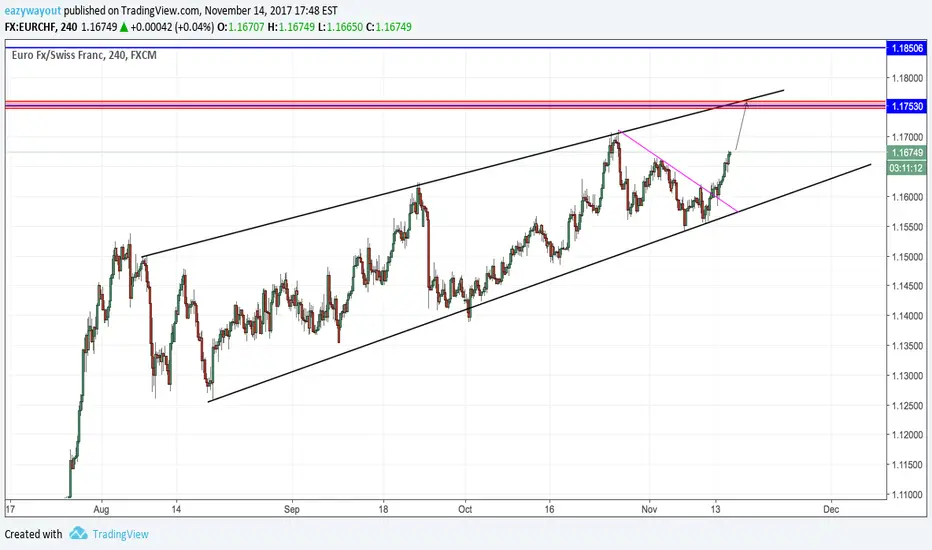
EURCHF 4HPrice is in an ascending channel, next target at daily resistance / channel top. Will watch price action at that point for either a break or bounce.
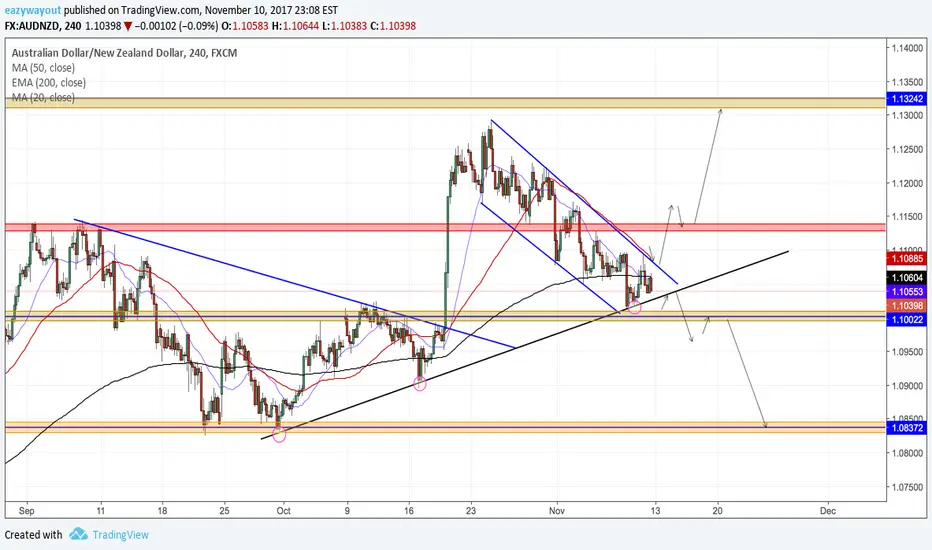
AUDNZD 4HAt trendline support, looks like a bullish flag is forming & another move to the upside is likely.. But a breakout in either direction is what ill be looking for.
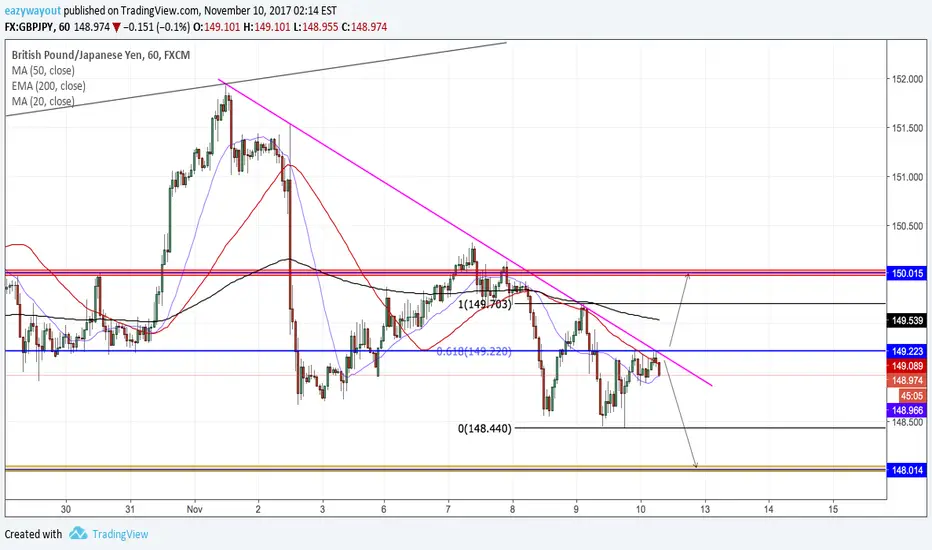
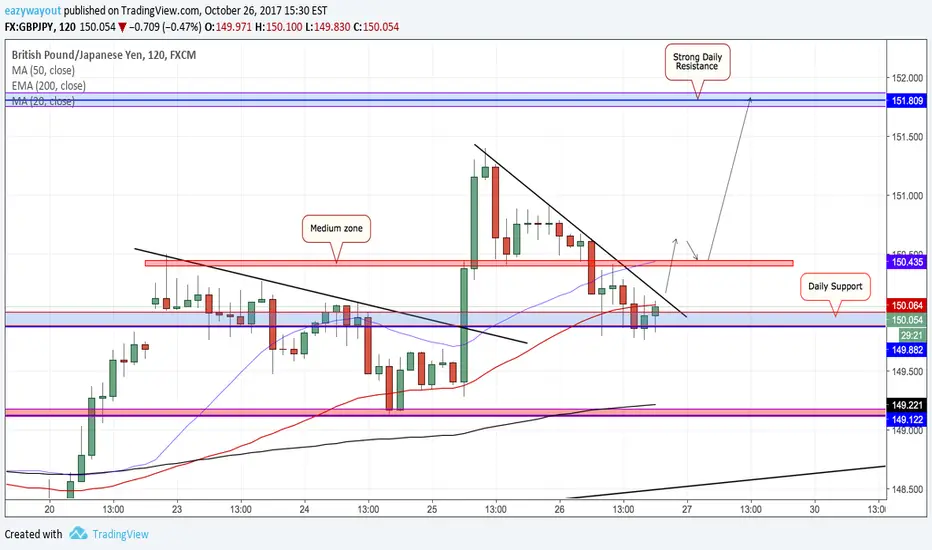
GBPJPY 60Bounce off CTL & 61.8 fib level again, will only look to long once a break of the counter trend line. Other wise my bias remains bearish.. GBP news in a couple hours something to watch closely
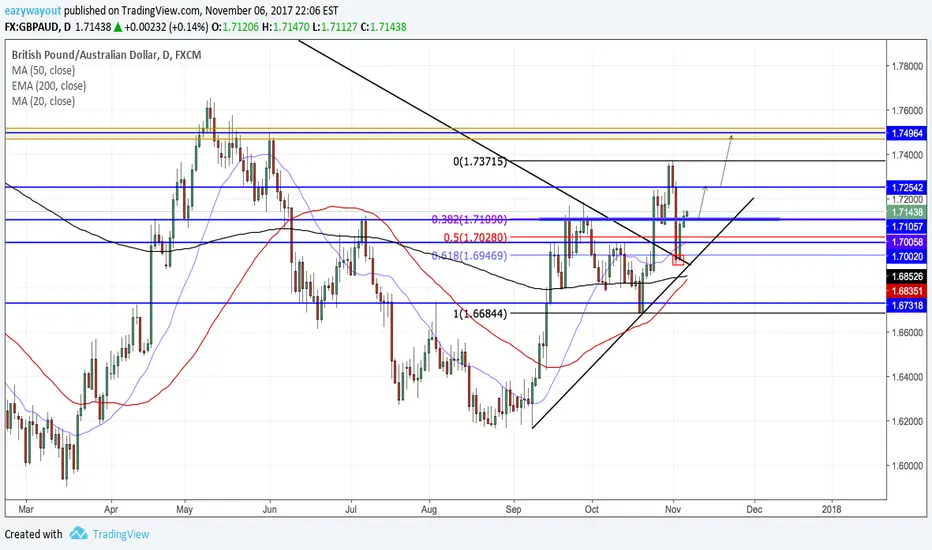
GBPAUD DAILYLast week, BOE gave us a perfect retest of broken weekly trend line, & bounced off the 61.8 level. Price closed above resistance I will go to the lower time frames to look for an entry. AUD RBA Rate statement shortly I am anticipating a weaker Aussie lets see how that helps this setup go into play..
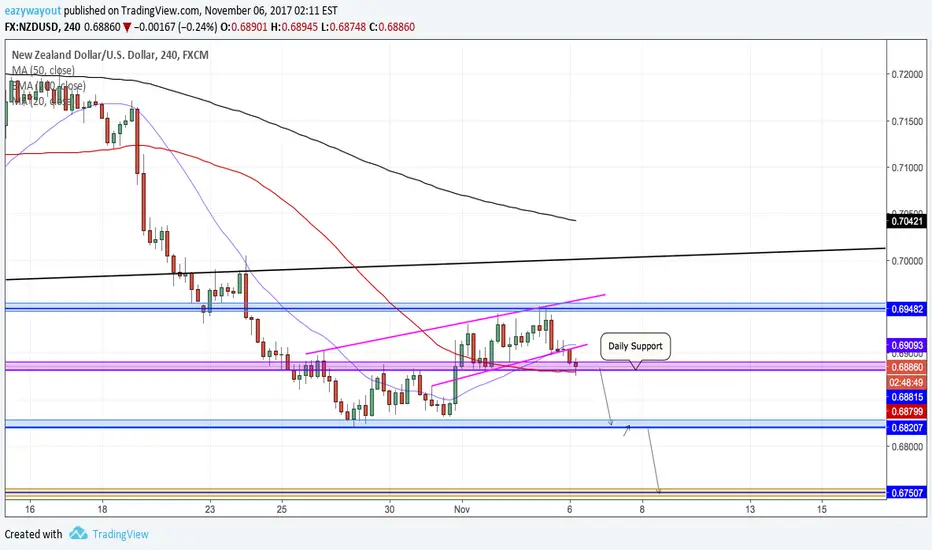
NZDUSD 4HPrice currently sitting above daily support & above the 50 moving average, waiting for a break below support & bearish engulfing candle to go short for another leg lower...

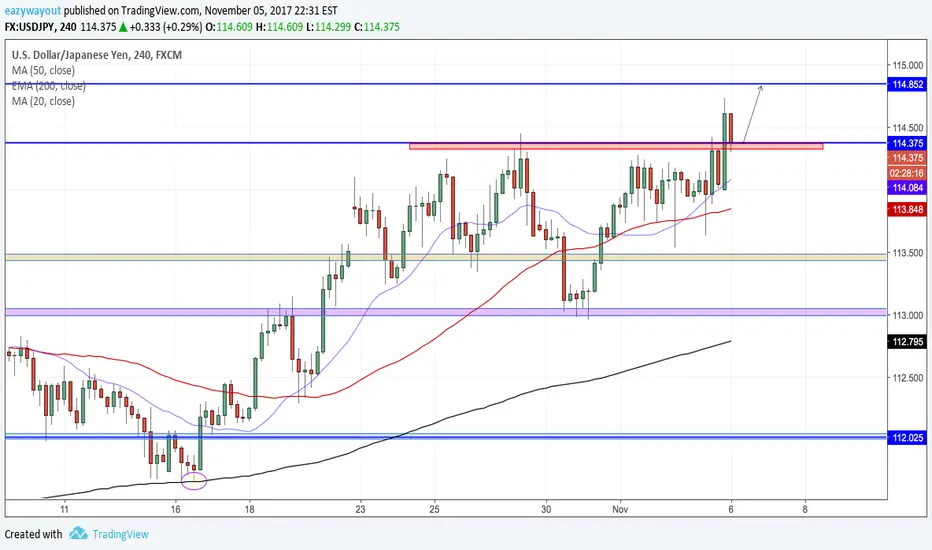
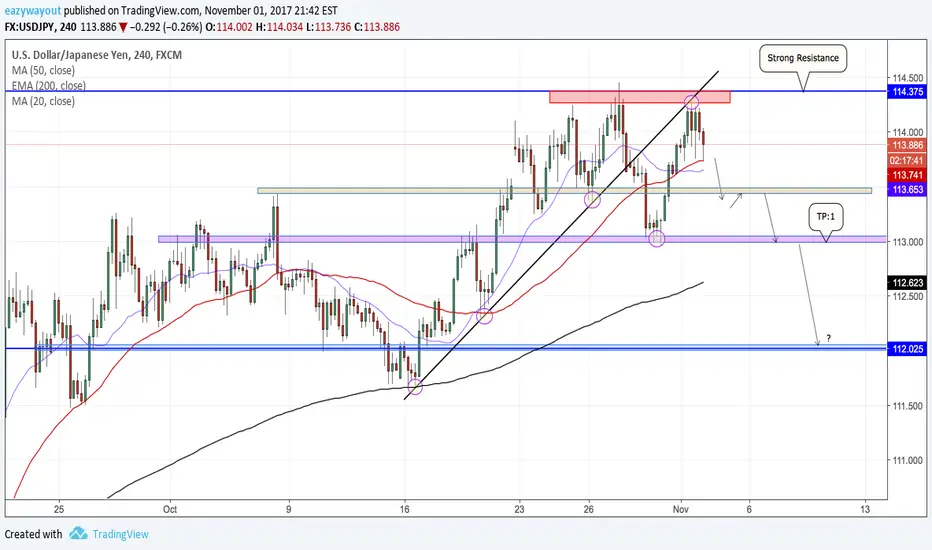
USDJPY 4HPrice broke resistance, now turning to support. Lets see how the 4 hour candle closes & another push about 50 pips higher to next area of resistance is likely
Break OR bounce?!After price rejected its daily uptrend line & 50 fibonacci level, my projection is a rebound back to the upside. But a break & retest of that trend line could give us a break to the downside. Lets see
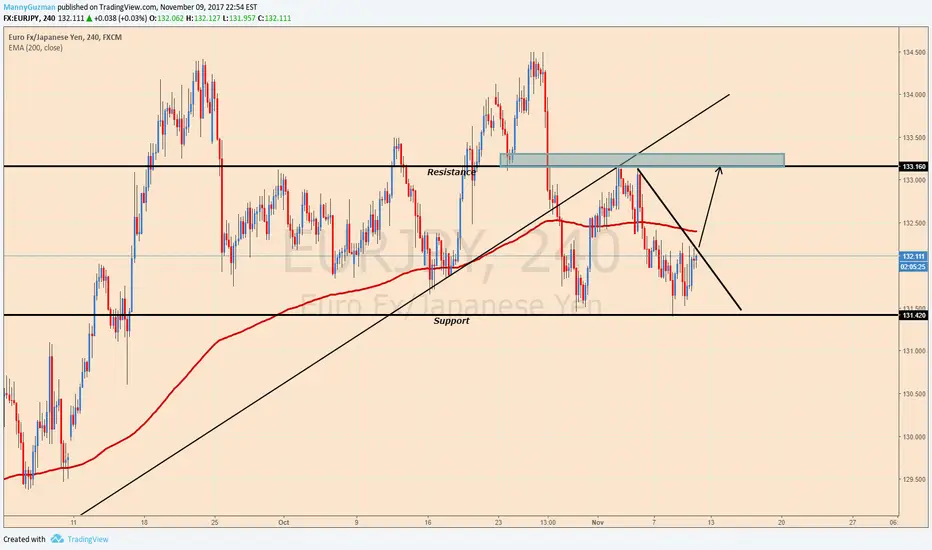
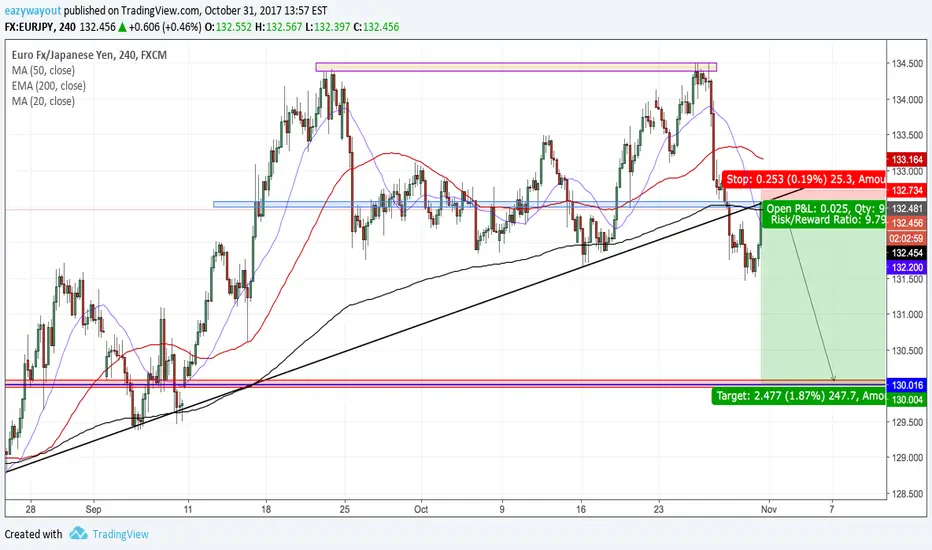
EURJPY 4HBeen patient with this pair now I feel like it would be the safest time to sell, price came back to retest broken trend line making a lower high. Tight stop loss due to yen being weak at the moment a break & retest is not a lot of confirmation to me..
Trade with care!
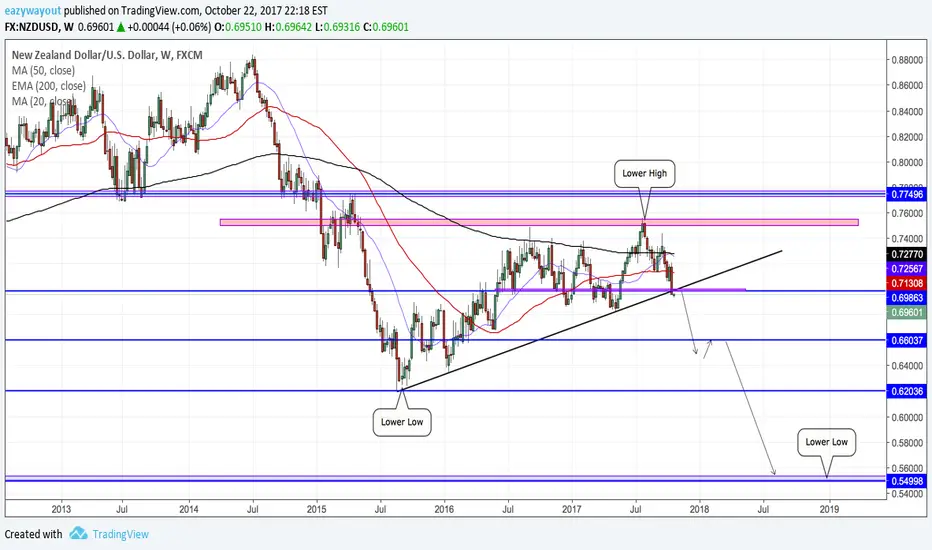
NZDUSD WEEKLYMassive move possibility overtime, as you can see in the weekly trend price is making lower lows & lower highs. Price finished making its lower high now breaking its weekly trend line I'm expecting a retest to go short for a possibility of 1000+ pips in the next 3-6 months potentially. :)