EURNZD Possible Trendline Bounce/BreakIn my opinion, the price either bounces off the trendline and continues to go lower, or it breaks the trendline (closed candle above on H4/D1/W1) and continues up to my line "H4 Resistance" which is about .56560. But that is a very long-term and I might come back to update the progress. What I personally believe more is a trendline break out and reaching the H4 Resistance line. Share your ideas with me! If you have anything vaulable to say towards my trading, please do! I want to become better since I am a beginner. Thanks!
Break

AAPL @ Make IT or Break IT AAPL Longs currently stopped at "Make it or Break it" Area
Today NO Shorts as well...
Looking for entry from break, strong bounce or from next EARNINGS
Merry Christmas and a Happy New Year :)

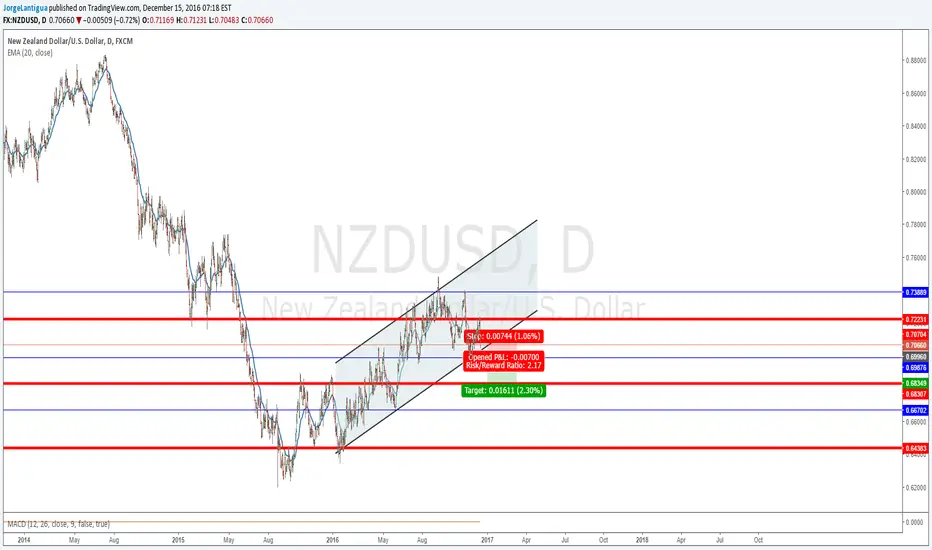
NZDUSD 1D Channel Break ?NZDUSD has been very choppy the last year and a half but it has slowly ascended within a wide channel formation. The pair had a very strong bearish move after yesterdays interest rate hike but it is yet to approach the bottom support of the ascending channel. I am looking for a brake of the channel and if it's broken I would go short @ 0.69876. My first target would be the daily support somewhere around 0.68000 if the is broken then I expect further down movement
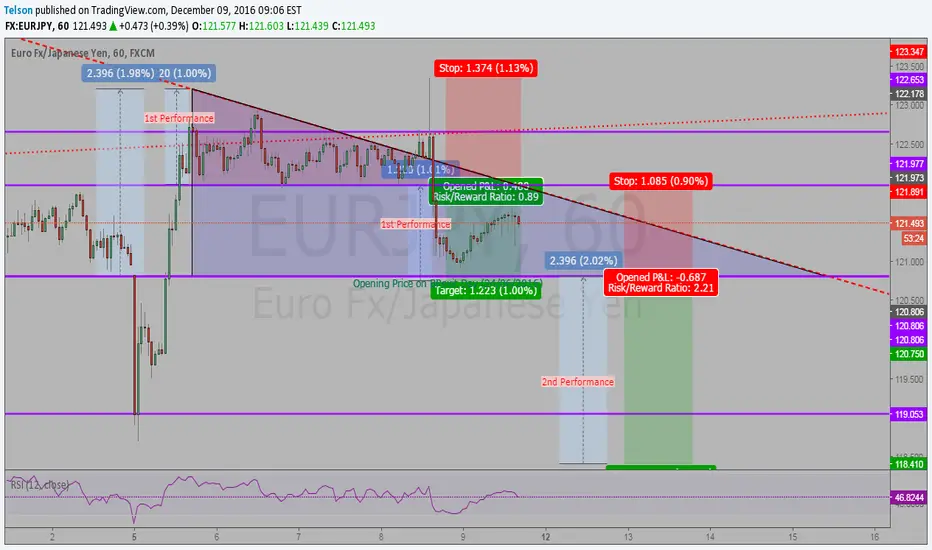
EURJPY Break-out Performanced (Part II - Continuation)Breaking down the long-term short of EURJPY as described in the " EURJPY going short " idea (see below) as well as the initial break-out performance, we have come to witness a possible continuation in a similar fashion.
Note that the long-term trendline forming the top wedge (based at 121.977) is still strong for a new-forming, even-bigger wedge, with the 120.806 price tag being the new base, which is the opening price on BRExit offering first "serious" structure support.
The above is also supported by market conditions on Daily charts that show real lack of buying power (seriously overbought) by means of RSI/Stochastic.
Conveniently enough :D the above speculation will conclude 1st performance target as described on the " EURJPY Break-out Performance " idea (see below) that was nearly missed at first go. There will be some resistance from EUR, we are in for a bumpy SHORT ride (scalping opportunities?) but, for the time being, I cannot foresee anything that may reverse back to LONG (trend not just a retrace).
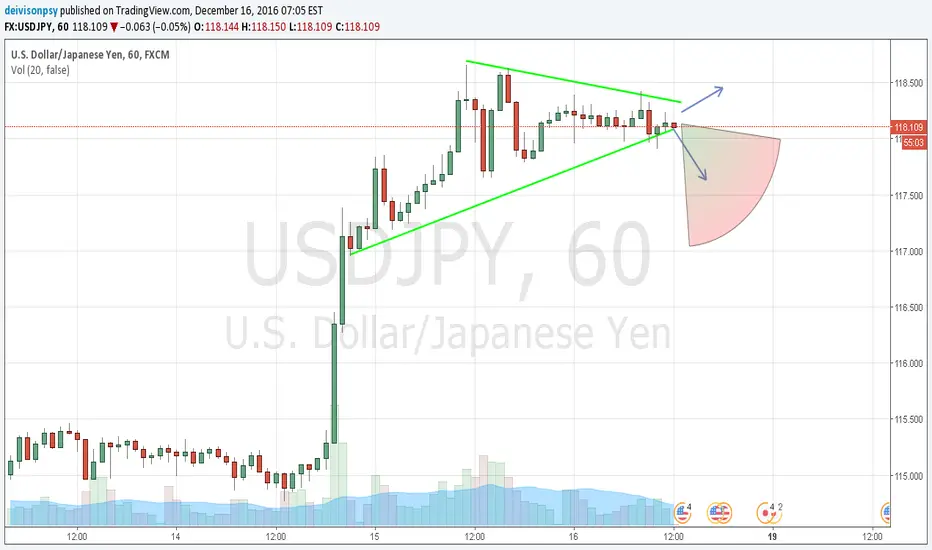
I would expect a solid retrace (min. 118.000) of that straight bull trend of the past few weeks, over the next few weeks before it shoots back to the stars.
Lets wait it out...
Since sometimes we all live in our small fantasy bubbles so, all feedback is appreciated.

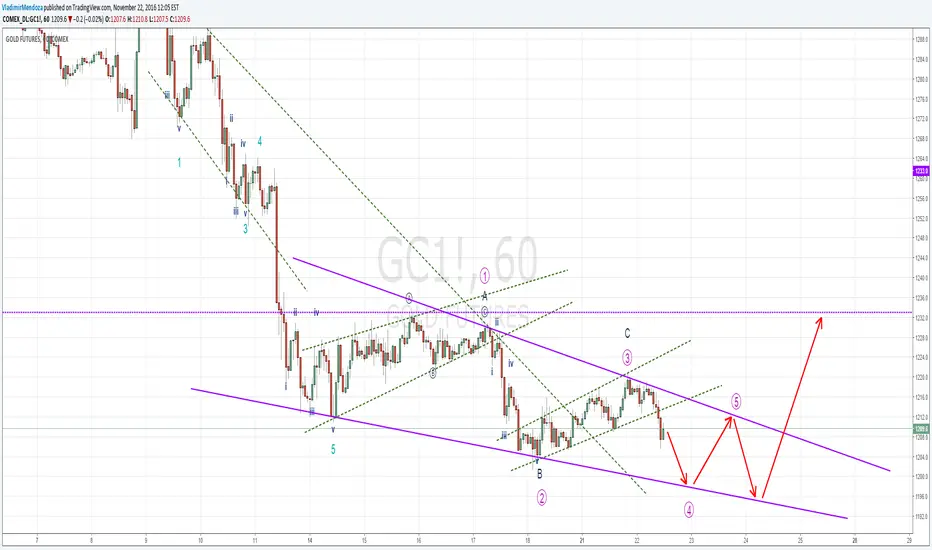
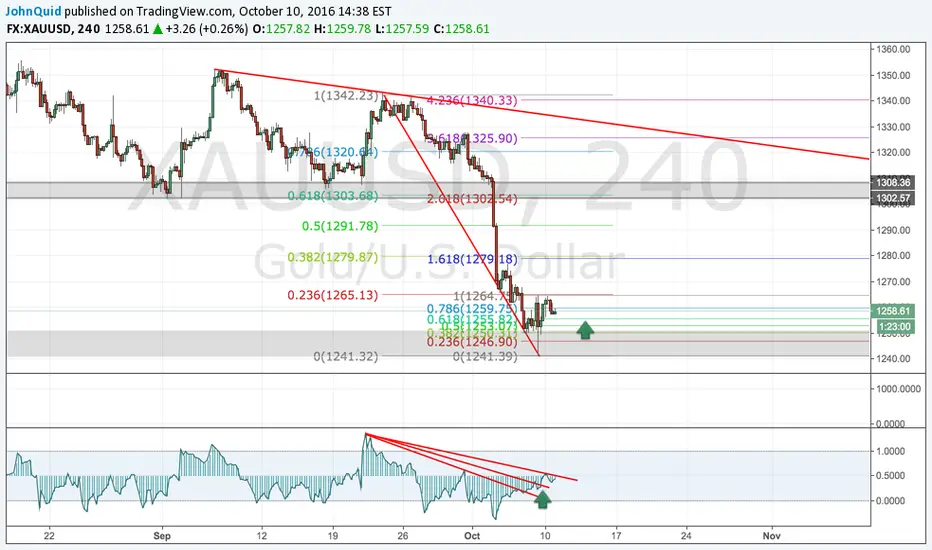
GOLD - FALLING WEDGE PATTERN / ReversalThursday 24 and Friday 25 are KEY DAYS for REVERSAL BREAK UP.
You can OPERATE previous UP and DOWN... and after take advantage with the BREAK of pattern.
The Falling Wedge is a bullish pattern that begins wide at the top and contracts as prices move lower. This price action forms a cone that slopes down as the reaction highs and reaction lows converge. In contrast to symmetrical triangles, which have no definitive slope and no bias, falling wedges definitely slope down and have a bullish bias. However, this bullish bias cannot be realized until a resistance breakout.
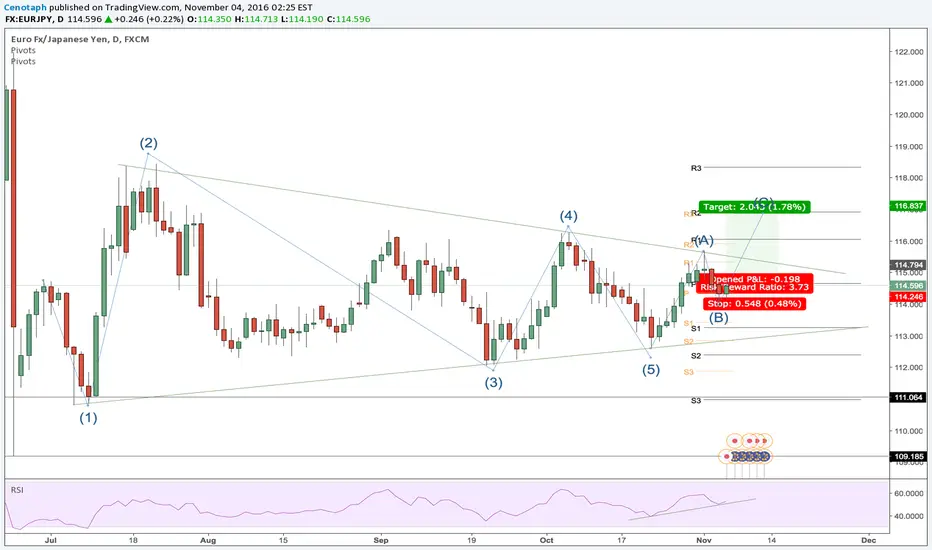
EURJPY Buy, AB=CD break of channelSupport at Pivot holds, likely the up move from (5) means we'll get a break of the channel. AB=CD suggest a TP around R2 price level. Be aware of resistance levels in between, nothing is 100%
Good weekend!
NZD/USD approaching support Currently have this pair on my watchlist for the upcoming week. Should price continue to move downward breaking the 200 EMA, I'll enter short beetween 0.70500 and 0.69600, coincident with the head and shoulders neckline, on a doji/pin bar candlestick. I will then consider to take profit / scale out around 0.6700 in case the upward-sloping trendline will provide strong support
Hope you liked the idea, wish you good luck!

AUDUSD : two breakdowns = first indications of weaknessThe AUDUSD pair is inside an upside trend, since June 2016. Higher tops and higher bottoms were defining that trend.
Currently, there are the first signs of a potential weakening bullish dynamic :
- The pace of the progression is slowing down , as shown by the break of the ascending trendline support. This was the first signal that should have raised our attention.
- The previous short term bottom (0.75576) has been broken too .
These two elements happened on the same day.
The next step to see if the AUDUSD is really constructing a reversal is the support at 0.75065, which is reinforced by the 200 days moving average . If that level had to be broken too, we would be looking for short term bounces to find opportunities to enter short on that pair.
Stay tuned, and feel free to leave a comment with your opinion

usdchf short we are in supply zone and we have a resistance
price formed a triangle and breaks out of it right into our zone
i want to enter after a 4 h candle can close below/outside of the triangle ..
we are here to react not to predict ;-)
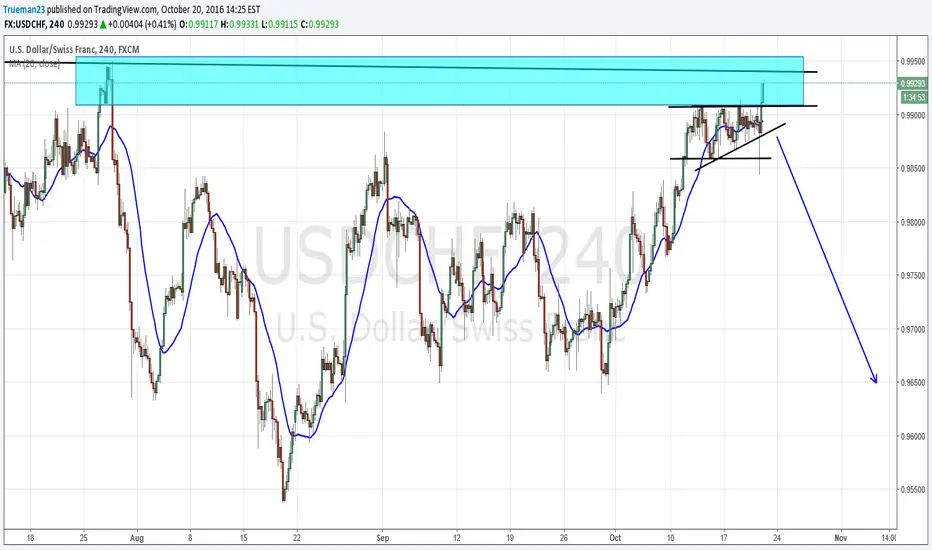

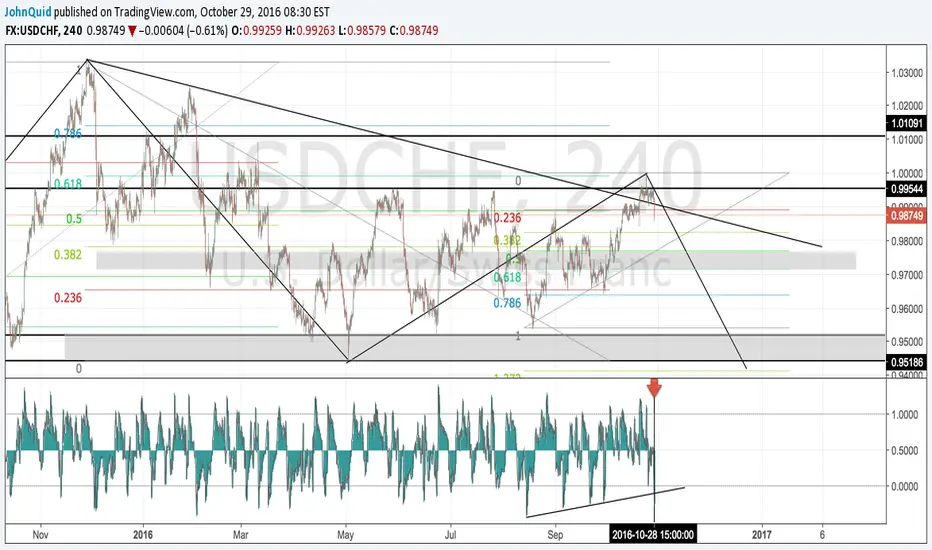
U$DCHF TREND BREAK SHORTIm going against the rally of the dollar and bullish bias of this pair looking for a nice retracement short. Rejection on and break back into the previous longer trendline Also we have a BB% trend break wich validates this idea.