AAPL Better Hold HereAAPL closed yesterday right at hourly and 15 minute support. If /ZB sells off, then I think the /NQ sells off. That will drag AAPL under support. Then 168 is possible, or lower.
Breakdown

Apollo hospitalsSo we were waiting for the breakout rather we got a breakdown today as there was selling pressure in the markets.

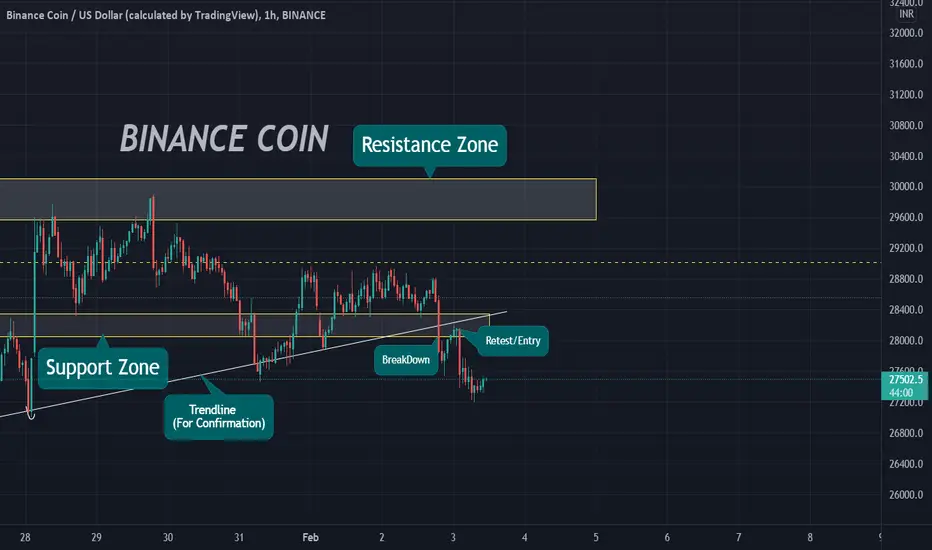
BINANCE Support Breakdown Retest Entry.If anyone wants me to explain this chart analysis to them, then please comment and let me know.
P.S: I'm getting into the habit of posting multiple Ideas per day and that's why i'm not willing to put much time and effort into describing my analysis. However, I'll be more than glad to explain the ideas later on to anyone, who's got subjective and non-linear questions.
With that being said...
Happy Trading !!!
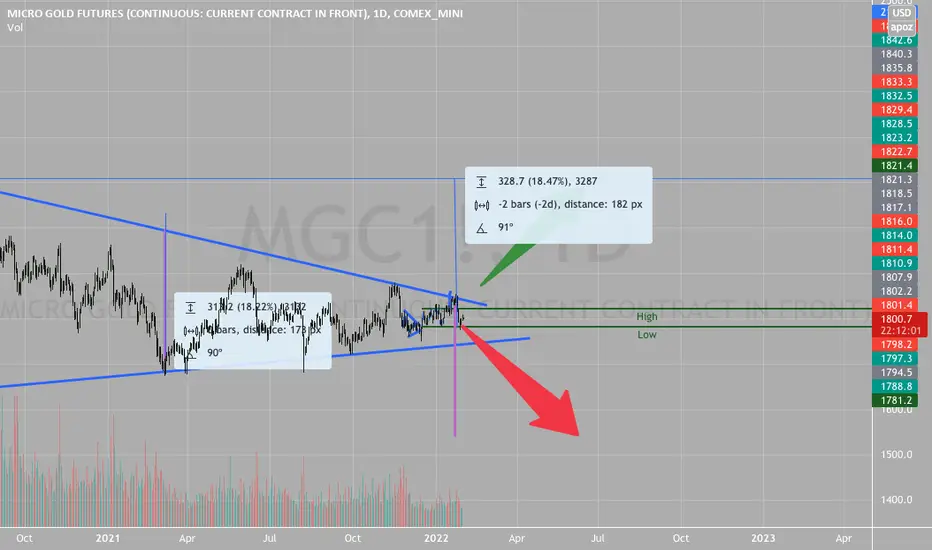
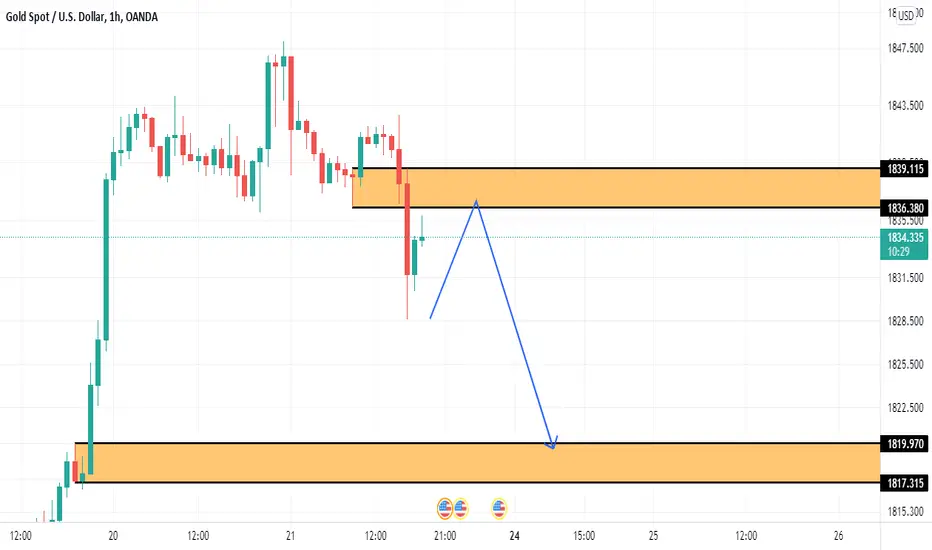
Gold Giant Pennant "Giant Pennant" sounds funny, but that is exactly what Gold finds itself in. A giant contracting pennant pattern.
The nice thing about these patterns is which ever way they conclude they move to approximately the length of
the widest range of the pattern. The bad thing about these patterns is that no one can really know how they will
conclude. The ending is often marked by many fake outs, leading both buyers and sellers to mistake which way
the pattern will conclude. If the markets can stay strong and oil continue its push to 93, then we can reason
1. there will be highly likely a bearish fake out dipping below the bottom of the pennant bottom.
2. We can estimate the price target at around 2110.
3. IF on the other hand the market remain weak this will likely do the opposite and fake out the bulls and conclude
down to a target of 1541.
We only need patience and let this play out and with more certainty we can profit from what wil likely be a very
strong move in either direction
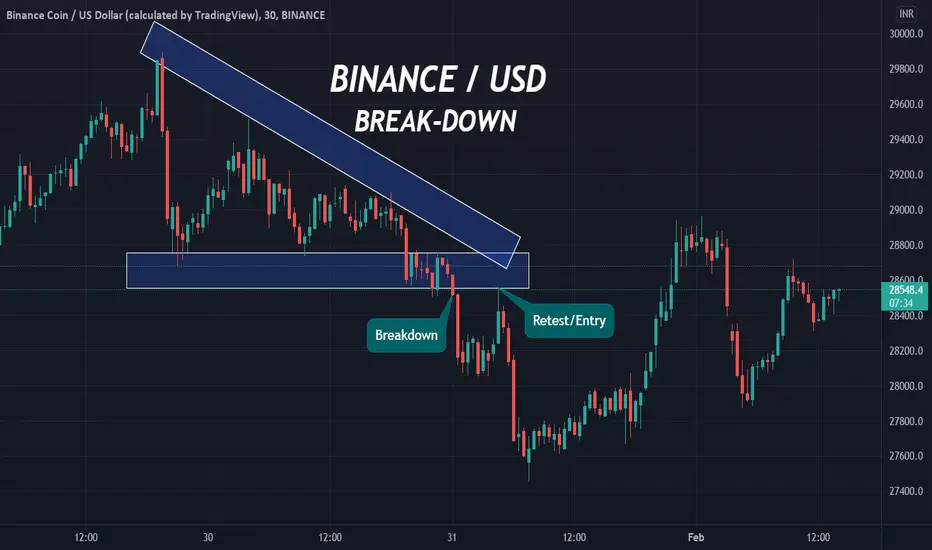
BINANCE COIN EASY + PROFITABLE SETUP.So, what you all actually see is a Descending Triangle Pattern formed in Binance Coin.
A descending triangle is a part of the 3 famous triangle patterns, namely:- Ascending, Descending, Symmetrical.
All these patterns are some way or another part of Price Action Trading. In this case the upper trend line indicates lower highs and the bottom line indicates equal lows(~).
And eventually, price breaks the pattern and a Bearish Breakdown occurs.(Keeping in mind that the break may vary in the other two patterns).
After the price took a little support, it went back up and retested the previous support which is generally when most of the traders prefer to enter and make a position, as it's the safest entry possible in the given circumstances.
With that being said...
Happy Trading !!!
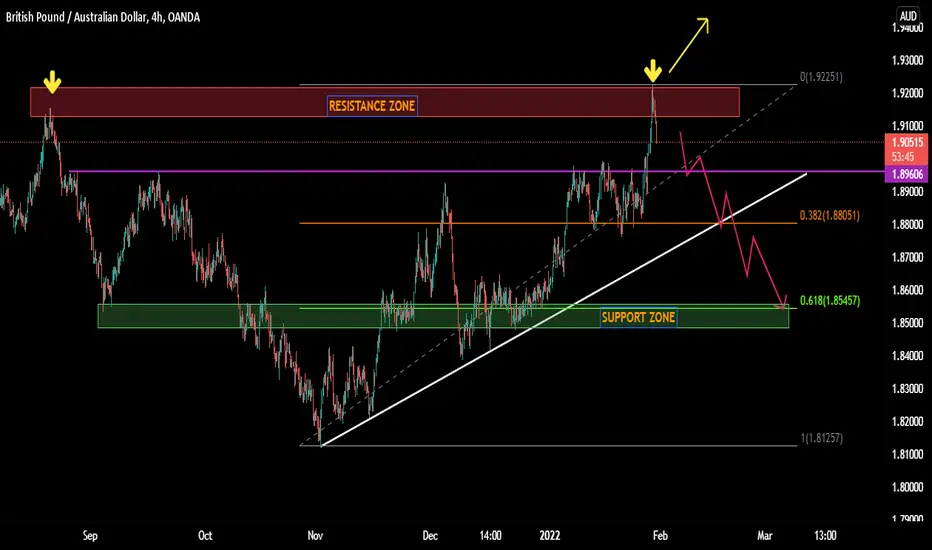
GBPAUD - SETUPGBPAUD price dropped from a critical resistance area after printing a good upside move last week. We are expecting that bears will show dominance and will drag the price down towards fib level 0.38% and if they carry out their momentum the price will drop towards a 0.618% level. So watch the levels carefully.
Simple PRICE ACTION Setup In LUNA.One of the simplest setups a trader would fancy is like such, didn't really take long enough to find this setup but this was personally what I usually look for, whether looking in Equities or Cryptocurrencies.
Let me emphasize on the fact that how ideal this setup was for many traders including myself and also reconsidering that you don't find such easy setups everyday.
With that being said, I'm not sure if there's anything much to explain about in this setup.
Happy Trading !!!

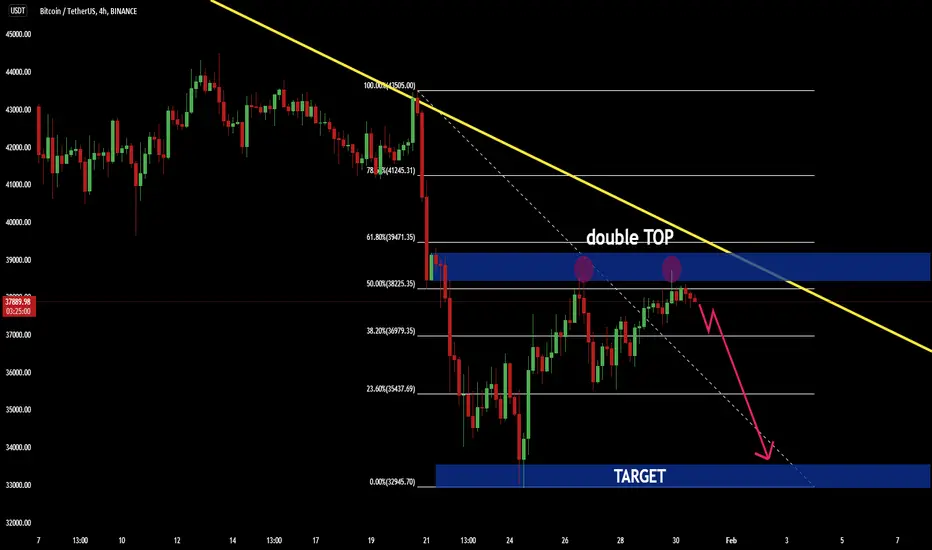
BITCOIN - 50FIB LEVEL 📉the btcusd price is in 50% fibonacci level 🔥
i predict a bearish double top 📉
🧐 waiting for BREAKDOWN🔥
TARGET: 33030 🎯
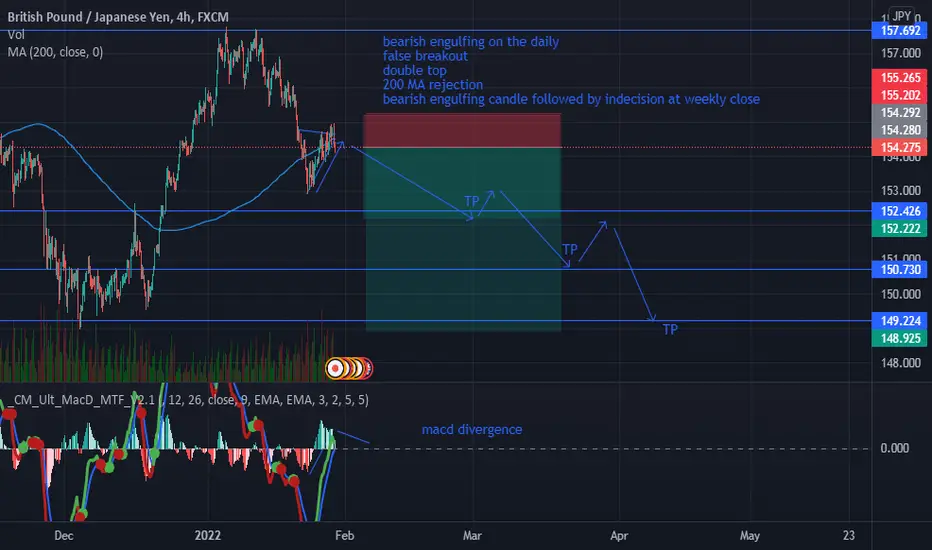
GJ Shortfalse breakout
double top
200 MA rejection
bearish engulfing candle followed by indecision at weekly close
USDJPY breakdown (areas for entry)Looking at catching the larger move with the trend, so I have a few areas I will look for buys from. Once price comes into these areas ill be reading price action on the lower time frames and looking for the best entry points.

LUNA/USDT break down and Now Bearish IMO#LUNA/USDT
$LUNA failed to hold $60 support area.
Next 3 days Weekly candle will close.
But I am not Bullish now.
$43 is good support is hold this support then we can see Bearish Retest till $70
After again It will go down Toward $20
So be careful if You open any trade.
And If already opened then Keep in mind Your Risk reward ratio and Place stop Loss.
Support:- $43/$18
Resistance:- $70

+530 Pips Profits + New Weekly Breakdown Video Full SetupsThis is an educational + analytic content that will teach why and how to enter a trade
Make sure you watch the price action closely in each analysis as this is a very important part of our method
Disclaimer : this analysis can change at anytime without notice and it is only for the purpose of assisting traders to make independent investments decisions

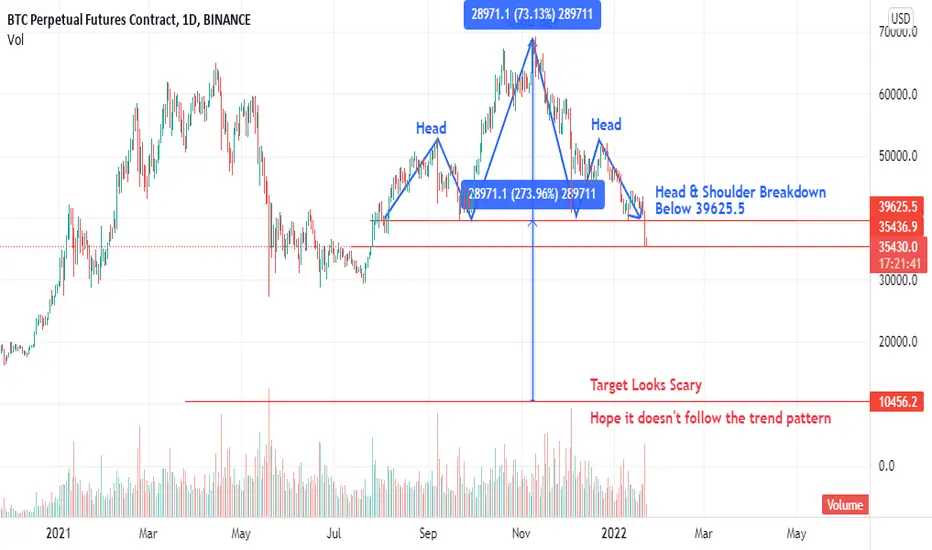
HEAD & SHOULDER PATTERN BREAKDOWN - BITCOINOn a daily time frame, Bitcoin is forming a Head & Shoulder Pattern. Breakdown below 39625
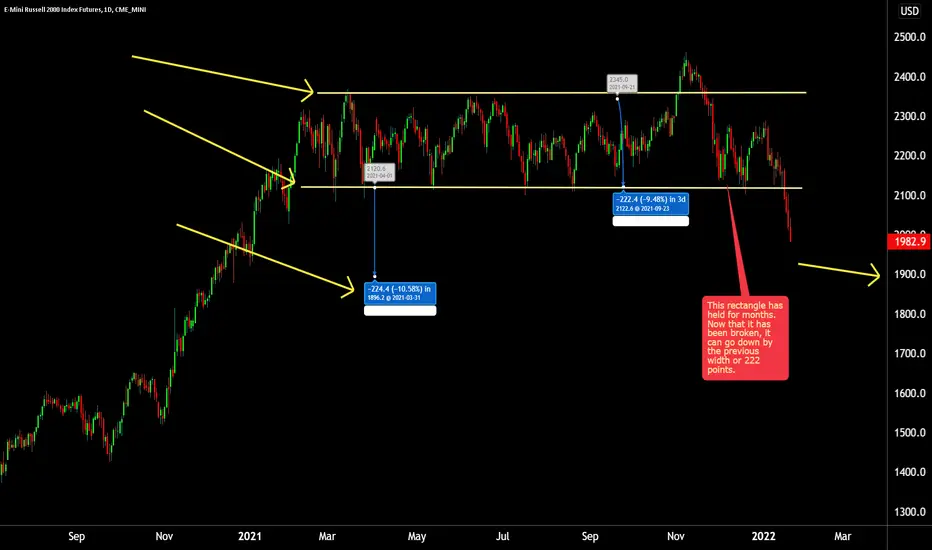
The RUT Futures Break of the Rectangle Measures to under 1900.The RUT futures had been in a rectangle, for months. The width is around 222 points. To me, the first objective is the width of the rectangle from the breakdown. That would measure to under 1900.
BTC breakout or breakdown?If BTC breaks below $40.5k it will likely breakdown to $35k and if that fails $30K. Volume needs to pickup for a breakout to happen.

OPEN - broke support levelOPEN - 10.50 level was support level, now it's resistance
Looks like a nice long term short idea,
no support here, can go much lower
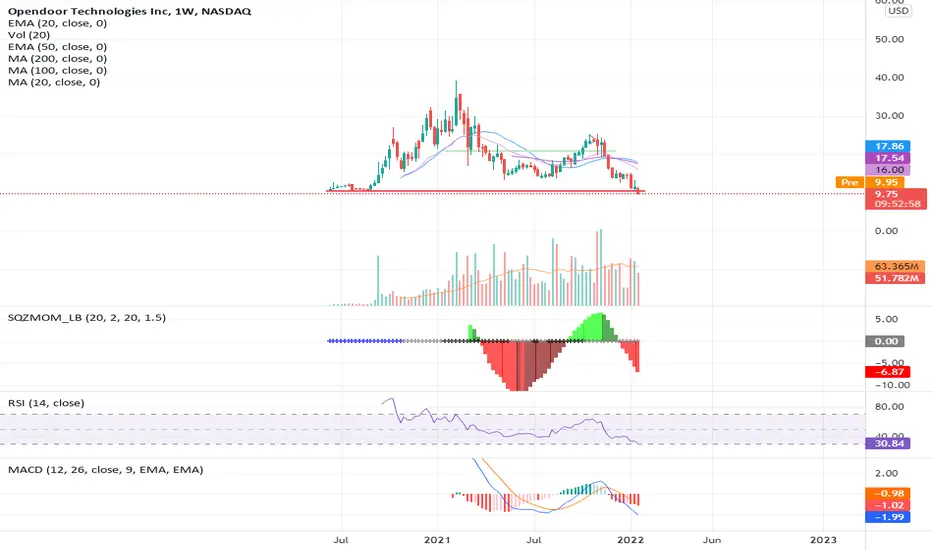


CLF - looks like perfect short at this pointBroke down the support level
MACD, RSI and MAs are also confirming breakdown
Room to go
Target - nest strong support


Weekly Breakdown Video Gold + EurUsd + Oil With Great SetupsThis is an educational + analytic content that will teach why and how to enter a trade
Make sure you watch the price action closely in each analysis as this is a very important part of our method
Disclaimer : this analysis can change at anytime without notice and it is only for the purpose of assisting traders to make independent investments decisions
