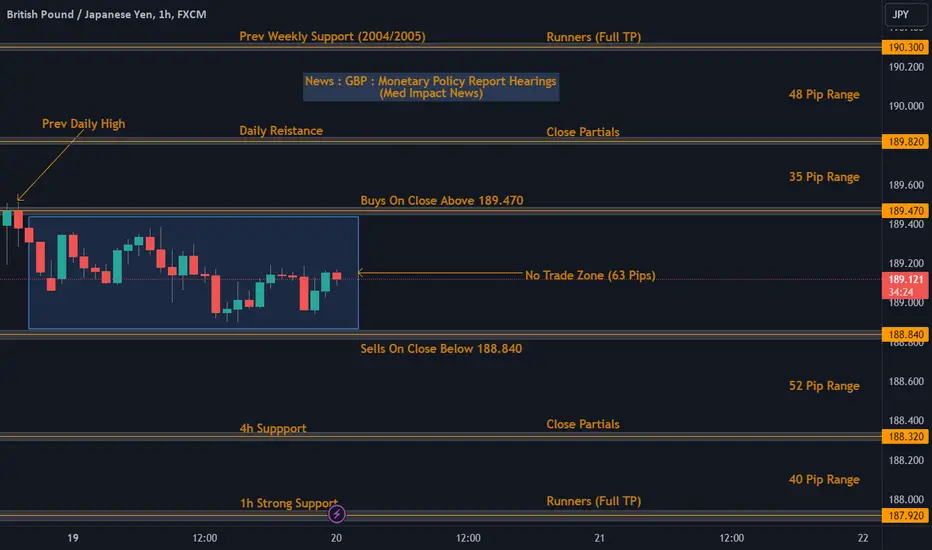
GBPJPY Technical Analysis 20th February 2024 1h chart– Monday Daily candle closed weak Bearish as price ranged overall on the 4h timeframe within the no trade zone so the analysis will remain the same as the one posted yesterday. I’ll be looking for potential Buys above 189.470 targeting recent Daily Resistance at 189.820 and previous Weekly Support held back in 2004/2005 around 190.300. I’ll be looking for potential Sells below 188.840 targeting 4h Support at 188.320 and strong 1h Support around 187.920. Ideally is to allow the Asian session to form a new range for the week ahead and wait for a much better confirmation around the London session.
Breakdownalysis
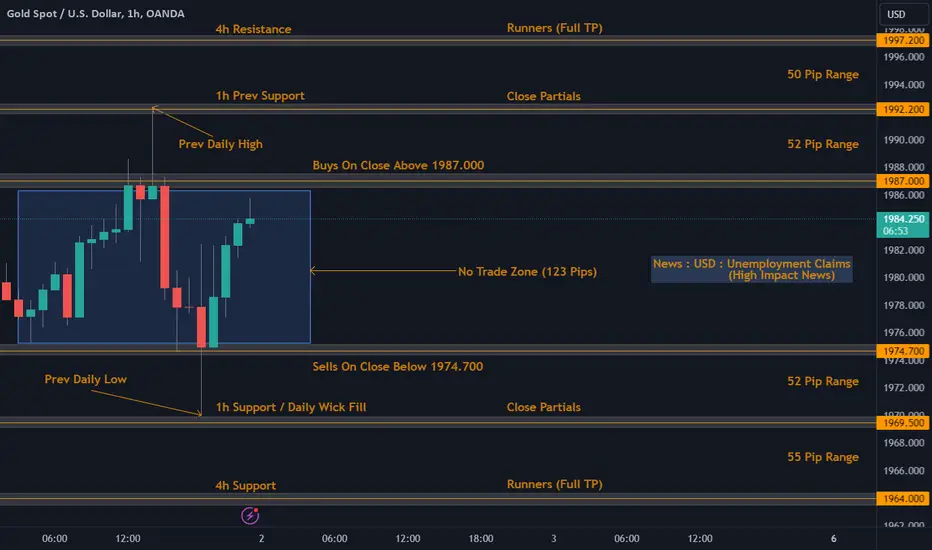
XAUUSD Technical Analysis 02.11.2023 1h chart– Previous Daily candle closed Doji Bearish around 1982.400 as price tapped and rejected the Daily Support formed on Wednesday 25th October 2023.
– Buys on close above 1987.000 targeting 1h previous Support formed around 1992.200, Leaving Runners to the 4h Resistance formed around 1997.200.
– Sells on close below 1974.700 targeting 1h Support formed around 1969.500, Leaving Runners to the 4h Support formed around 1964.000.
– High Impact News ahead of the New York session for the US Dollar for Unemployment Claims.
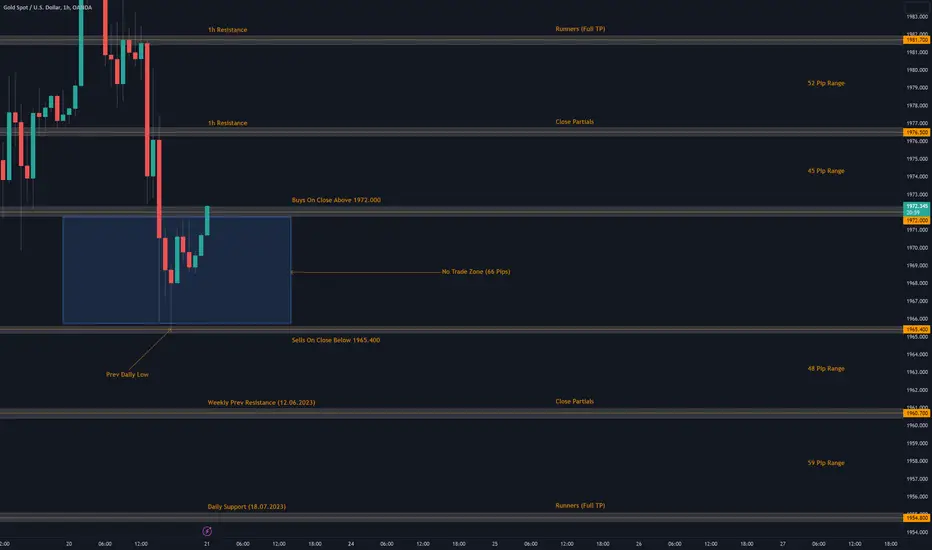
XAUUSD Technical Analysis 21.07.2023 1h chart– Previous Daily candle closed Bearish at 1969.500 forming Daily Resistance at 1978.900 leaving a Rejection wick at 1987.700.
– Buys on close above 1972.000 targeting 1h Resistance at 1976.500, Leaving Runners to the next 1h Resistance formed at 1981.700.
– Sells on close below 1965.400 targeting Weekly previous Resistance formed on 12th June 2023 at 1960.700, Leaving Runners to the Daily Support formed on 18th July 2023 at 1954.800.
– Ideally is to wait for price to breakout of the Consolidation zone during High Volume Time to increase the probability of winning trades.