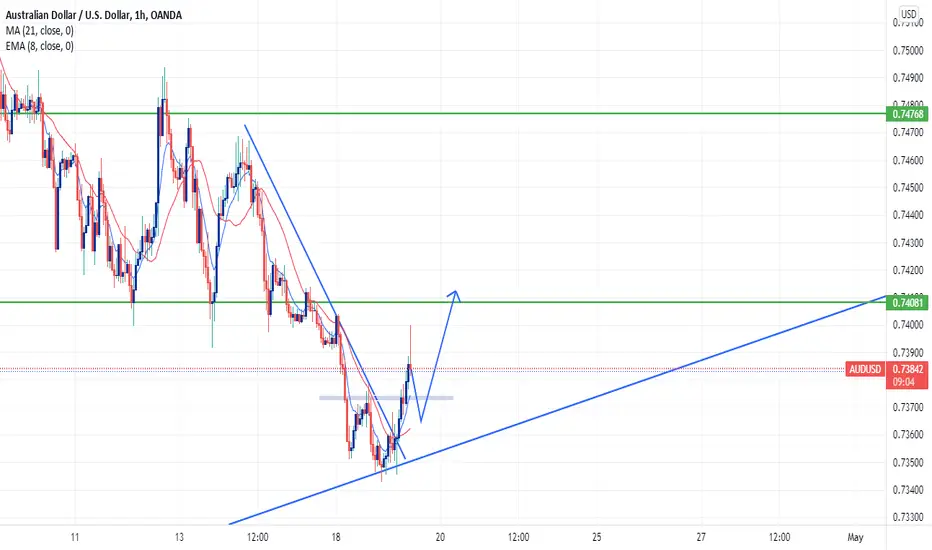
AUDUSD LONGOANDA:AUDUSD
AUDUSD broke bearish countertrend, waiting for a retest and a reversal pattern to
go long on AUDUSD
Breakofstructure
OGN GOING TO MOON!!!OGN just had break of structure on lower timeframes and change of chracter on higher timeframes,this is very bullish move and also if you take in consideration the choppy market it did it in makes it even more bullish.
I will be waiting for retest of the zone marked and will have my entry there as a swing position aiming for new high that is over 80% and with leverage i use its 400%.
Market slowly turning back to bullish,waiting for btc to test 39k demand zone and then go to the moon and new highs
I WILL BUY BELOW 0.475
NOT FINANCIAL ADVICE!

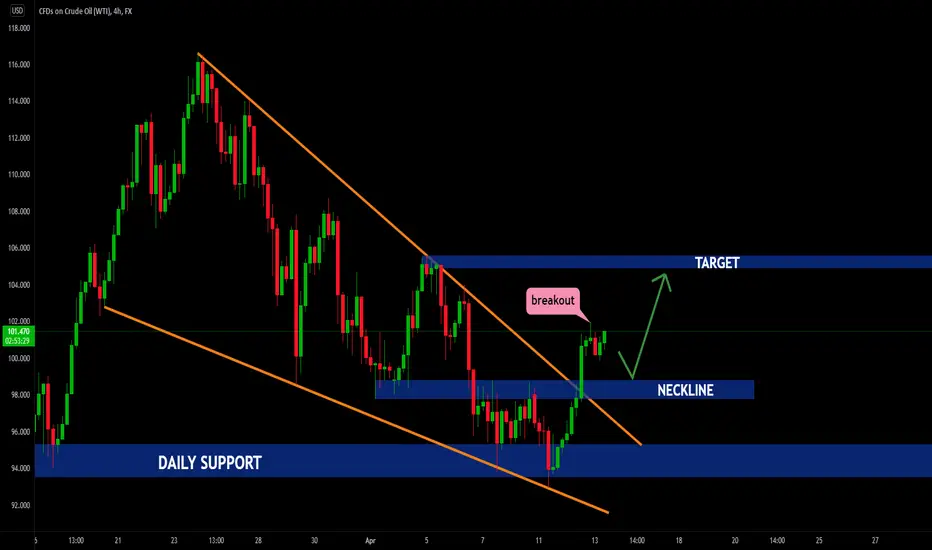
USOIL - BULLISH MOVE 🚀🚀🚀
the USOIL price is in daily support level , the neckline is broken 🔥
i predict a bullish move 🚀 i'm waiting for a retest (break of structure & buy confirmation) 📈
TARGET: 105.065 🎯
if you agreed with this IDEA, please leave a LIKE, SUBSCRIBE or COMMENT!
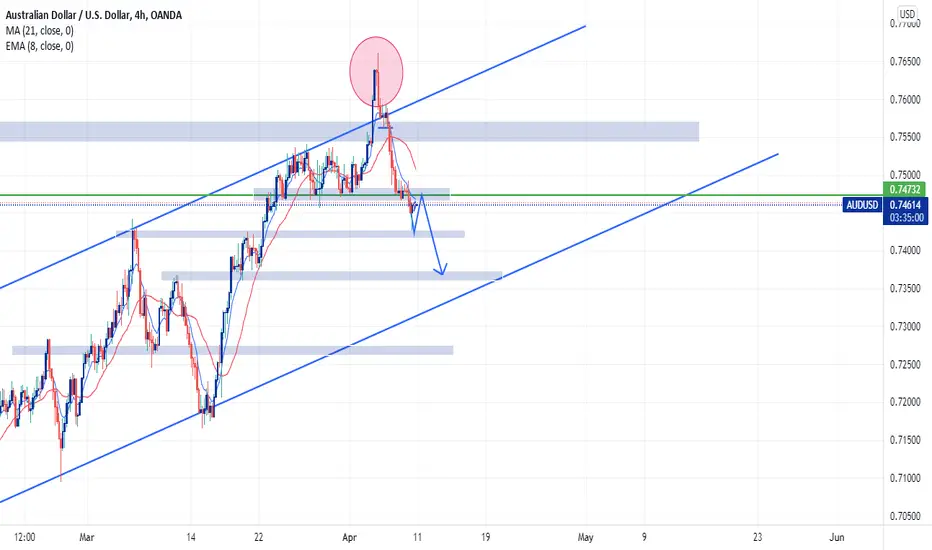
AUDUSD shortOANDA:AUDUSD
Expecting a bearish movement on AUDUSD with price breaking structure on the 1H. On the DAILY and WEEKLY timeframes a long wick(shooting star candlestick) formed on a major/key level of resistance. Price also broke support and is making a retest
USDCAD Buy analysis for the week, probability is high and trust So you can see the reason of the bias written in the chart as you can see. we got the King high broken and we getting the retest to the valid Orderrblock, the whole move reacted of a valid OB and killed a inducement OB before hand. so I know it will switch to a bullish market this week. Trade safe and enjoy

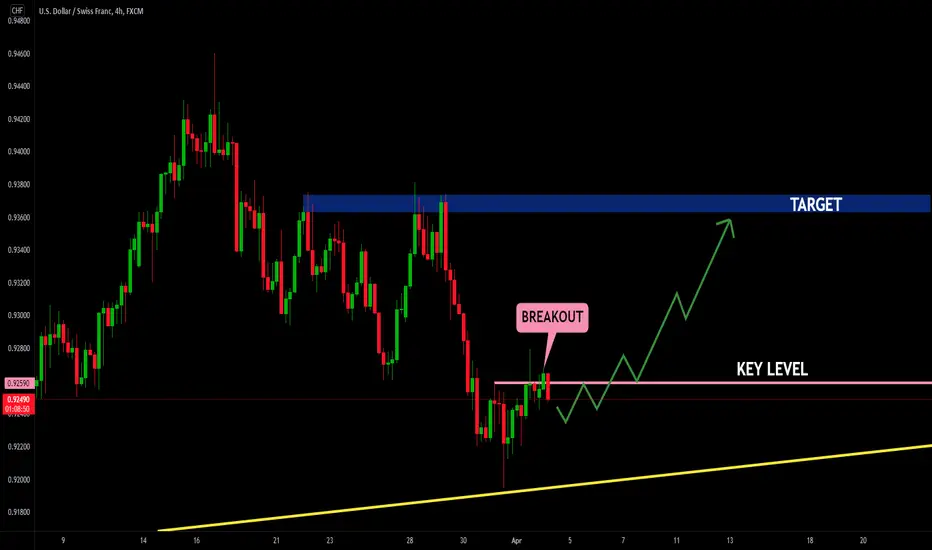
USDCHF - BREAK OF STRUCTURE 🚀🚀🚀
the USDCHF price reached a support level ,the key level has broken ✔
i predict a bullish move 🚀 i'm waiting for a retest (break of structure & buy confirmation) 📈
TARGET: 0.93689 🎯
if you agreed with this IDEA, please leave a LIKE, SUBSCRIBE or COMMENT!
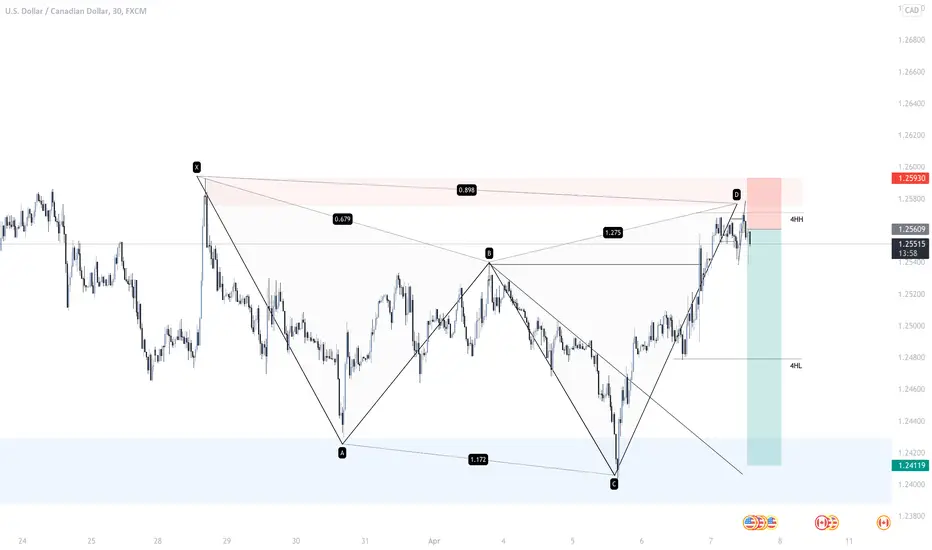
Shark Complete In Nice PRZ 🦈USDCAD - Looking very nice for the short (Even though 20 pips was hit price retraced you can still re-enter), shark pattern complete in strong supply zone, we've had a nice wick up clearning liquidity then multiple LTF breaks to the downside, targets are the B point, 4HL and then the next demand zone!
let me know your thoughts!
* Disclaimer **
These ideas I never trade until the end target with my initial lots, I focused on high probable entries with higher lots and use a specific partial taking strategy giving me a very high win rate and take most of my profits very early, I only leave a small % of my capital to run the entire trade. On the flip side im constantly monitoring LTF momentum and will close early if things change, these analysis's are for research purposes only.
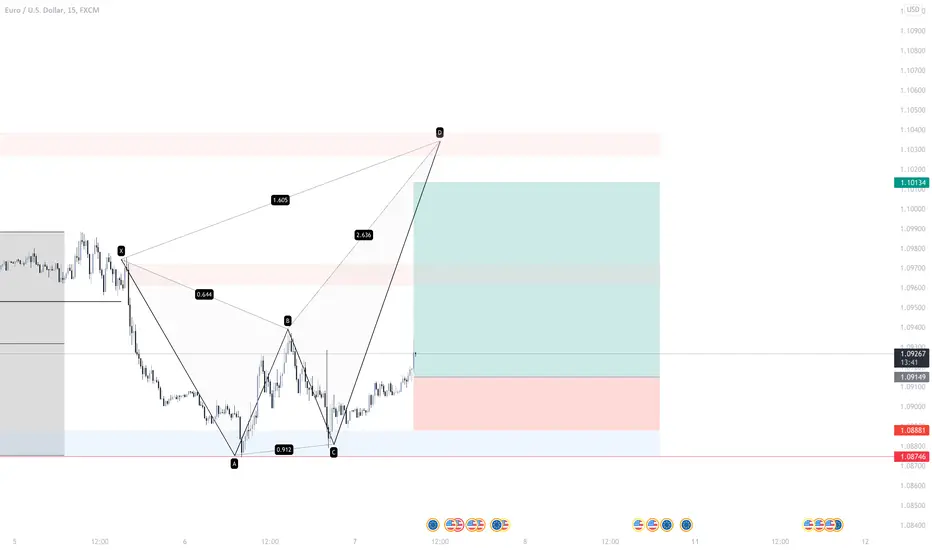
Potential Crab Forming 🦀EUR/USD - (Retracement - Be careful with your lots) Looking to complete this potential crab after the rejection/LTF confirmation from the demand zone, first target is the B point, second is the X point and final is the D point.
Also looking for the dollar to pullback into the trading range, this should also give EUR/USD a nice pump.
Let me know your thoughts!
* Disclaimer **
These ideas I never trade until the end target with my initial lots, I focused on high probable entries with higher lots and use a specific partial taking strategy giving me a very high win rate and take most of my profits very early, I only leave a small % of my capital to run the entire trade. On the flip side im constantly monitoring LTF momentum and will close early if things change, these analysis's are for research purposes only.
GBPNZD Market StructureHey Traders,
Looking at GBPNZD, we've had a double break of structure here on the one hour chart with both impulse moves being very solid as money floods into the pound against the New Zealand dollar. Looking to see if we can pull back into the green demand area which I've drawn out. If we can pull back into this area and the chart starts to give me an idea that we are going to start heading higher (things like a break of structure on the five minute chart or trendline break a couple of indicators indicating that we're going to start heading higher) I'm going to look to start building a position around this demand area and moving it back up into the next two supply zones, which I've drawn out. Ideally I want to head to the top supply zone, but we may not make it that far depending on how we react off of this next area.
Overall, I was looking for a bullish New Zealand dollar, which obviously meant a bearish bias on this chart long term, however given the whole reason I was looking for a bullish New Zealand dollar was because the Aussie dollar has shown a lot of strength and it usually coincides. We have seen a bit of difference and with the pound starting to pump in a little bit after being such a weak valued currency, I think we could start seeing the potential to move higher, especially on these lower time frames.
Let me know what your analysis on this pair and if you think this is going to play out. I'll update you as we move closer into this area in a few hours to have a discussion about where I truly think at the entry points will be or whether or not we'll leave the trade alone.

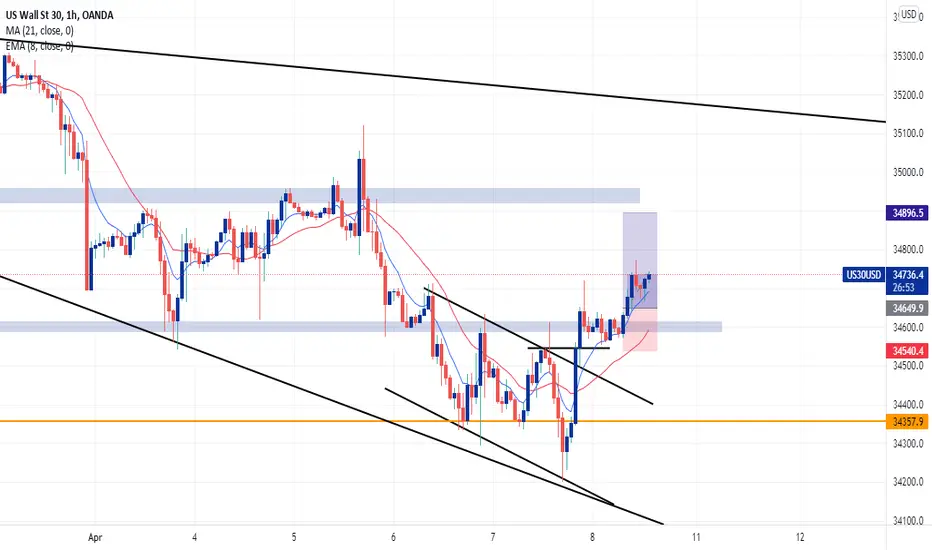
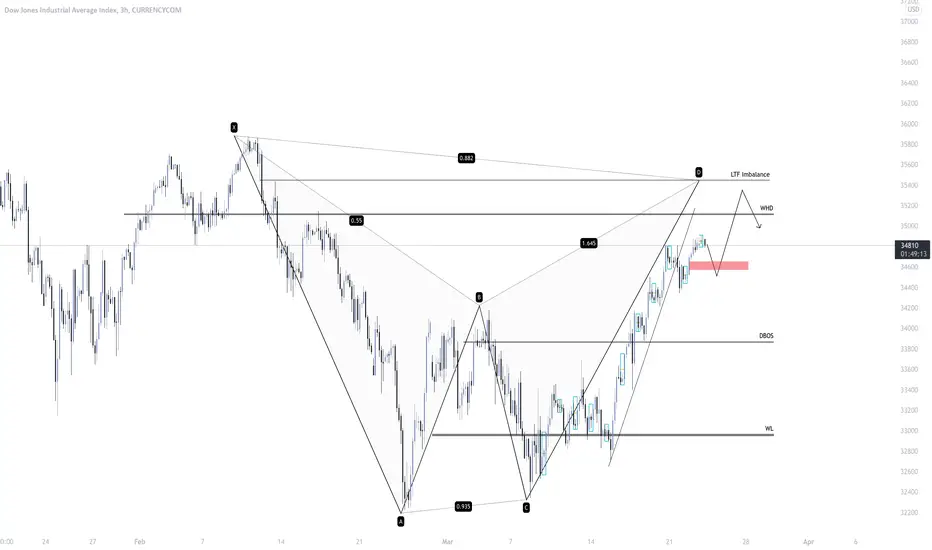
Potential Shark Forming 🦈🦈US30 - Trading with HTF PA, looking for this demand level to hold and to complete the Shark, we have LTF confirmation for buys, hopefully this level will take us up to the D point!
Let me know your thoughts!
* Disclaimer **
These ideas I never trade until the end target with my initial lots, I focused on high probable entries with higher lots and use a specific partial taking strategy giving me a very high win rate and take most of my profits very early, I only leave a small % of my capital to run the entire trade. On the flip side im constantly monitoring LTF momentum and will close early if things change, these analysis's are for research purposes only.

Shark Complete 🦈EUR/USD - Shark complete with a 4H BOS, price is sitting in premium zone for buys, i was shorting this and it broke the last demand zone before structure, now i'm looking to take this long up towards premium sell levels for continuations! (Be careful with lots as this is a retracement)
Let me know your thoughts!
|* Disclaimer **
These ideas I never trade until the end target with my initial lots, I focused on high probable entries with higher lots and use a specific partial taking strategy giving me a very high win rate and take most of my profits very early, I only leave a small % of my capital to run the entire trade. On the flip side im constantly monitoring LTF momentum and will close early if things change, these analysis's are for research purposes only.

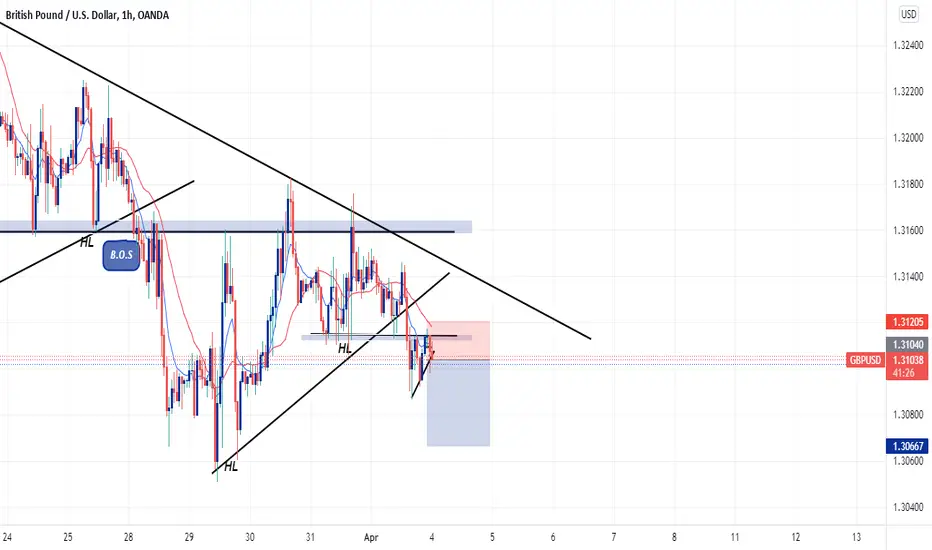
GBPUSD ShortOANDA:GBPUSD
GBPUSD broke structure and made a retest on resistance along with a bearish engulfing candle
Shark Complete In Nice PRZ 🦈USOIL - Nice rejection with multiple BOS on the lower TF, waiting for a pullback and this demand level to hold before potentially going long to fill the gap!
Let me know your thoughts!
* Disclaimer **
These ideas I never trade until the end target with my initial lots, I focused on high probable entries with higher lots and use a specific partial taking strategy giving me a very high win rate and take most of my profits very early, I only leave a small % of my capital to run the entire trade. On the flip side im constantly monitoring LTF momentum and will close early if things change, these analysis's are for research purposes only.

Potential Bat 🦇US30 - Looking for a nice retracement (Have LTF confirmation) before a continuation up towards the D point of this bat.
Let me know your thoughts?
* Disclaimer **
These ideas I never trade until the end target with my initial lots, I focused on high probable entries with higher lots and use a specific partial taking strategy giving me a very high win rate and take most of my profits very early, I only leave a small % of my capital to run the entire trade. On the flip side im constantly monitoring LTF momentum and will close early if things change, these analysis's are for research purposes only.
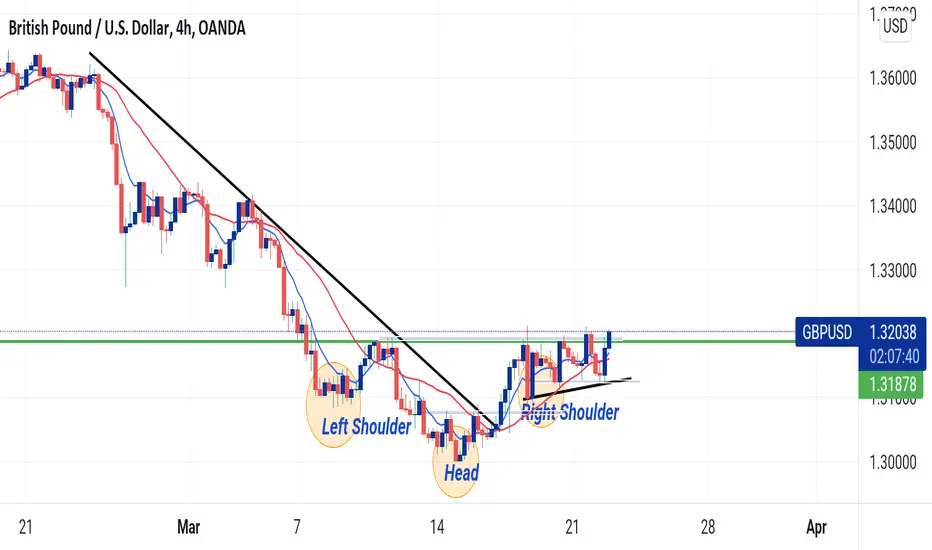
GBPUSD LONGOANDA:GBPUSD
An inverse head and shoulder pattern has formed on GBPUSD as price breaks bearish structure, price should break neckline/resistance to validate a bullish move on GBPUSD
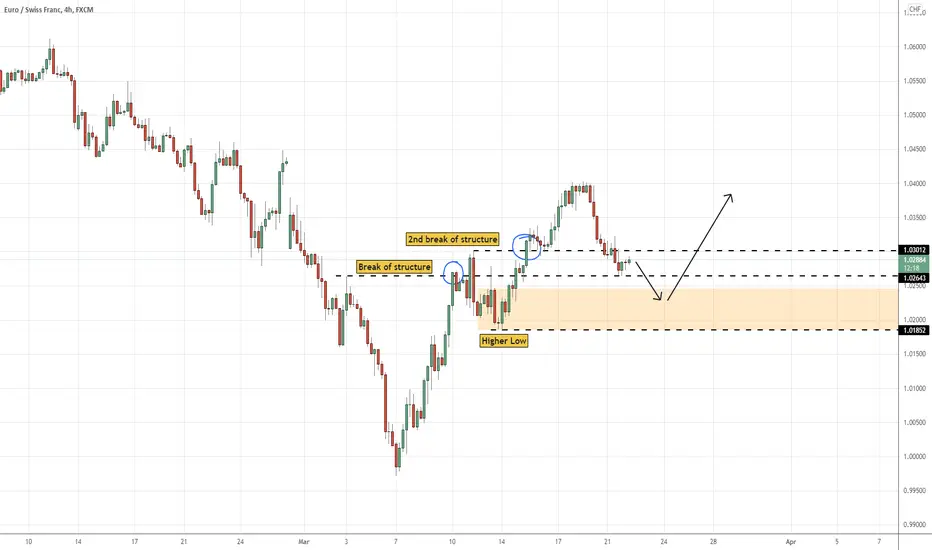
EURCHF Change of Trend (BOS)EURCHF has managed to create a BOS (Break of Structure) two times over, indicating it may be time to start thinking bullish.
I am looking for entry points around the area of demand that managed to group enough orders to break the new found recent high.
Keep an eye on the lower timeframes for indication of a move.
AUDUSD shortOANDA:AUDUSD
AUDUSD broke uptrend structure, we need a valid retest with a valid reversal candlestick pattern at the fibs to go short.

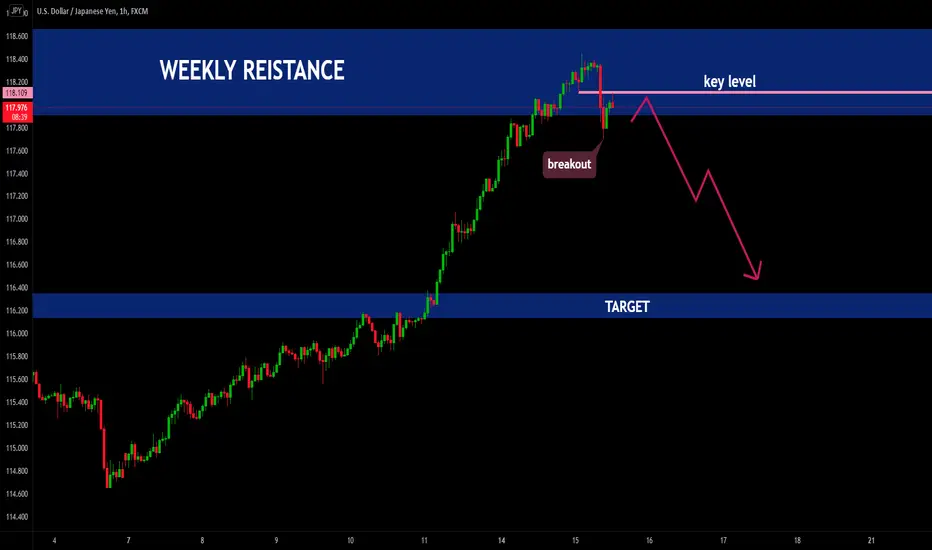
USDJPY - BREAK OF STRUCTURE 📉
THE USDJPY PRICE reached a weekly resistance level .
the key level has broken, so i predict a bearish move 📉
TARGET: 116.382 🎯
if you agreed with this IDEA, please leave a LIKE, SUBSCRIBE or COMMENT!
AUDUSD LONGOANDA:AUDUSD
AUDUSD just broke the bearish structure on the Daily chart.
It had formed a double bottom pattern and broke the neckline of the double bottom
and also closing above the previous Lower High breaking structure. Price further made
a 50.0% retest and candle closed as a bullish engulfing, confirming
a buy setup on AUDUSD.

GBPJPY Counter-Trend Trade 08/03/2022There is a Daily area of Demand that price is heading towards. Price has recently created a new swing low on the 4h timeframe and I am looking for a upwards LTF BOS which will signify a pullback may occur within the swing structure. There is a 4 hour area of Supply that caused price to break past the weak 4h low.

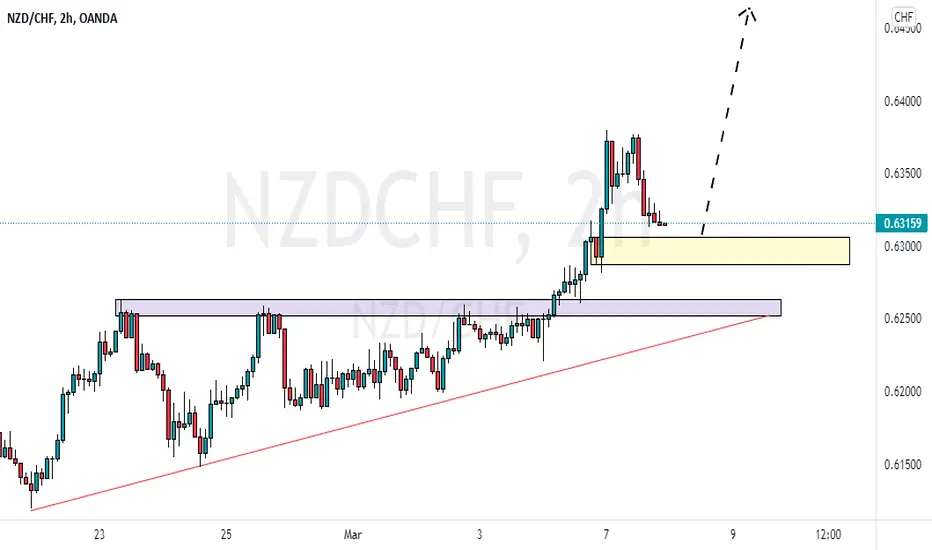
NZDCHF (LONG) 🔥🔥🔥Based on the break of structure and retest strategy. We should see a bullish momentum if the OB holds.
Risk Disclaimer:
Please be advised that I am not telling anyone how to spend or invest their money. Take all of my analysis as my own opinion, as entertainment, and at your own risk. I assume no responsibility or liability for any errors or omissions in the content of this page, and they are for educational purposes only. Any action you take on the information in this analysis is strictly at your own risk. There is a very high degree of risk involved in trading. Past results are not indicative of future returns. Good luck
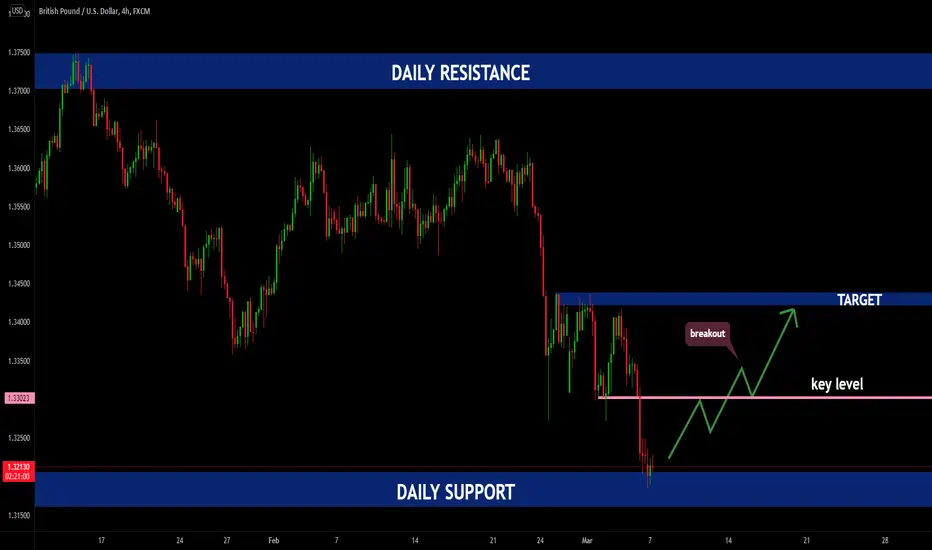
GBPUSD - BREAK OF STRUCTURE 🚀the GBPUSD price reached a daily support level 🔥
i predict a bullish move 🚀
i'm waiting for breakout & retest in the key level (break of structure & buy confirmation)🧐
TARGET: 1.34250 🎯