Gold Price Outlook: A Deeper Correction Ahead?Hello everyone! What are your thoughts on the current gold market?
Gold's decline is picking up speed, with the price now testing the 3,320 USD level. A stronger U.S. dollar, coupled with recent developments in the U.S.-EU trade agreement, has significantly reduced demand for gold as a safe-haven asset.
From a technical perspective, the break below the rising price channel is a key signal. It could mark the beginning of a deeper correction, as oscillators are starting to show negative momentum, indicating that the path of least resistance is now downward.
Looking ahead, all eyes will be on Wednesday’s FOMC decision. The market will be watching closely for any signs of a rate cut roadmap from the Federal Reserve, especially during Powell’s press conference. Additionally, several important U.S. macroeconomic data releases this week could provide new momentum for the USD and play a crucial role in shaping gold's next move.
What are your thoughts on where gold is heading? Let us know in the comments below!
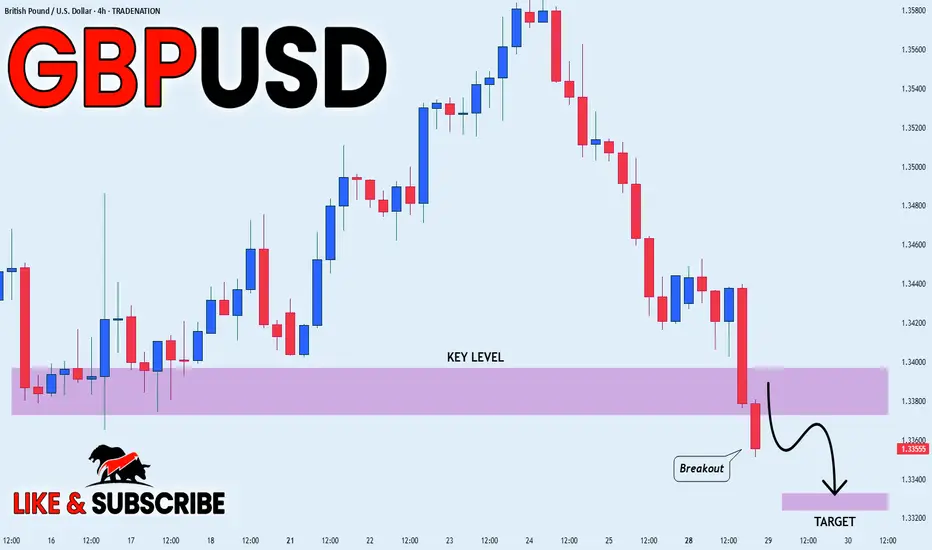
Breakout

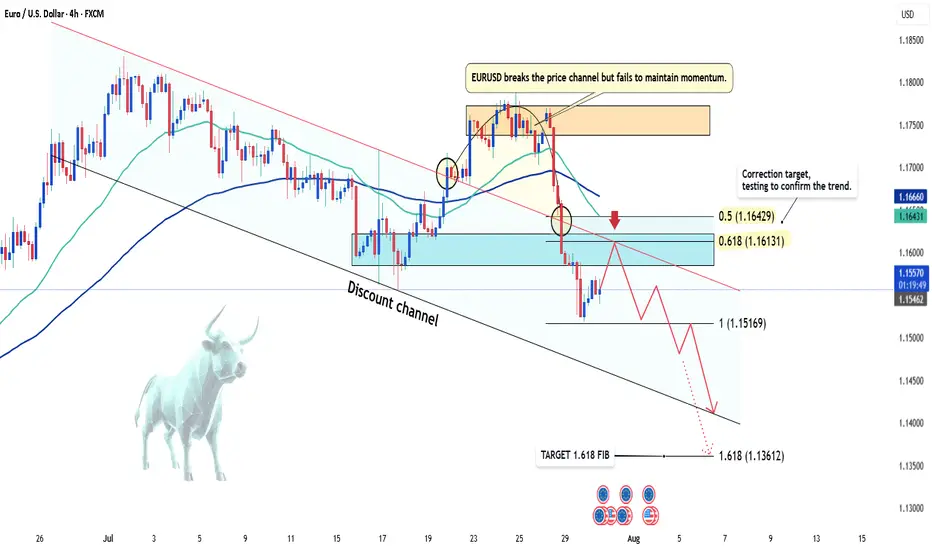
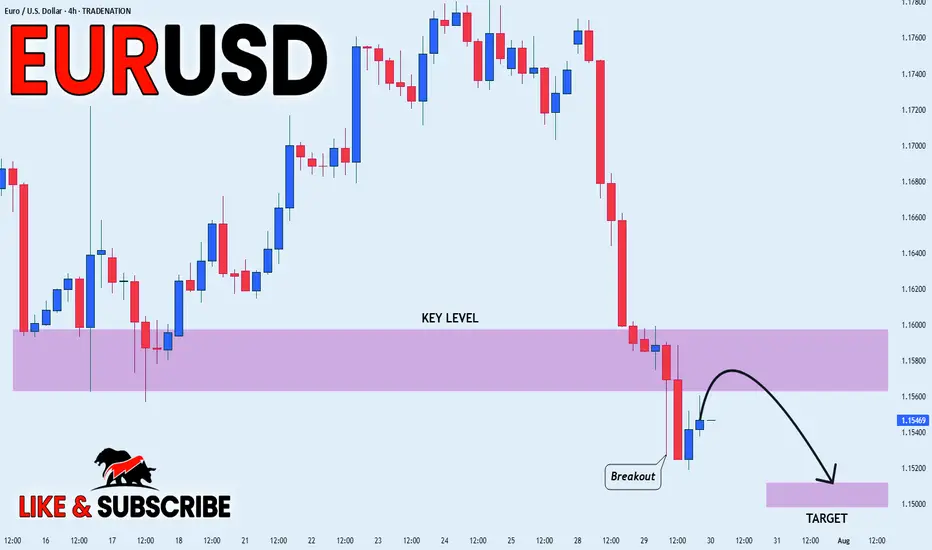
EUR/USD Latest Update TodayHello everyone, what do you think about FX:EURUSD ?
EUR/USD previously broke the downward price channel, but failed to maintain the momentum, leading to a strong correction phase. Currently, the price is trading around 1.156 and testing key Fibonacci levels, with the 0.5 - 0.618 levels marked as potential reversal zones, as highlighted in the analysis.
With the current market sentiment, the strong recovery of the USD has been the main factor driving the EUR/USD movement in recent days. Positive economic data from the US has strengthened the US dollar, decreasing the appeal of gold and safe-haven assets like the EUR. Furthermore, expectations surrounding Fed policy decisions continue to add pressure on EUR/USD, with investors bracing for the possibility of the Fed maintaining high interest rates for a longer period.
For traders, it's clear that the bearish trend is in favor, as indicated by the EMA reversal. The Fibonacci levels 0.5 (1.164) and 0.618 (1.161) will be crucial zones, where reaction signals could open opportunities for SELL positions. The next target will be at Fib 1 and Fib 1.618.
That's my perspective and share, but what do you think about the current trend of EUR/USD? Leave your comments below this post!
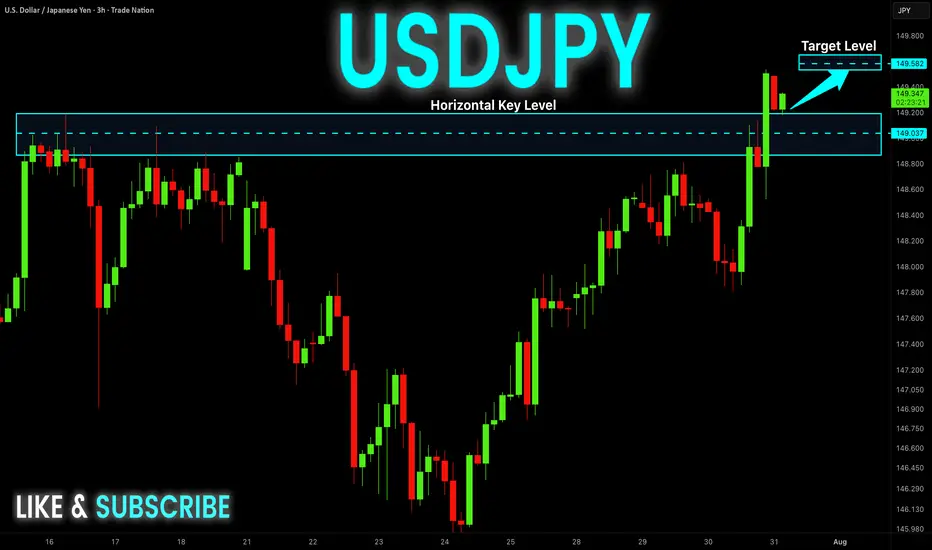
USD-JPY Will Keep Growing! Buy!
Hello,Traders!
USD-JPY keep growing and
The pair made a bullish breakout
Of the key horizontal level
Of 149.181 and the pair is
Already retesting the new
Support and we will be
Expecting a further
Bullish move up
Sell!
Comment and subscribe to help us grow!
Check out other forecasts below too!
Disclosure: I am part of Trade Nation's Influencer program and receive a monthly fee for using their TradingView charts in my analysis.
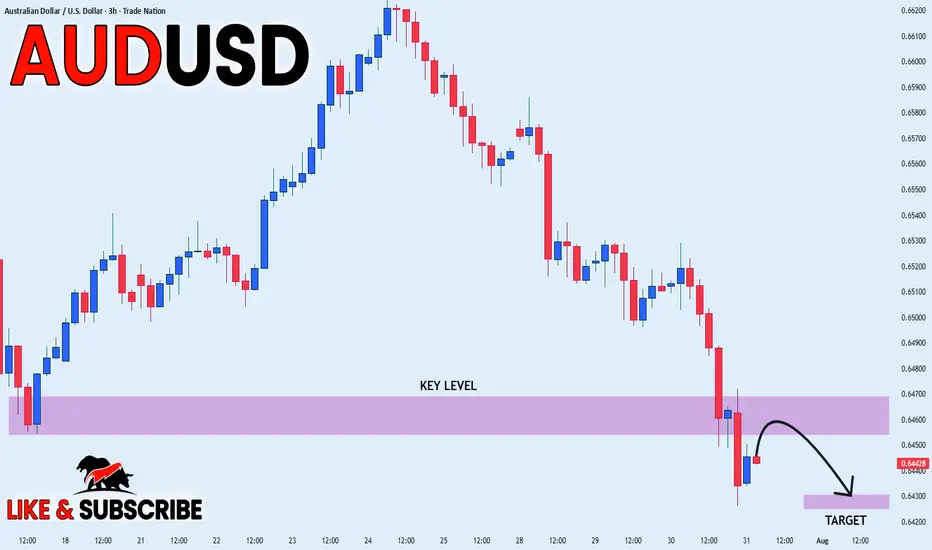
AUD_USD BEARISH BREAKOUT|SHORT|
✅AUD_USD broke the key
Structure level of 0.6460
While trading in an local downtrend
Which makes me bearish
And I think that after the retest of
The broken level is complete
A bearish continuation will follow
SHORT🔥
✅Like and subscribe to never miss a new idea!✅
Disclosure: I am part of Trade Nation's Influencer program and receive a monthly fee for using their TradingView charts in my analysis.
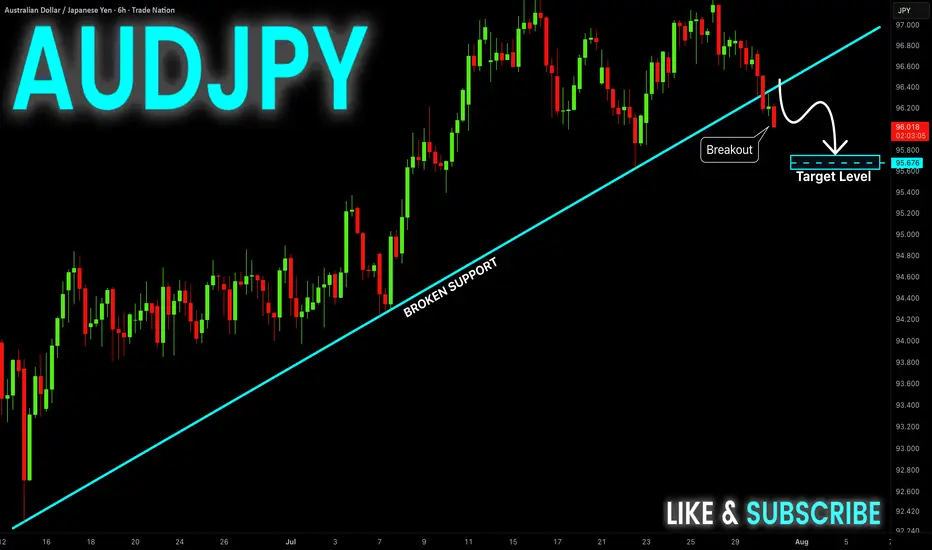
AUD-JPY Bearish Breakout! Sell!
Hello,Traders!
AUD-JPY made a bearish
Breakout of the rising support
Line and we are bearish biased
So we will be expecting a
Further bearish move down
Sell!
Comment and subscribe to help us grow!
Check out other forecasts below too!
Disclosure: I am part of Trade Nation's Influencer program and receive a monthly fee for using their TradingView charts in my analysis.
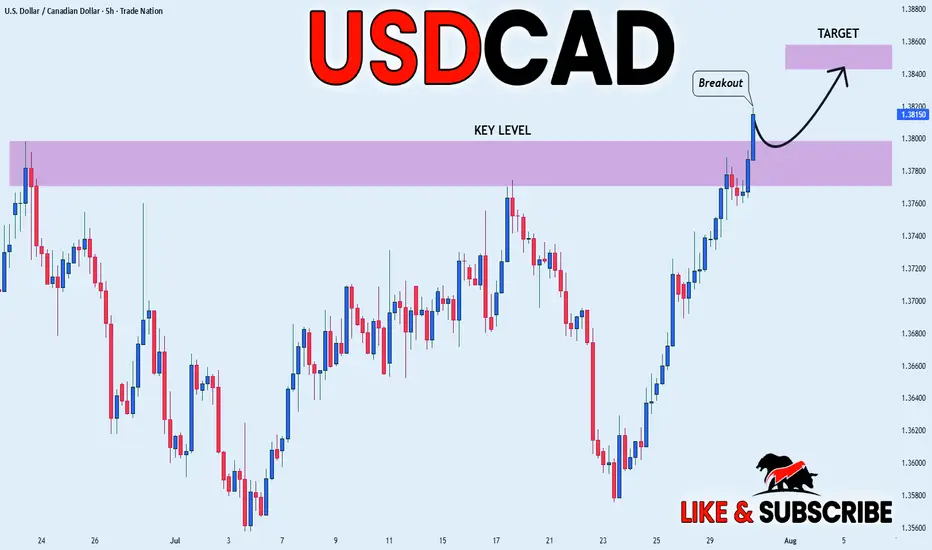
USD_CAD BULLISH BREAKOUT|LONG|
✅USD_CAD is going up
Now and the pair made a bullish
Breakout of the key horizontal
Level of 1.3800 and the breakout
Is confirmed so we are bullish
Biased and we will be expecting
A further bullish move up
LONG🚀
✅Like and subscribe to never miss a new idea!✅
Disclosure: I am part of Trade Nation's Influencer program and receive a monthly fee for using their TradingView charts in my analysis.
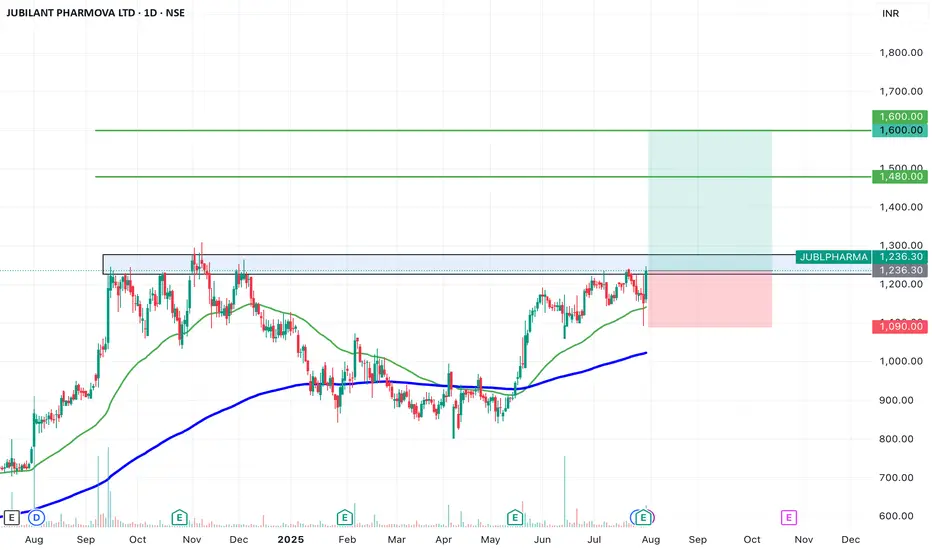
SWING IDEA - JUBILANT PHARMOVAJubilant Pharmova , a diversified pharmaceutical company focused on CRAMS and specialty pharma, is presenting a strong swing opportunity backed by a major pattern breakout and volume confirmation.
Reasons are listed below :
Breakout from an Inverted Head & Shoulders pattern after over a year of consolidation
Attempting breakout above 1250, a key resistance zone with multiple rejections in the past
Strong marubozu candle on the daily chart with a notable volume spike, signaling conviction
Trading near all-time highs, and comfortably above key EMAs, reinforcing trend strength
Target : 1480 // 1600
Stoploss : weekly close below 1090
DISCLAIMER -
Decisions to buy, sell, hold or trade in securities, commodities and other investments involve risk and are best made based on the advice of qualified financial professionals. Any trading in securities or other investments involves a risk of substantial losses. The practice of "Day Trading" involves particularly high risks and can cause you to lose substantial sums of money. Before undertaking any trading program, you should consult a qualified financial professional. Please consider carefully whether such trading is suitable for you in light of your financial condition and ability to bear financial risks. Under no circumstances shall we be liable for any loss or damage you or anyone else incurs as a result of any trading or investment activity that you or anyone else engages in based on any information or material you receive through TradingView or our services.
@visionary.growth.insights
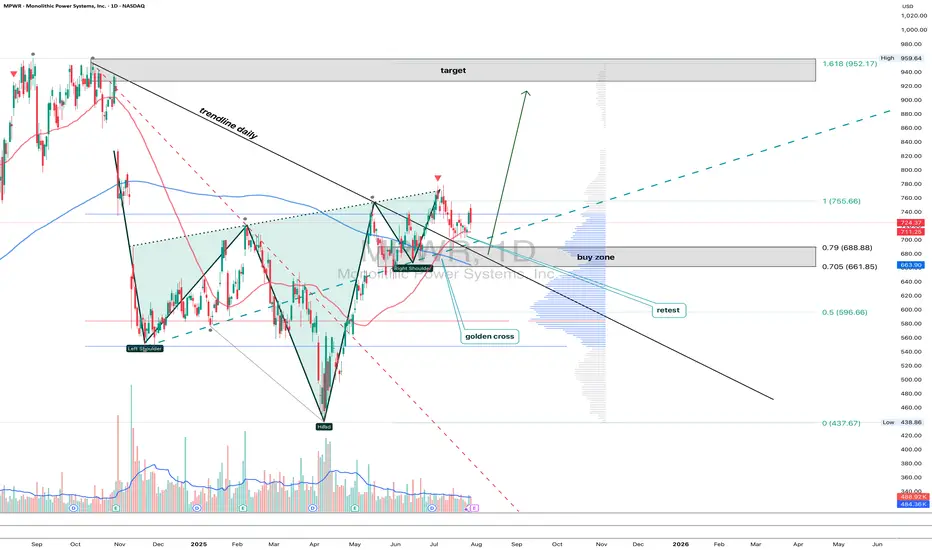
MPWR 1D: shoulders are squared and the battery's still fullMonolithic Power Systems broke out of a long-term descending trendline after completing a clean inverse head and shoulders. Now the price is pulling back into the 705–688 zone — a textbook retest area that combines the neckline, the 0.705–0.79 Fib levels, and a major volume shelf. Add to that a golden cross (EMA50 crossing EMA200 from below) and we have a solid technical foundation for continuation. Volume on the pullback is low, indicating no panic, just rotation. If 688 holds, the next levels to watch are 755.66 and 952.17 — the latter being the 1.618 Fib extension. Tactical setup: look for a reversal signal between 705–688, with a stop just below 661. As long as price holds this zone, the bullish structure remains intact.
Fundamentally, MPWR remains one of the strongest names in the semiconductor space. With over $1.5B in annual revenue and industry-leading margins, the company continues to see strong demand from data center and EV sectors. In its latest report, management highlighted accelerating orders from Tier‑1 manufacturers. The balance sheet is clean, with zero debt, and ongoing buybacks provide downside support. In a sector full of volatility, MPWR stands out with both structural reliability and technical clarity - making it a strong candidate for long-term positioning.
If this textbook pattern plays out, the train’s just leaving the station. The best seat is usually the one taken before the doors close.
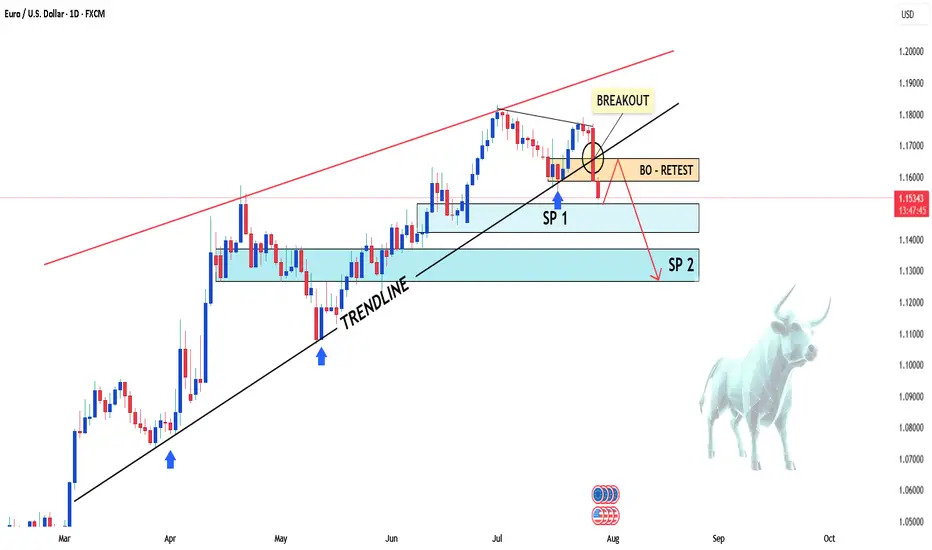
EUR/USD Slips Again – Just a Pullback or More to Come?Hey everyone! Great to have you back for another market chat today.
As of writing, EUR/USD remains under significant bearish pressure, currently trading near 1.154 — marking a rather gloomy start to the new trading week. The euro is clearly struggling to attract buying interest as traders reassess the ECB’s stance and digest the newly announced EU–US trade agreement. Meanwhile, the U.S. dollar is gaining momentum, flipping the trend unexpectedly.
From a technical perspective, EUR/USD is showing clear weakness. The pair has broken below both its rising wedge and previous uptrend line, with candles closing firmly lower — a strong sign that the bears are in control.
In my personal view, I expect EUR/USD to continue sliding toward the next two support zones, although a minor pullback could occur first as part of a typical correction.
But what do you think? Is this just a dip… or the start of something bigger for EUR/USD? Let me know your take in the comments!
GOLD BEARISH BIAS|SHORT|
✅GOLD broke the rising
Support line which is now
A resistance and the price
Is retesting the line now so
We are locally bearish biased
And we will be expecting a
Local move down
SHORT🔥
✅Like and subscribe to never miss a new idea!✅
Disclosure: I am part of Trade Nation's Influencer program and receive a monthly fee for using their TradingView charts in my analysis.
EUR_USD BEARISH BREAKOUT|SHORT|
✅EUR_USD broke the key
Structure level of 1.1580
While trading in an local downtrend
Which makes me bearish
And I think that after the retest of
The broken level is complete
A bearish continuation will follow
SHORT🔥
✅Like and subscribe to never miss a new idea!✅
Disclosure: I am part of Trade Nation's Influencer program and receive a monthly fee for using their TradingView charts in my analysis.
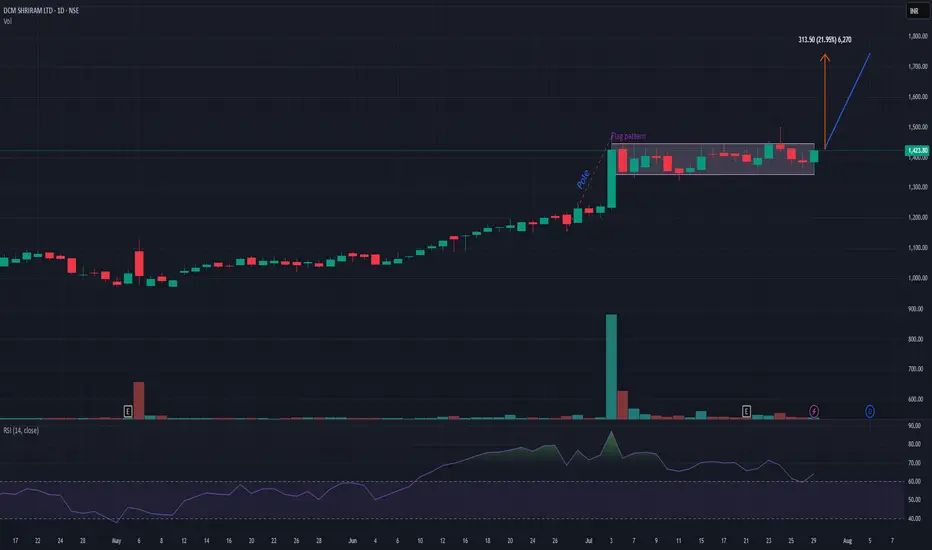
DCMSHRIRAMDCMSHRIRAM is on verge of flag pattern breakout provided that it closes above 1440 level. It has a potential to add up to 20-22% from this level. My view may change if it closes below 1350. Risk-reward is quite in favor. Keep it on radar.
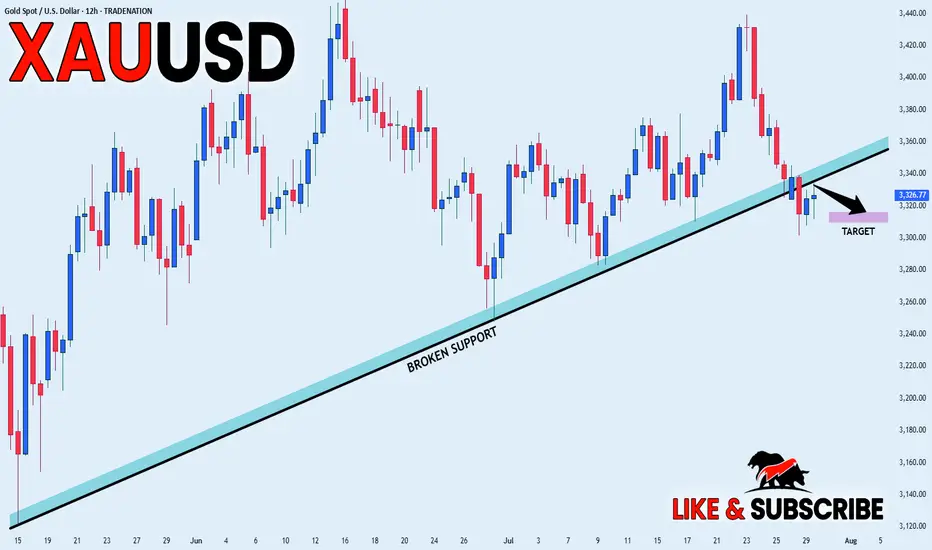
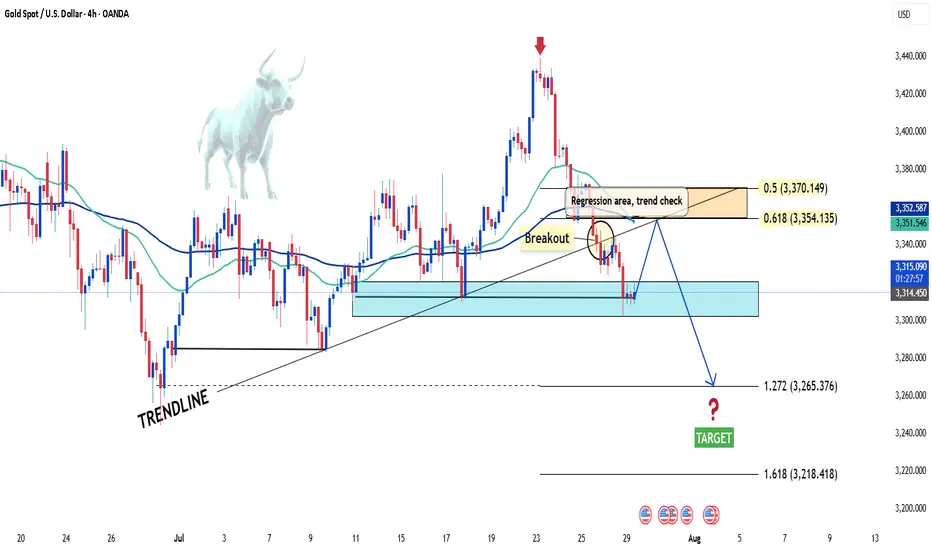
XAUUSD under pressure – Is the downtrend just beginning?Hello everyone! What do you think about XAUUSD right now?
Yesterday, XAUUSD extended its decline and is currently trading around 3,315 USD.
The recent drop in gold prices was mainly triggered by a stronger US dollar, following a trade agreement between the US and the European Union (EU).
From a technical perspective, the short-term outlook shows the beginning of a new downtrend. Notably, we see a bearish crossover in the EMA 34 and 89, along with a break of the previous upward trendline—both reinforcing the current bearish momentum.
If there’s a pullback before the next leg down, the 0.5–0.618 Fibonacci retracement zone (which also aligns with resistance and the EMAs) will be a key area to watch. This could be an ideal level for potential trade setups.
Looking ahead, the next support target is around 3,300 USD. If that level breaks, gold might aim for the 32XX region.
Do you think XAUUSD will continue to fall? Drop your thoughts in the comments!
Wishing you successful and profitable trades!
Bullish Sentiment Returns to Gold?Hello everyone, what are your thoughts on XAUUSD?
From a technical perspective, XAUUSD has just retested its long-term ascending trendline and formed a bullish reaction candle, suggesting that buying pressure may be returning.
Recently, a survey of 206 investors revealed that market sentiment remains optimistic, with 66% expecting gold prices to continue rising, 19% predicting a decline, and 15% anticipating a sideways market.
What do you think? Share your opinion in the comments!

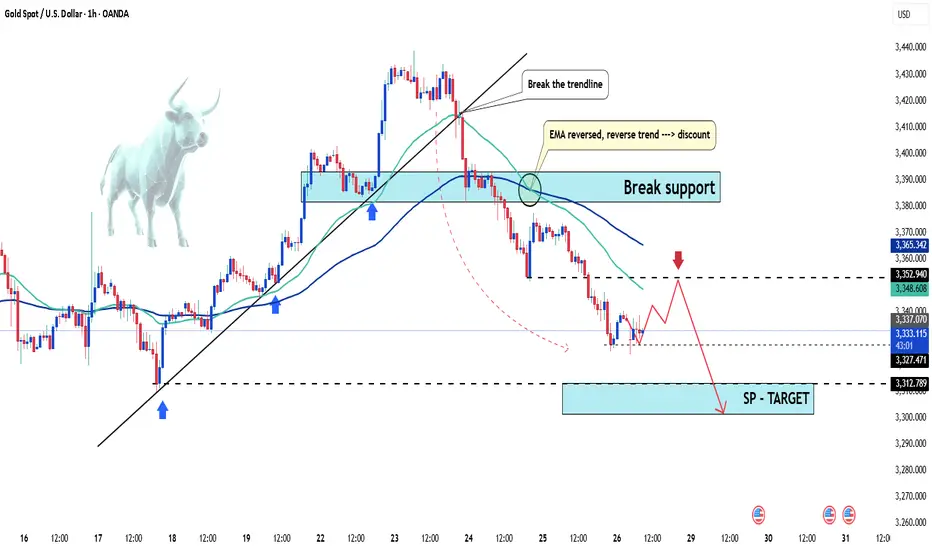
Gold Under Pressure – Temporary Pullback or Start of a DowntrendHello everyone, great to see you again.
Today, let’s focus on the bearish factors surrounding gold. At the time of writing, gold is trading around 3,331 USD, down 50 pips on the day, continuing its downward correction since the end of last week.
Within just a few days, gold has plunged from its peak of 3,433 USD—losing nearly 100 USD per ounce.
This sharp drop is largely driven by profit-taking and market anticipation ahead of key economic data next week, including U.S. interest rate decisions, inflation, and job reports.
This week is packed with critical updates: growth figures, inflation stats, employment numbers, and monetary policy decisions from major central banks—all of which could significantly impact gold’s next move.
According to a recent survey, 36% of analysts expect gold to fall further, while retail investors remain optimistic about a rebound.
For now, the market is clearly in a correction phase. Caution is advised.
What do you think—will gold bounce back or continue to drop?
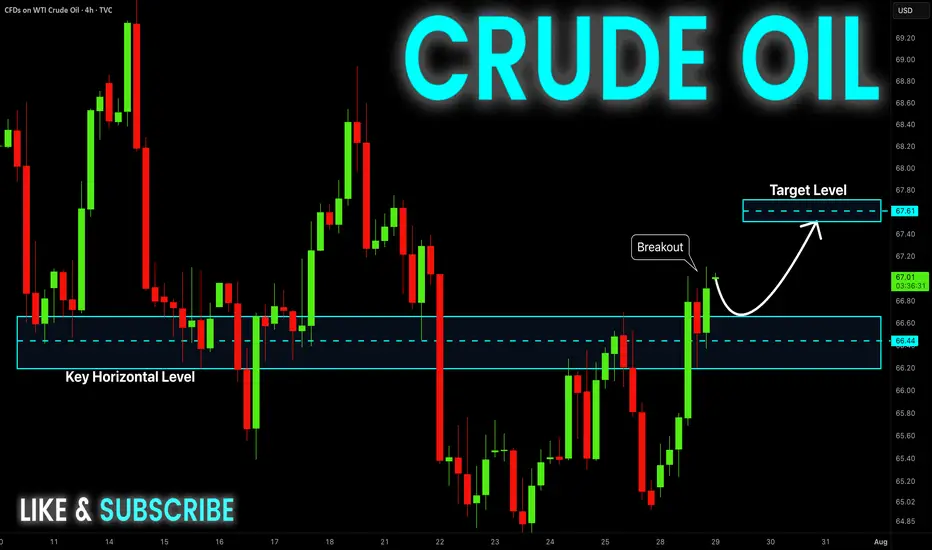
CRUDE OIL Bullish Continuation! Buy!
Hello,Traders!
CRUDE OIL made a rebound
From the support just as
I predicted and the price
Went further still and broke
The key horizontal level
Of 66.50$ and the breakout
Is confirmed so we are
Bullish biased and we will be
Expecting a further bullish
Move up!
Buy!
Comment and subscribe to help us grow!
Check out other forecasts below too!
Disclosure: I am part of Trade Nation's Influencer program and receive a monthly fee for using their TradingView charts in my analysis.
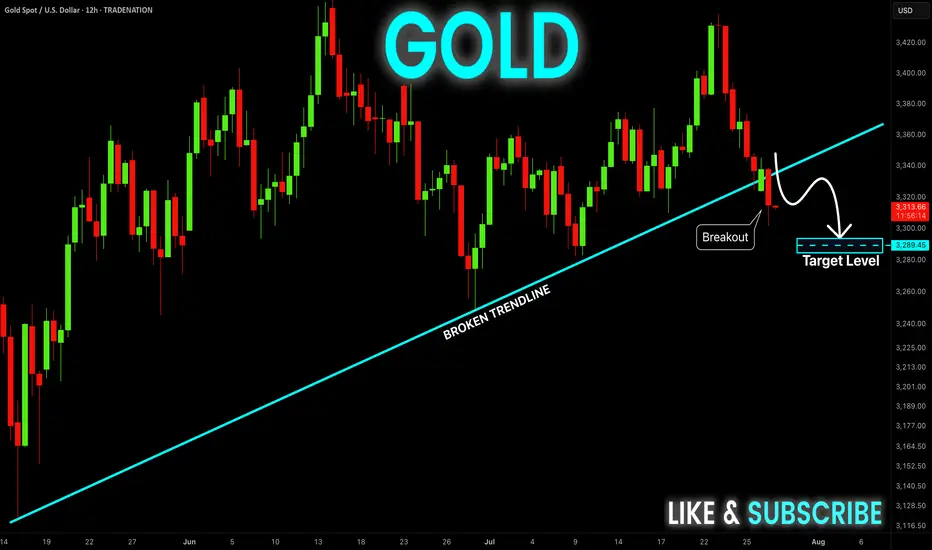
GOLD Epic Trendline Breakout! Sell!
Hello,Traders!
GOLD was trading along
A long-term trend-line but
It is broken now and the
Breakout is confirmed so
We are bearish biased now
And we will be expecting a
Further bearish move down
Sell!
Comment and subscribe to help us grow!
Check out other forecasts below too!
Disclosure: I am part of Trade Nation's Influencer program and receive a monthly fee for using their TradingView charts in my analysis.
GBP_USD BEARISH BREAKOUT|SHORT|
✅GBP_USD is going down currently
As the pair broke the key structure level of 1.3380
Which is now a resistance, and after the pullback
And retest, I think the price will go further down
SHORT🔥
✅Like and subscribe to never miss a new idea!✅
Disclosure: I am part of Trade Nation's Influencer program and receive a monthly fee for using their TradingView charts in my analysis.
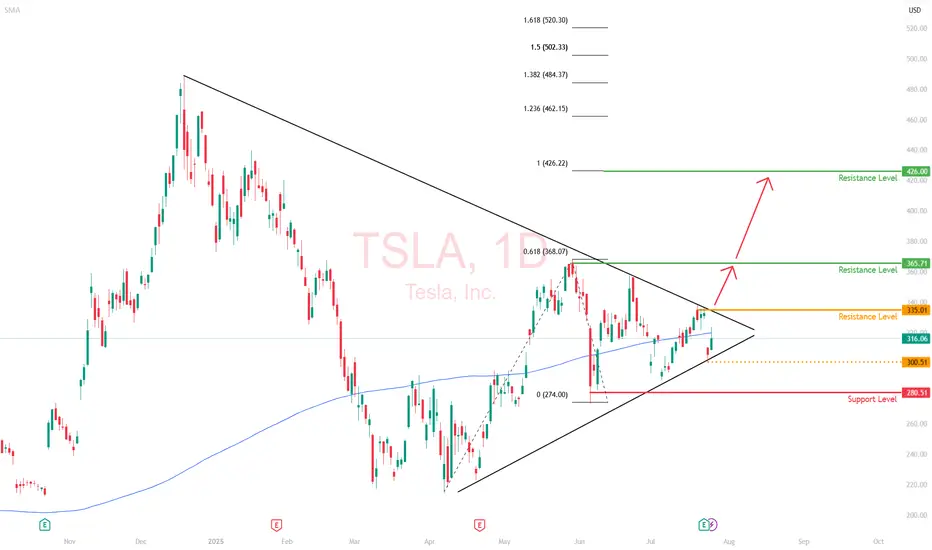
Tesla (TSLA) | Short-Term Compression, Long-Term ExTesla’s daily chart is coiled, with price currently trading at $316, sitting along the 200-day moving average. This looks like a consolidation phase with significant moves building up.
Price Action Snapshot
TSLA sold off last week, rejecting the $335 resistance level before finding footing around $300. The previous range of $280 and $365 is now tightening.
Immediate resistance sits at $335 with a clean breakout above that zone likely triggering momentum back toward the upper range of $365.
The recent drop does not seem like a capitulation move; it's likely institutional redistribution. Smart money is repositioning, not exiting.
Market Is Focused on the Wrong Data
Tesla’s Q2 earnings were objectively weak. Revenue fell 12%, deliveries dropped, and operating margins got clipped.
But this correction isn't all about fundamentals. It is about the market adjusting to a company evolving beyond traditional valuation models.
While most investors are trying to value Tesla like a car company, it’s spending this entire phase retooling itself into an AI and autonomy-first enterprise. That transition doesn't show up in EPS yet (but it will).
The Bigger Picture is Being Missed
The robotaxi rollout in Austin is live. Expansion into California, Phoenix, and Florida is on the roadmap.
Tesla is building a vertically integrated, owner-driven ride-hailing model that could eventually bypass both Uber and legacy OEMs entirely.
Optimus is no longer a lab prototype—it’s moving toward scalable production by 2026.
If Tesla even partially succeeds in general-purpose robotics, it will unlock a Technology Acceptance Model (TAM) that dwarfs the current EV narrative .
Daily Technical Outlook
We’re currently in a bullish compression, with higher lows forming against the resistance area of $365. If $280 holds and the price continues to grind within this wedge, it sets up a volatility breakout scenario.
The breakout level to watch is $335. A daily close above that reopens $365. And beyond that, the resistance level is at $426.
My View
Tesla is compressing, both in price and narrative.
The long game is quietly coming into focus, where the risk/reward skews asymmetrically in favor of the upside.
This daily compression won’t last forever, and when it resolves, the move will likely be outsized.
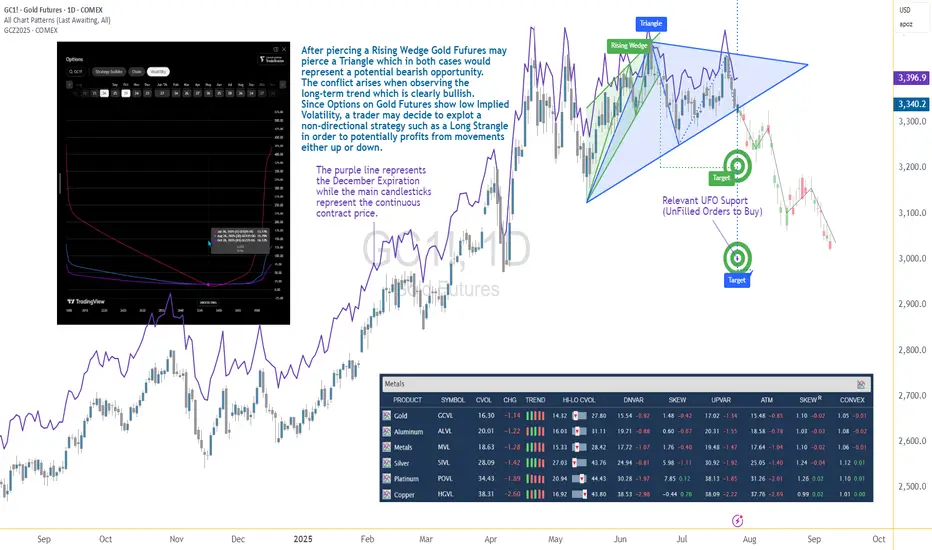
Options Blueprint Series [Intermediate]: Gold Triangle Trap PlayGold’s Volatility Decline Meets a Classic Chart Setup
Gold Futures have been steadily declining after piercing a Rising Wedge on June 20. Now, the market structure reveals the formation of a Triangle pattern nearing its apex — a point often associated with imminent breakouts. While this setup typically signals a continuation or reversal, the direction remains uncertain, and the conflict grows when juxtaposed with the longer-term bullish trajectory Gold has displayed since 2022.
The resulting dilemma for traders is clear: follow the short-term bearish patterns, or respect the dominant uptrend? In situations like these, a non-directional approach may help tackle the uncertainty while defining the risk. This is where a Long Strangle options strategy becomes highly relevant.
Low Volatility Sets the Stage for an Options Play
According to the CME Group’s CVOL Index, Gold’s implied volatility currently trades near the bottom of its 1-year range — hovering just above 14.32, with a 12-month high around 27.80. Historically, such low readings in implied volatility are uncommon and often precede sharp price movements. For options traders, this backdrop suggests one thing: options are potentially underpriced.
Additionally, an IV analysis on the December options chain reveals even more favorable pricing conditions for longer-dated expirations. This creates a compelling opportunity to position using a strategy that benefits from volatility expansion and directional movement.
Structuring the Long Strangle on Gold Futures
A Long Strangle involves buying an Out-of-the-Money (OTM) Call and an OTM Put with the same expiration. The trader benefits if the underlying asset makes a sizable move in either direction before expiration — ideal for a breakout scenario from a compressing Triangle pattern.
In this case, the trade setup uses:
Long 3345 Put (Oct 28 expiration)
Long 3440 Call (Oct 28 expiration)
With Gold Futures (Futures December Expiration) currently trading near $3,392.5, this strangle places both legs approximately 45–50 points away from the current price. The total cost of the strangle is 173.73 points, which defines the maximum risk on the trade.
This structure allows participation in a directional move while remaining neutral on which direction that move may be.
Technical Backdrop and Support Zones
The confluence of chart patterns adds weight to this setup. The initial breakdown from the Rising Wedge in June signaled weakness, and now the Triangle’s potential imminent resolution may extend that move. However, technical traders must remain alert to a false breakdown scenario — especially in trending assets like Gold.
Buy Orders below current price levels show significant buying interest near 3,037.9 (UFO Support), suggesting that if price drops, it may find support and rebound sharply. This adds further justification for a Long Strangle — the market may fall quickly toward that zone or fail and reverse just as violently.
Gold Futures and Micro Gold Futures Contract Specs and Margin Details
Understanding the product’s specifications is crucial before engaging in any options strategy:
🔸 Gold Futures (GC)
Contract Size: 100 troy ounces
Tick Size: 0.10 = $10 per tick
Initial Margin: ~$15,000 (varies by broker and volatility)
🔸 Micro Gold Futures (MGC)
Contract Size: 10 troy ounces
Tick Size: 0.10 = $1 per tick
Initial Margin: ~$1,500
The options strategy discussed here is based on the standard Gold Futures (GC), but micro-sized versions could be explored by traders with lower capital exposure preferences.
The Trade Plan: Long Strangle on Gold Futures
Here's how the trade comes together:
Strategy: Long Strangle using Gold Futures options
Direction: Non-directional
Instruments:
Buy 3440 Call (Oct 28)
Buy 3345 Put (Oct 28)
Premium Paid: $173.73 (per full-size GC contract)
Max Risk: Limited to premium paid
Breakeven Points on Expiration:
Upper Breakeven: 3440 + 1.7373 = 3613.73
Lower Breakeven: 3345 – 1.7373 = 3171.27
Reward Potential: Unlimited above breakeven on the upside, substantial below breakeven on the downside
R/R Profile: Defined risk, asymmetric potential reward
This setup thrives on movement. Whether Gold rallies or plunges, the trader benefits if price breaks and sustains beyond breakeven levels by expiration.
Risk Management Matters More Than Ever
The strength of a Long Strangle lies in its predefined risk and unlimited reward potential, but that doesn’t mean the position is immune to pitfalls. Movement is key — and time decay (theta) begins to erode the premium paid with each passing day.
Here are a few key considerations:
Stop-loss is optional, as max loss is predefined.
Precise entry timing increases the likelihood of capturing breakout moves before theta becomes too damaging. Same for exit.
Strike selection should always balance affordability and distance to breakeven.
Avoid overexposure, especially in low volatility environments that can lull traders into overtrading due to the potentially “cheap” options.
Using strategies like this within a broader portfolio should always come with well-structured risk limits and position sizing protocols.
When charting futures, the data provided could be delayed. Traders working with the ticker symbols discussed in this idea may prefer to use CME Group real-time data plan on TradingView: tradingview.sweetlogin.com - This consideration is particularly important for shorter-term traders, whereas it may be less critical for those focused on longer-term trading strategies.
General Disclaimer:
The trade ideas presented herein are solely for illustrative purposes forming a part of a case study intended to demonstrate key principles in risk management within the context of the specific market scenarios discussed. These ideas are not to be interpreted as investment recommendations or financial advice. They do not endorse or promote any specific trading strategies, financial products, or services. The information provided is based on data believed to be reliable; however, its accuracy or completeness cannot be guaranteed. Trading in financial markets involves risks, including the potential loss of principal. Each individual should conduct their own research and consult with professional financial advisors before making any investment decisions. The author or publisher of this content bears no responsibility for any actions taken based on the information provided or for any resultant financial or other losses.
Gold under pressure as USD strengthensGold is facing significant selling pressure as the US dollar regains momentum. Currently, XAU/USD is trading near $3,337, down over $31 from the session high, and pressing directly against the ascending trendline.
The stronger USD is making gold—an asset that yields no interest—less attractive to investors. If this dollar strength continues, the likelihood of a trendline break and further downside is very high.
On the economic front, U.S. jobless claims have fallen to their lowest level in three months, signaling a resilient labor market despite sluggish hiring. This stable jobs data is expected to support the Fed’s decision to hold interest rates steady at 4.25–4.50% in the upcoming policy meeting, even amid rising inflation pressure driven by President Donald Trump’s tariff policies.
At this moment, sellers are in control. Traders should closely watch upcoming support zones and trading volume to spot reasonable entry points.
Good luck!

SEI — Breakout & D1 OB Target1. Support 0.33–0.36 holding
2. Entry after SR breakout
3. Target: D1 OB 0.47–0.54
4. Stop below 0.33

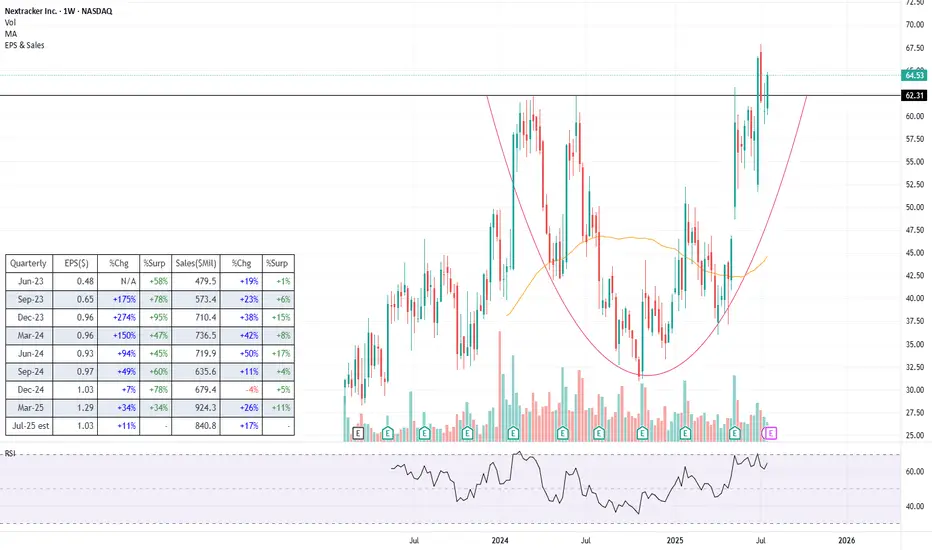
NXT (Long) - Clean energy player with even cleaner financialsLet's preamble with what the company actually does (as I imagine a lot of traders trade without even bothering... understandably). In short, Nextracker operates in the solar energy space where it is a leader in providing energy output optimization solutions, i.e. mechanical systems that rotate solar panels to follow the sun, along with software (TrueCapture) that uses sensors and machine learning to fine-tune positioning in real time.
Fundamentals
NASDAQ:NXT has been growing very strongly in recent years (see the table) despite the numerous hiccups this space has seen since 2022. There is also a backlog of $4.5bn , giving us clear visibility into the next year. Profitability is strong with earnings growth even outpacing revenue growth, showing strong operating leverage .
This all comes on the back of a relatively cheap valuation , with P/E of just below 18, which is significantly lower than some of its competitors like NYSE:NVT at 52, and NYSE:RRX at 43. No clear reason for why the markets are discounting the stock.
The balance sheet is rock solid , with no debt and $766m in cash. Moreover, free cash flow is plentiful with the firm most recently generating $622m in FCF.
Overall, the company is growing, has strong financials and is cheaply valued compared to its competitors - the kind of smoothie I usually look for. One obvious risk is policy , given that the current administration doesn't really see eye to eye with renewables and two thirds of NXT's revenue still comes from the US.
Technicals
Just breaking into an all-time high is a nice-to-have advantage when entering a new trade. The stock is breaking out from a decent, almost year-and-half long base , though I would prefer the base to be a tad more prolongated.
The stock broke the ATH on higher volume, pulled back to around the breakout point and is currently establishing the next leg higher
The price is some distance away from its moving averages, so there is a chance that there still might be some more consolidation around this level before we proceed higher
Trade
Main caveat is that the stock is about to release its earnings on Tuesday , so naturally it is a slight gamble to buy ahead of it. I decided to jump in beforehand just because I have strong conviction (and I love to punch the wall when I always get it wrong), but I would advise others to first wait on the results as a potential catalyst.
For gamblers like myself, the ATH breakout point likely serves as the best possible stoploss (black line).
One more reason why these earnings in particular could be even more of a gamble is that the BBB bill was passed since the last earnings, so if the executives decide to sprinkle the release with some not-so-positive comments regarding that, it could spook investors.
Follow me for more analysis & Feel free to ask any questions you have, I am happy to help
If you like my content, please leave a like, comment or a donation , it motivates me to keep producing ideas, thank you :)