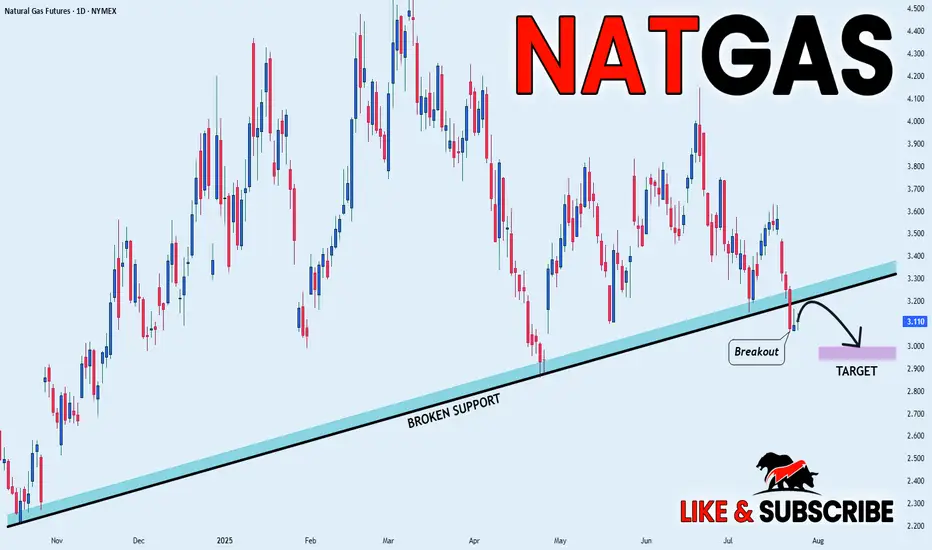
NATGAS BEARISH BREAKOUT|SHORT|
✅NATGAS broke the rising support
While trading in an local downtrend
Which makes me bearish
And I think that after the retest of the broken line is complete
A rebound and bearish continuation will follow
SHORT🔥
✅Like and subscribe to never miss a new idea!✅
Disclosure: I am part of Trade Nation's Influencer program and receive a monthly fee for using their TradingView charts in my analysis.
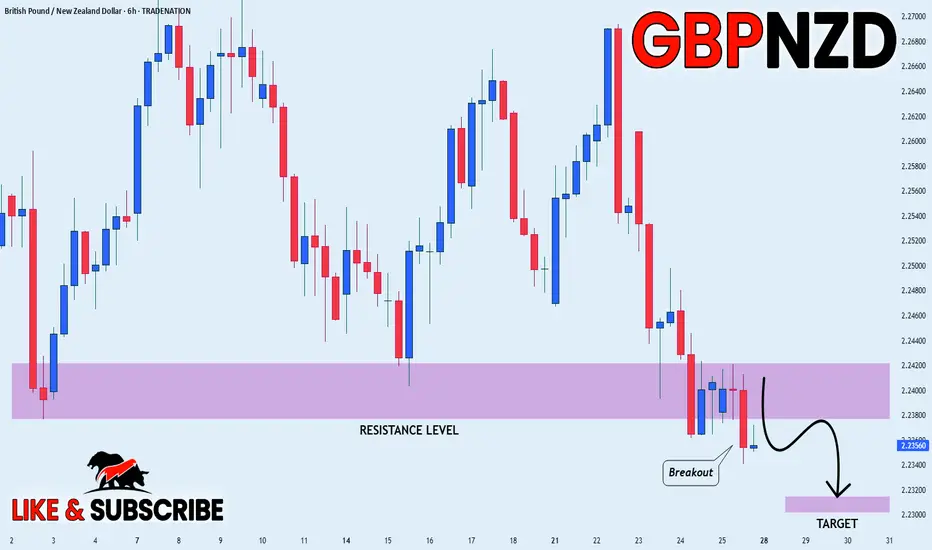
Breakout
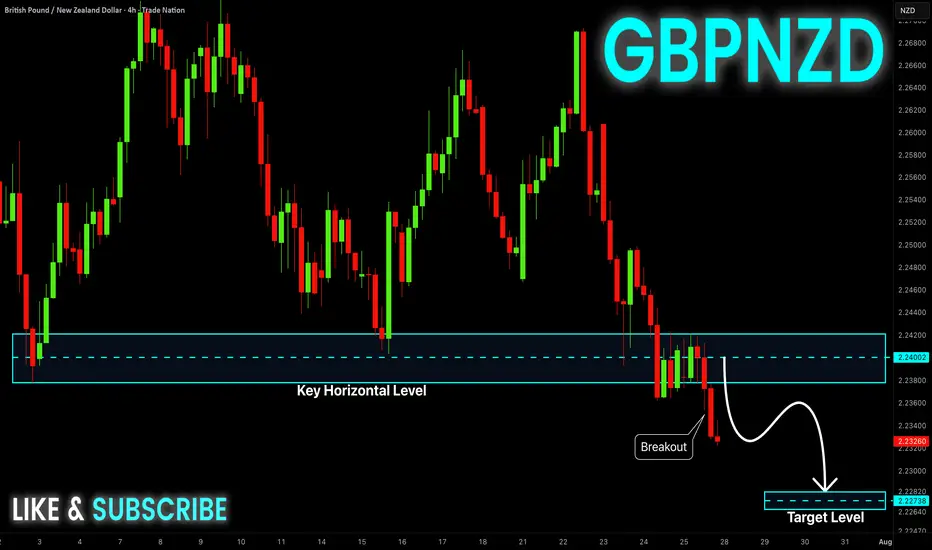
GBP-NZD Will Keep Falling! Sell!
Hello,Traders!
GBP-NZD keeps falling down
And the pair made a strong
Bearish breakout of the key
Horizontal key level of 2.2400
And the breakout is confirmed
So we are bearish biased and
We will be expecting a further
Bearish move down on Monday
Sell!
Comment and subscribe to help us grow!
Check out other forecasts below too!
Disclosure: I am part of Trade Nation's Influencer program and receive a monthly fee for using their TradingView charts in my analysis.
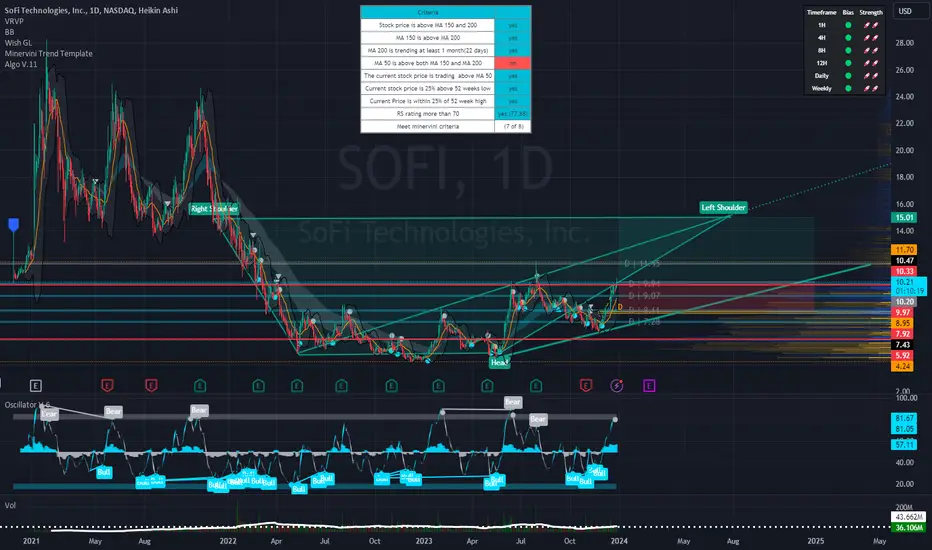
SoFi's Surge: Unveiling 2023 and What Lies Ahead in 2024Technical Analysis Overview
Current Price : $10.34, a 3.77% increase.
Weekly Trend : Showing a positive trend with a 5.35% increase over the last five days.
1-Month Trend : A significant increase of 51.96%, indicating strong bullish sentiment.
6-Month and Yearly Trends : A 17.04% increase over the last six months and a 124.51% increase year to date, highlighting a robust bullish trend.
Advanced Technical Indicators
Relative Strength Index (RSI) : 70.41 - Indicating that SOFI is nearing overbought territory, which could lead to a potential reversal or consolidation in the short term.
Moving Average Convergence Divergence (MACD) : 0.63 - Suggesting bullish momentum, indicating a strong buying trend.
Other Indicators : STOCH (83.28), STOCHRSI (84.02), ADX (37.09), Williams %R (-8.57), CCI (104.63), ATR (0.46), Ultimate Oscillator (54.76), and ROC (24.66) all contribute to a picture of current bullish momentum but with potential for short-term volatility or pullback.
Market Sentiment and External Factors
Market Capitalization : $9.904B USD.
Trading Volume Analysis : A high trading volume of 35,199,288, suggesting active market participation and interest in the stock.
Recent News Coverage Impacting SOFI
Bullish Outlook for 2024 : Analysts predict SOFI stock could continue its rally in the new year, benefiting from expected interest-rate cuts. A notable analyst has set a high price target of $14 for SOFI stock, implying significant upside potential ( InvestorPlace ).
Focus on Non-Lending Businesses : Analysts appreciate SoFi's shift towards non-lending businesses, improving earnings quality despite a higher-for-longer interest-rate policy.
Central Bank Policy Changes : Potential interest rate cuts in 2024 could benefit SoFi's lending business, as lower rates tend to spur borrowing and lending activity.
Conclusion
SOFI's stock shows strong bullish signs in the medium to long term, but the current overbought condition warrants caution for short-term traders.
The recent news and analyst predictions provide a positive outlook for 2024, making SOFI an interesting stock for both traders and long-term investors.
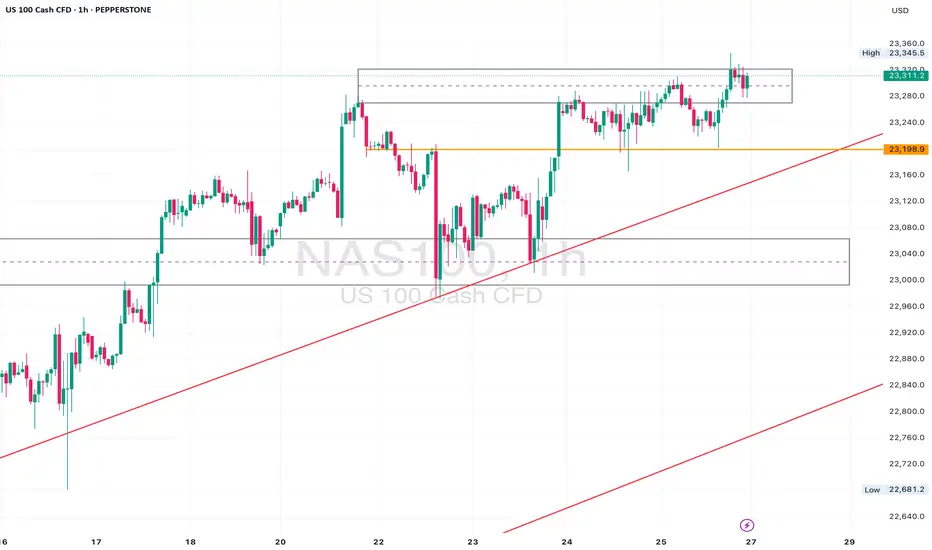
NAS100 Retesting Breakout – Eyes on 23170 for Bullish PushDaily Analysis:
Price is testing the upper boundary of the long-term ascending channel. Structure is still bullish with no major breaks of support. If momentum holds, we could extend toward the channel top.
4H Analysis:
Retesting breakout structure. Support is forming around 23000–23050. Bullish momentum remains valid unless price closes below this zone.
1H Analysis:
Micro-breakout confirmed with bullish impulse above 23120. If 23170 holds, continuation toward 23280–23320 is likely.
Confirmation & Entry:
Watch for continuation above 23170. SL below 23080. TP: 23280+
Use caution if 23000 breaks — this would weaken short-term bias.
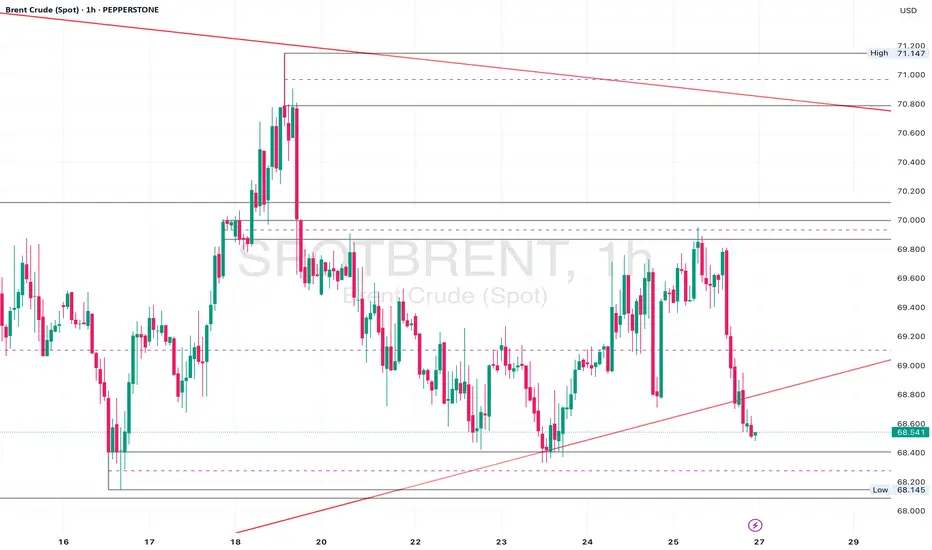
Brent Crude Sitting at Key Support – 69.20 Hold for a Rebound?Daily Analysis:
Price is holding above the ascending trendline and forming higher lows. Multiple rejections from the 68.00 region suggest strong demand. As long as we remain above the trendline, bulls stay in control.
4H Analysis:
Pullback after rejecting 71.00. Now sitting inside the 69.60–69.20 demand area. Bullish channel is still valid unless we break below 68.50.
1H Analysis:
Price broke the rising channel but is now hovering near key support. Bullish re-entry possible if lower timeframe aligns around 69.60.
Confirmation & Entry:
If we see bullish engulfing or pin bar at 69.60–69.20, this could signal a long setup back to 71.00. Invalidated on clean break below 68.50.
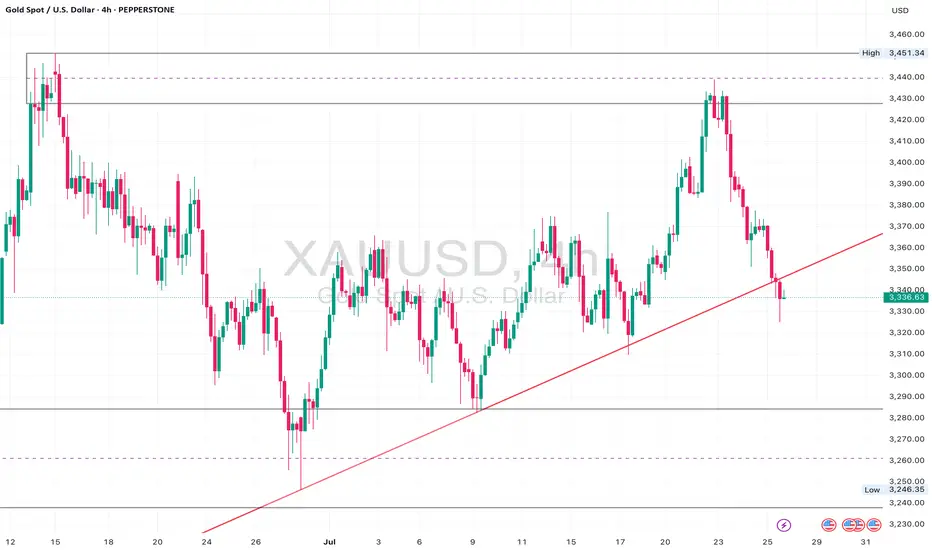
Gold Approaching 3365 Breakout: Bullish Continuation Above TrendDaily Analysis:
Price is respecting the long-term trendline support and still holding firmly above the 3300 region. Bulls are defending structure with a clean series of higher lows. No major change in trend as long as price remains above 3246.
4H Analysis:
Price is consolidating above the trendline and building structure around 3350. A clean break and close above 3365 could ignite a push toward the 3450 supply zone.
1H Analysis:
Descending trendline break confirmed with bullish closure. Retest holding well above 3350. If structure remains intact, next short-term target is 3375–3390.
Confirmation & Entry:
Break and close above 3365 with strong bullish candle = confirmation. Optional entry on 3350–3355 retest. Targets: 3390, 3450.
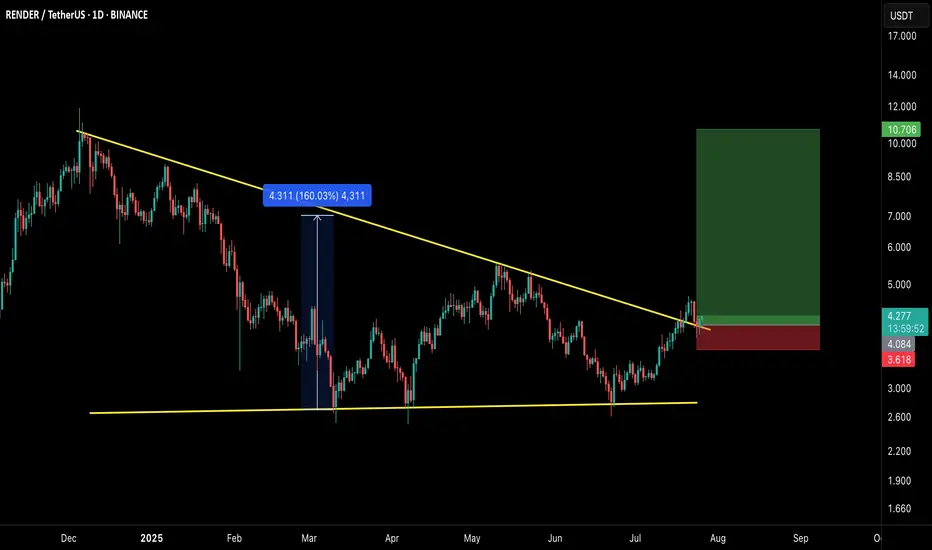
$RNDR/USDT – Breakout Setup Alert!RNDR has officially broken out of the long-standing descending trendline, confirming a bullish reversal structure. This breakout comes after a sustained consolidation phase and successful retest, indicating strength in buyer momentum.
🔍 Technical Breakdown:
Descending triangle breakout confirmed
Previous breakout from similar structure yielded a massive 160% rally
Currently retesting the breakout zone, providing a high R:R long entry opportunity
Clear invalidation point below the recent local support
🟢 LONG Setup:
Entry Zone: $4.00–$4.30
Stop Loss: $3.60 (below breakout retest & structure)
Targets:
TP1: $6.00
TP2: $8.00
TP3: $10.70+ (full breakout projection zone)
🧠 Strategy Insight:
This setup aligns with a broader bullish market structure across multiple altcoins. If momentum continues, this could mirror the prior explosive leg. Always manage risk accordingly.
⚠️ This is not financial advice. DYOR and use proper risk management.
💬 Let me know your thoughts or if you’re riding this wave!
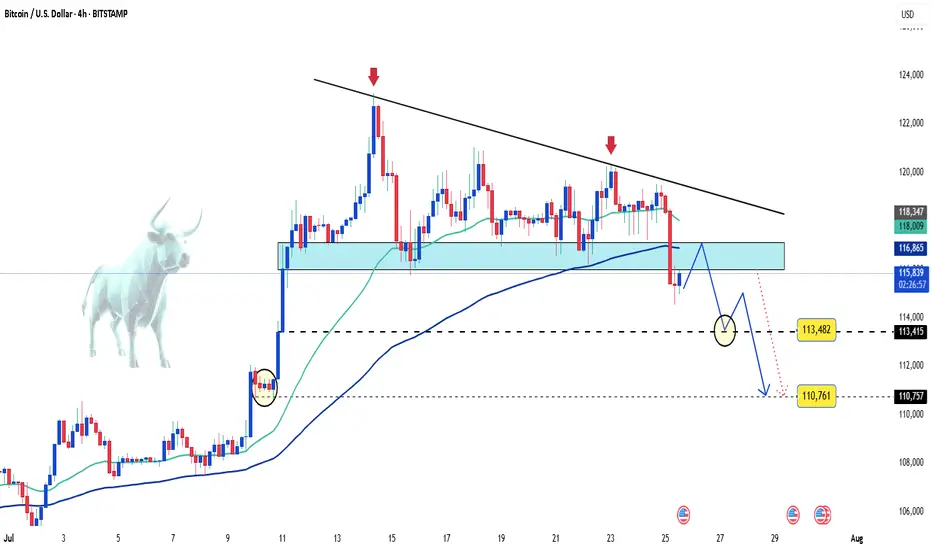
Bitcoin on the edge – Is a sharp drop coming?Bitcoin is keeping investors on edge as price action remains volatile and primed for an explosive move once news or capital flows ignite the market.
🌍 Latest market updates:
– Whales are back in accumulation mode, with on-chain data showing large wallets growing rapidly.
– The U.S. government has just transferred a significant amount of BTC to exchanges — is a dump coming?
– U.S. spot Bitcoin ETFs are witnessing record inflows after CPI came in lower than expected, fueling hopes that the Fed will pause further rate hikes this year.
📉 Technical outlook:
– On the H4 chart, BTC formed a tightening wedge pattern, which has now broken to the downside.
– A steep drop toward the 113,000 to 110,000 USD zone is entirely possible.
This looks like a classic break-retest setup — a golden window for strategic entries. If sell volume surges, it could be the perfect moment for bears to strike.
Stay sharp — and good luck!
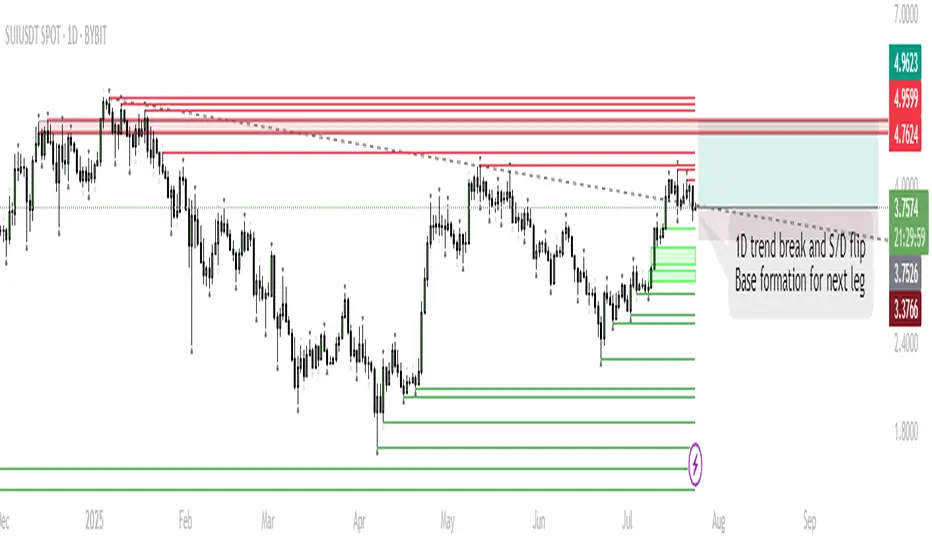
SUI – Base Formation for Next Leg HigherTrend Shift:
SUI has broken the 1D downtrend and is now consolidating above a key supply/demand zone, suggesting accumulation.
Short-Term Range:
Expect ranging/chop as price tests acceptance above broken resistance. This phase could last up to a week.
Trigger for Next Move:
Sustained closes above $4.0 will signal buyers are in control, opening the way for a move higher.
Targets:
If the base holds and SUI establishes above resistance, the next push is toward $5.10–$5.40 (previous highs/ATH zone).
Invalidation:
A sustained move below $3.37 would invalidate the bullish base thesis and open the door for deeper retrace.
SUI has flipped its 1D trend and is now consolidating above a key S/D level. Historically, such consolidations above reclaimed resistance often precede strong trend continuation. While a short-term range is likely as the market digests recent gains, the structure favors an eventual push toward previous highs and potentially new ATHs in August. Patience during this ranging phase is key; the setup remains bullish unless price falls back below $3.37.
GBP_NZD BEARISH BREAKOUT|SHORT|
✅GBP_NZD is going down currently
As the pair broke the key structure level of 2.2400
Which is now a resistance, and after the pullback
And retest, I think the price will go further down
SHORT🔥
✅Like and subscribe to never miss a new idea!✅
Disclosure: I am part of Trade Nation's Influencer program and receive a monthly fee for using their TradingView charts in my analysis.
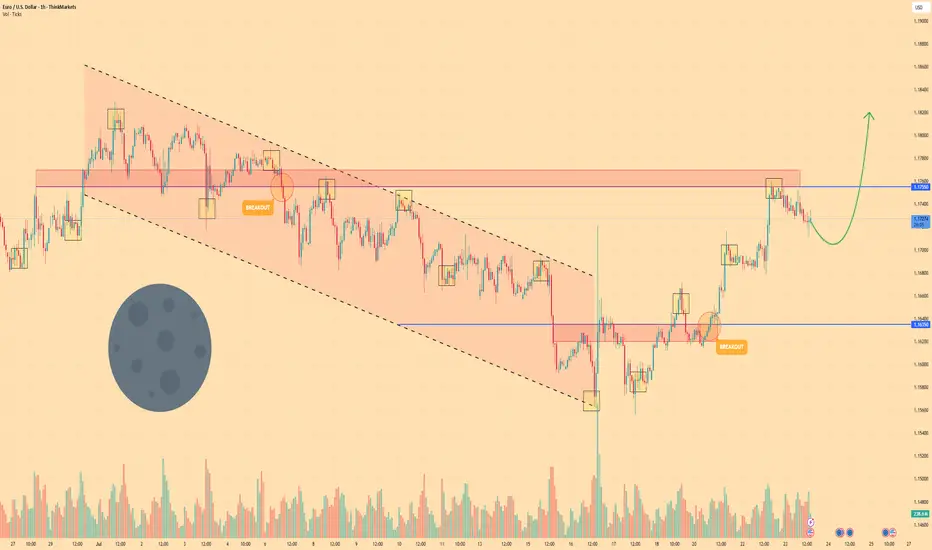
Euro may reach resistance level, break it and continue to growHi guys, this is my overview for EURUSD, feel free to check it and write your feedback in comments👊
For an extended period, the price was dictated by a descending channel, with each rally attempt failing at its upper boundary.
The downward trend culminated in a test of the crucial support level at $1.1635, where sellers were unable to secure a foothold, signaling a potential momentum shift.
This shift was confirmed when buyers took control, launching an upward impulse that decisively breached the long-standing resistance of the channel's upper trendline.
After the breakout, the price established a new local support base above the former channel, solidifying the change in market structure.
The subsequent rally carried the asset's price to the significant horizontal resistance zone around $1.1755, where the upward advance has temporarily stalled.
I expect that after a brief consolidation, bullish pressure will resume, enabling the price to break the $1.1755 barrier and continue towards the $1.1820 target.
If this post is useful to you, you can support me with like/boost and advice in comments❤️
Disclaimer: As part of ThinkMarkets’ Influencer Program, I am sponsored to share and publish their charts in my analysis.
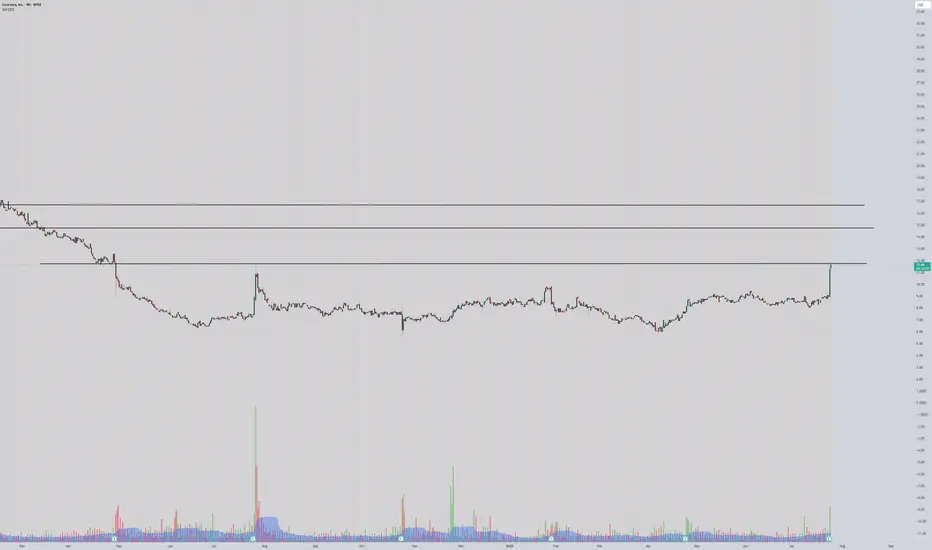
COUR ready to launch?Incredible chart and breakout approaching,
Above $12 we can see $16 in a few months, This can be a great addition to the long term account!
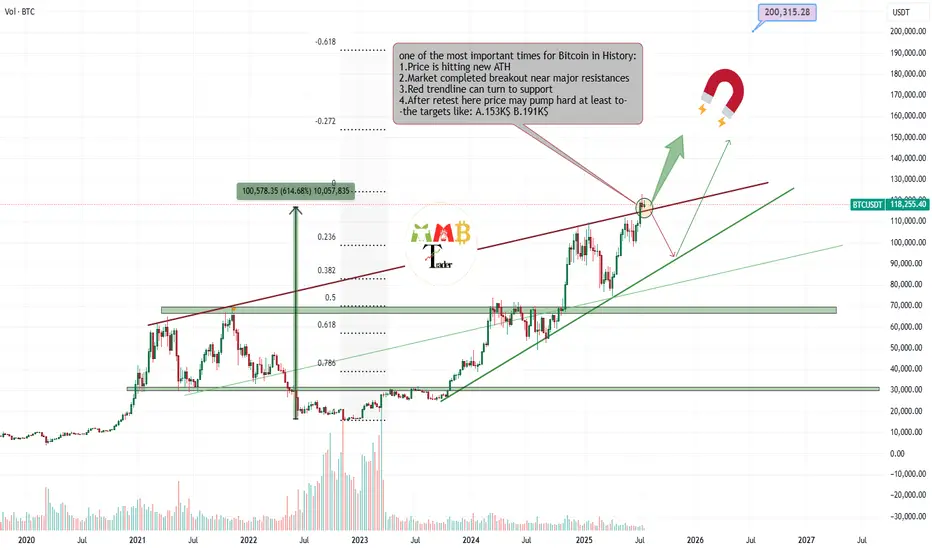
Bitcoin is retesting Critical zone for targeting almost 200K$Most traders around world now don't know what to do with their own trades or spot holdings, because some are in profit and how doubt of more pump and are still holding and some others miss this massive pump and think it can rest and fall now and it is not a good time to enter long.
And many other questions and thoughts At this time is simply check the chart and do these simple steps which are some mentioned and some not due to huge content.
Delete all of my previous drawings and start new Charting the price and see new trendlines or supports and resistances formed.
Then technically check the volume and breakouts and ... once again and here for Bitcoin i still find out chart looks extremely bullish to me and at this orange zone which is price is getting a little slow some important things may happen.
30% is expecting price fall below red trendline again and see short-term fall.
70% is expecting price complete retest of breakout here or pump more ASAP and then hitting targes like 150K$ and more for $BTCUSDT.
DISCLAIMER: ((trade based on your own decision))
<<press like👍 if you enjoy💚
Channel BreakoutThe Stock has given a channel breakout in April. It is currently in accumulation phase. Buy for the targets seen in the chart. Use a 1:3 risk reward ratio.

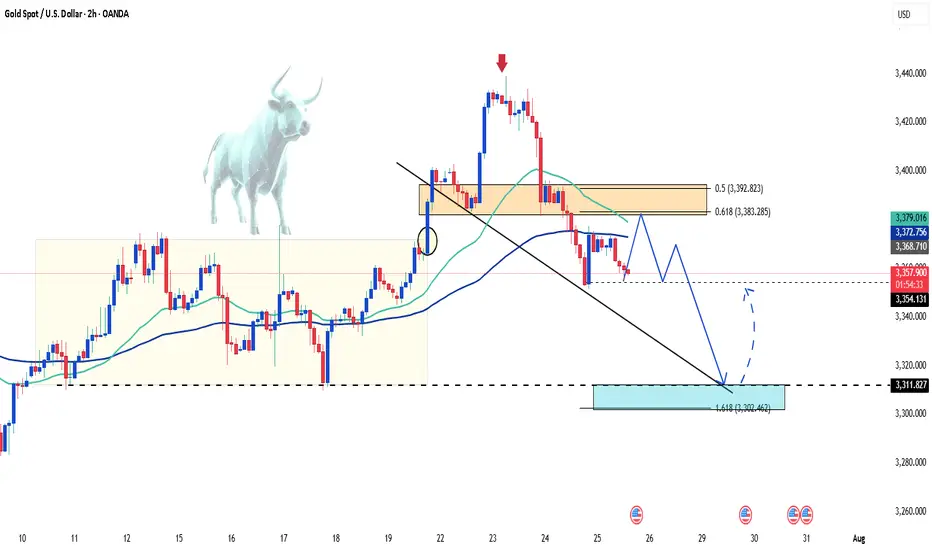
Gold dips on profit-taking, long-term outlook still bullishGold prices continued to decline this morning as investors locked in profits following the precious metal’s recent rally above $3,400.
In the short term, further downside is possible if profit-taking persists and capital flows shift toward equities, especially as U.S. stock markets hover near record highs. However, gold remains a favored safe-haven asset for the long run amid ongoing global economic and geopolitical uncertainties.
Markets are also turning their focus to the upcoming Federal Reserve policy meeting on July 29–30. While the Fed is expected to hold interest rates steady this time, many investors still anticipate a potential rate cut in September. A low interest rate environment typically supports non-yielding assets like gold.
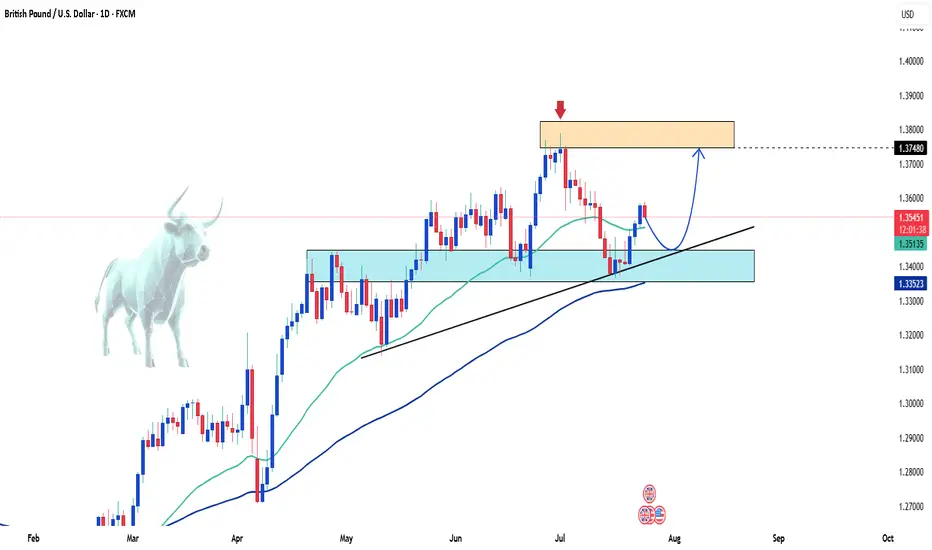
GBPUSD Rebounds Strongly – Is the Uptrend Ready to Resume?Hello traders!
On the D1 chart, GBPUSD is showing a strong recovery after bouncing off the support zone around 1.33500–1.34500. This rebound happened right at the ascending trendline and the confluence with the EMA, reinforcing the strength of the bullish zone.
The overall bullish structure remains intact. As long as price stays above the trendline, I expect GBPUSD to continue its move toward the resistance area near the recent highs.
My strategy is to look for buying opportunities around the support zone or after a confirmation signal from price action following a minor pullback.
Good luck and happy trading!
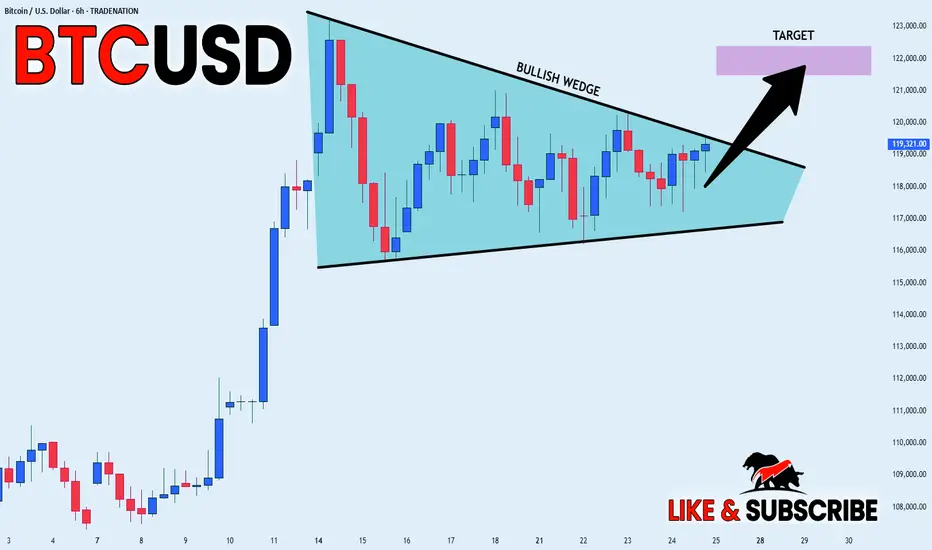
BITCOIN BULLISH WEDGE|LONG|
✅BITCOIN is trading in a
Strong uptrend and the coin
Has formed a massive bullish
Wedge pattern so we are
Bullish biased and IF we see
A bullish breakout we will
Be expecting a further
Bullish move up
LONG🚀
✅Like and subscribe to never miss a new idea!✅
Disclosure: I am part of Trade Nation's Influencer program and receive a monthly fee for using their TradingView charts in my analysis.
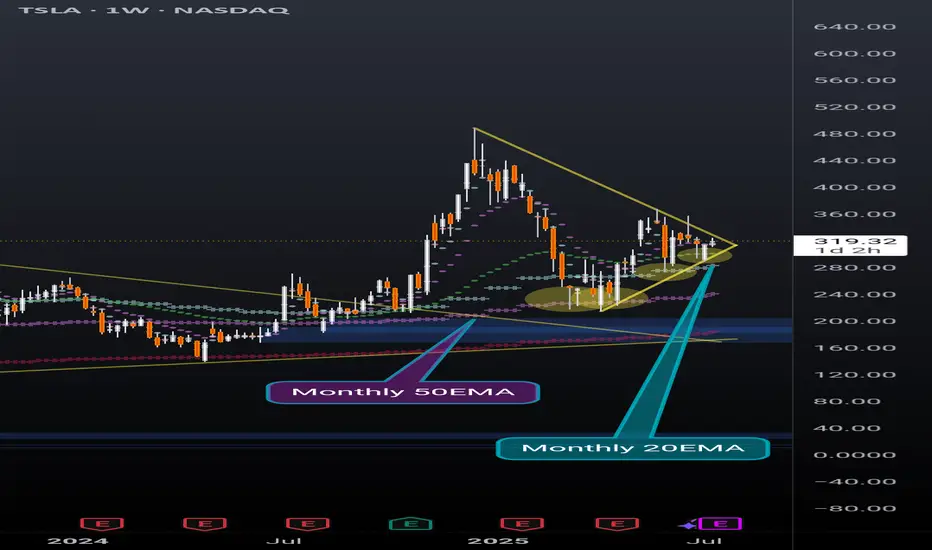
TSLA weekly coiling into something powerfulNever doubt the power of TSLA. Recently broke out of a huge pennant, and now nearing the end of another pennant while simultaneously holding support above the daily 20EMA(overlayed on this weekly chart).
Also recently found support off of the monthly 20EMA (overlayed on this weekly chart) and took 2 direct hits on the monthly 50EMA (overlayed on this weekly chart) before that and rallied up. It will take a lot to crush this setup but anything can happen. Possibly a longer pennant formation.
I'm just a cat not a financial advisor.
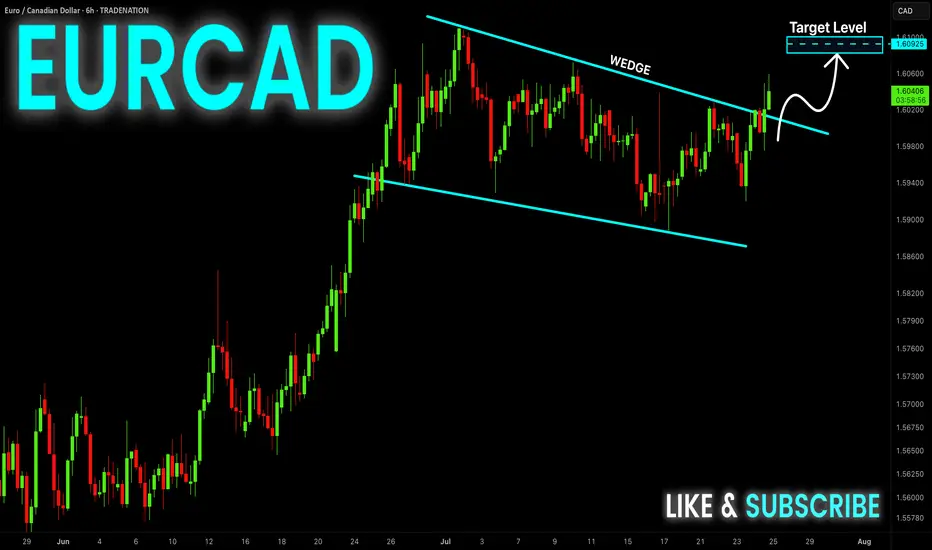
EUR-CAD Bullish Wedge! Buy!
Hello,Traders!
EUR-CAD is trading in an
Uptrend and the pair formed
A bullish wedge pattern and
Now we are seeing a bullish
Breakout from the wedge so
We are bullish biased and we
Will be expecting a further
Bullish move up
Buy!
Comment and subscribe to help us grow!
Check out other forecasts below too!
Disclosure: I am part of Trade Nation's Influencer program and receive a monthly fee for using their TradingView charts in my analysis.
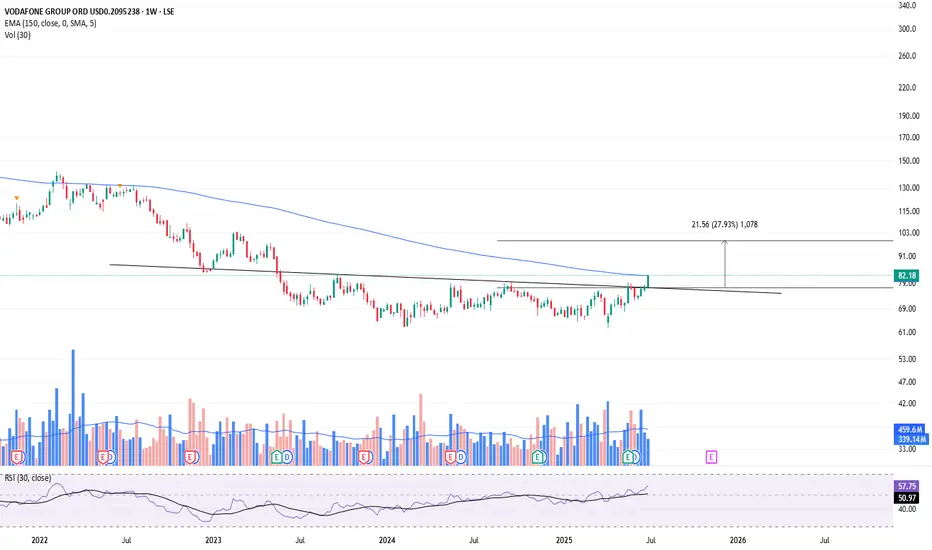
Breakout on Vodafone?Looks like a Head and shoulders reversal, plus breakout this week. Too early to say though as it still needs confirmation. Could still be a fake-out?
This is not a solicitation to trade in Vodafone shares.
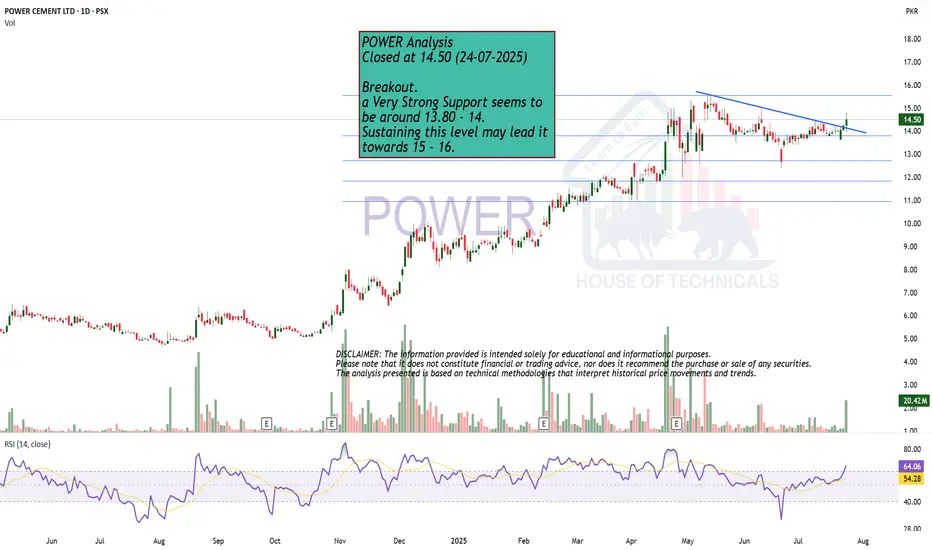
Breakout.POWER Analysis
Closed at 14.50 (24-07-2025)
Breakout.
a Very Strong Support seems to
be around 13.80 - 14.
Sustaining this level may lead it
towards 15 - 16.
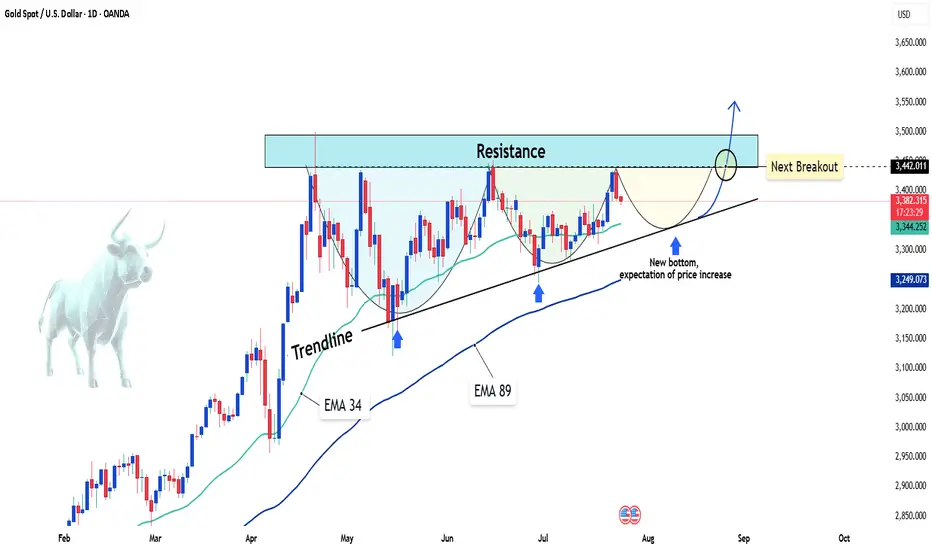
Gold sets sights on 3,500 USD – will the rally continue?Hello traders, do you think gold will keep rising?
Today, OANDA:XAUUSD is trading around 3,380 USD after a slight pullback from the 5-week high of 3,438 USD reached on Tuesday. Despite this short-term dip, the overall trend remains bullish, supported by both technical structures and market expectations.
On the news front, the US Dollar Index (DXY) has dropped to 97.4 – its lowest level in weeks. This reflects growing expectations that the Federal Reserve may cut interest rates by the end of the year, as recent data points to slowing inflation and weakening consumer spending. A softer dollar typically strengthens gold’s appeal.
From a technical perspective, the daily chart reveals a clear bullish structure supported by the rising trendline and the EMA34 and EMA89. Price is consolidating just above the trendline, forming a potential bullish continuation pattern. The resistance zone near 3,440 USD is being repeatedly tested – and if gold breaks out with strong volume, the path toward 3,500 USD could open up quickly.
From my perspective, I expect gold to make new highs above this level soon. What’s your take? Drop your thoughts in the comments!
VIJAYAVIJAYA giving trendline breakout with decent volume. Q1 result is on 28th July may push momentum rally. Support seems near 1005 level. We may see momentum up to 1170 in coming days. Keep it on radar.
