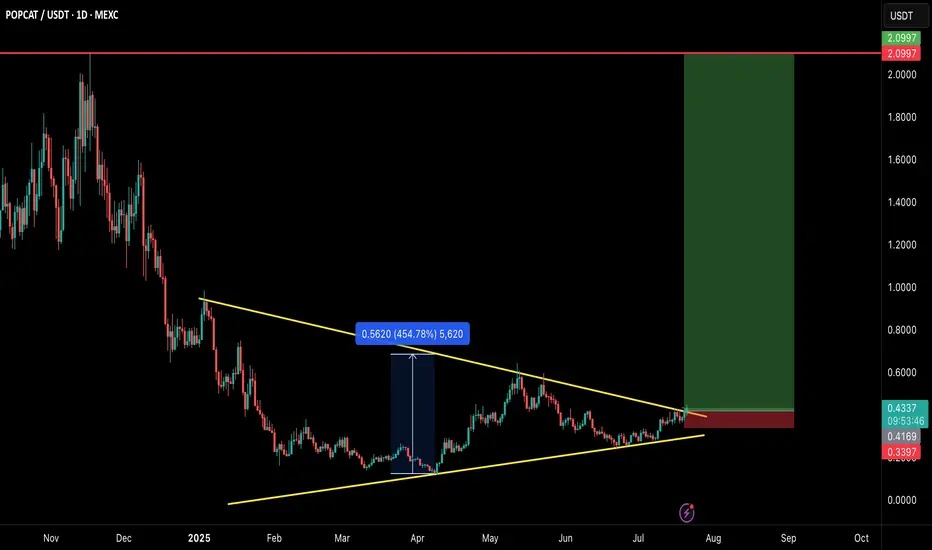
POPCAT/USDT – MEGA BREAKOUT INCOMING!POPCAT is breaking out of a large symmetrical triangle structure that has been developing for several months. This is a textbook bullish reversal setup with explosive potential — and the chart says it all! 👇
🧠 Technical Breakdown:
✅ Clean symmetrical triangle breakout on daily timeframe
🔥 Strong base formation followed by volume breakout
💹 Consolidated above trendline for weeks — breakout looks real
🛒 Entry Zone:
CMP ($0.43) or buy in dips toward $0.40–$0.42
🎯 Targets:
TP1: $0.65
TP2: $1.10
TP3: $1.60
TP4: $2.10
🛑 Stop-loss:
Close below $0.34
📊 Risk/Reward:
Solid RR > 4.0 with high potential if momentum kicks in. Volume and structure both support a strong upside.
📢 Final Thoughts:
This is not just a breakout — it's a multi-month accumulation breakout. If the market stays bullish, POPCAT could go parabolic again just like it did earlier.
🚨 Always use proper risk management and SL!
💬 Drop your thoughts in comments & don’t forget to hit that ❤️ if you find this helpful.
Breakout
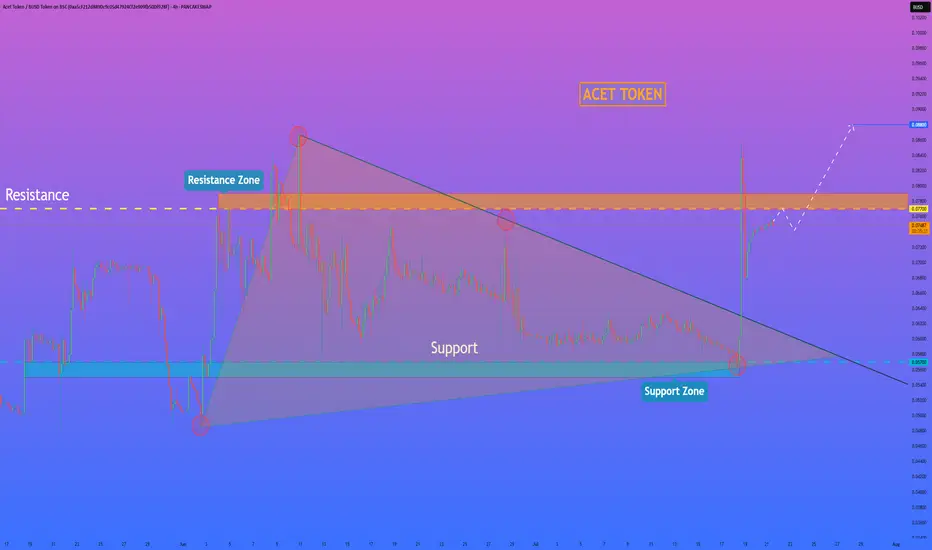
HelenP. I Acet Token may make correction and then continue growHi folks today I'm prepared for you Act Token analytics. If we look at the chart, we can observe a clear technical picture. For a considerable amount of time, the price was tightly compressed inside a large downward wedge, defined by a robust support zone at 0.0570 - 0.0550 and a descending trend line that put consistent pressure on the price. Such long consolidation periods often precede a powerful expansion. Recently, we have witnessed a decisive breakout from this wedge, confirmed by a strong impulse candle. This move signals a clear shift in market sentiment from neutral to bullish and invalidates the prior constraining structure. I believe that the momentum from this breakout will be sufficient to challenge the next major obstacle: the horizontal resistance zone at 0.0770 - 0.0790. This is a critical level to watch, as it has previously rejected price advances. My scenario implies that after potentially a small, healthy correction or retest, the price will continue its upward movement. A successful break above this critical area would confirm the newfound strength of the buyers and open up a clear path for further appreciation. For this reason, my primary goal, the logical target for this move, is set at the 0.0880 level. If you like my analytics you may support me with your like/comment ❤️
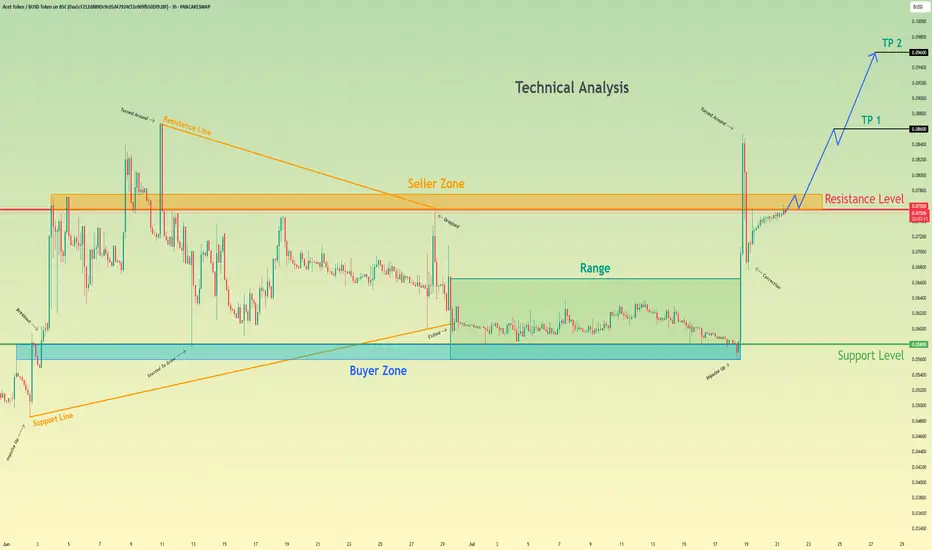
Acet Token will break resistance level and continue to move upHello traders, I want share with you my opinion about Acet Token. Looking at the recent price action, we can see a clear narrative unfolding. The asset initially formed a large wedge pattern, experiencing a trend reversal that led to a breakdown and a period of prolonged consolidation within a defined range between the buyer zone around 0.0580 and the upper boundary. Recently, however, the market showed a strong impulse, breaking out of this range and decisively moving upwards. Currently, the price of act is testing the key resistance level at 0.0755, an area historically defined as a seller zone. The hypothesis is that after this powerful impulse, the asset will manage to break and hold above this resistance. A successful retest of the 0.0755 level would likely signal a continuation of the uptrend, paving the way towards our specified take-profit targets. The first goal is set at TP 1 at 0.0860, with a further extension to TP 2 at 0.0960, capitalizing on the anticipated bullish momentum. Please share this idea with your friends and click Boost 🚀
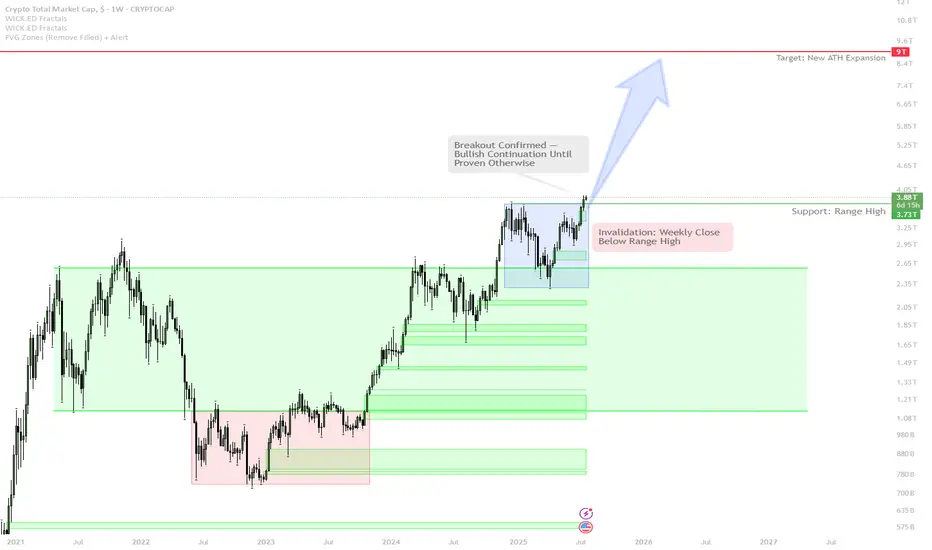
Total Crypto Market Cap: Weekly Breakout Signals Bull Run Contin
The weekly candle has closed above the key range high — this is a major bullish signal, similar to the breakout seen in early 2021.
As long as price remains above this breakout level, the scenario is a continuation uptrend — expect further expansion and strong price action.
If the market fails and closes back below the range high, the breakout will be invalidated — this would signal a potential range or pullback phase.
Current strategy is to trade with the trend:
Hold spot exposure and add on confirmed breakouts.
Do NOT short without a clear breakdown and structure reversal.
If a failed breakout occurs (weekly candle closes back below range high), take profit quickly and switch to risk-off mode.
Market psychology: Most buyers hesitate at lows, but FOMO after a strong move is classic. The disciplined approach is to buy the setup, not the hype.
This is a textbook technical breakout with historical precedence for explosive upside. As long as Total Market Cap holds above the range high, the path of least resistance is up. Attempting to fade the breakout is risky unless there is a clear weekly close back below the level. Trend continuation is favored until proven otherwise. The correct approach is to stay with the trend and manage risk only if a breakdown occurs.
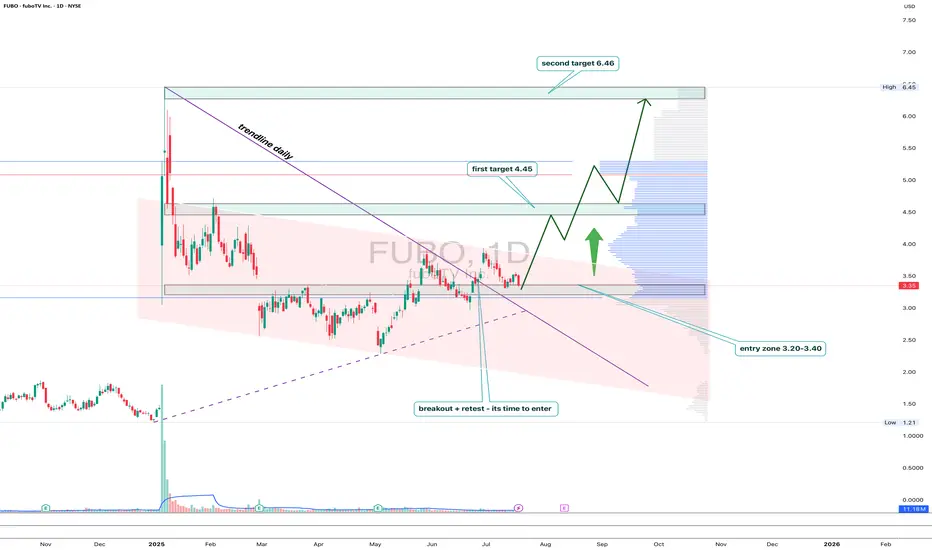
FUBO: trendline breakout with a subscription to $6.46FUBO has broken out of the descending trendline on the daily chart, followed by a clear retest and consolidation above the key 3.20–3.40 area. This zone coincides with the 0.5 Fibonacci retracement and high-volume support, confirming strong buyer interest.
As long as price holds above 3.20, the setup looks bullish with targets at 4.45 (0.382), 5.22, and finally 6.46 — the major resistance and top of the current range. Volume picked up on the breakout, validating accumulation from bigger players.
Fundamentally, FuboTV remains a niche contender in the sports streaming market. With optimized spending and new partnerships with major sports leagues, interest may spike ahead of events like the Olympics and NFL season.
Tactical setup:
— Entry zone: 3.20–3.40
— Must hold: above 3.20
— Targets: 4.45 / 5.22 / 6.46
— Invalidation: break below entry without buyer confirmation
This breakout might just be FUBO’s ticket to prime time.
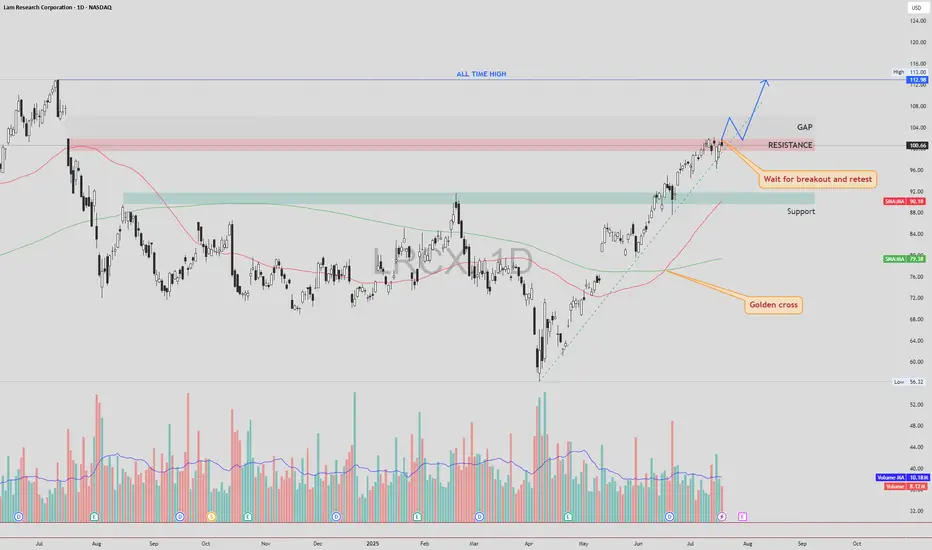
LRCX – Gap Fill First, Then Retest and Potential Move to ATHLRCX NASDAQ:LRCX is currently trading just below a key resistance zone, supported by strong bullish momentum and a confirmed Golden Cross formation.
🔍 Technical Scenario
There is a high probability that price may fill the gap above without retesting the current resistance. After the gap is filled, we could see a pullback to retest the previously untouched resistance zone (now acting as support).
If this retest is successful and holds, the structure may support a continuation move toward the All-Time High (ATH) zone.
📌 Trade Plan
Entry: Avoid chasing the breakout candle. Wait for a gap fill, followed by a clean retest of the broken resistance zone. Enter on confirmation of support holding.
Stop Loss: Place SL just below the retest zone or under the most recent higher low (structure-based stop).
Target 1: Gap fill completion
Target 2 : All-Time High (ATH), if retest confirms
⚠️ Risk Management
The gap-fill rally without retest can be volatile. Patience is key — let the price come back and confirm the breakout zone as new support.
As always, DYOR and manage your position sizing based on your risk profile.
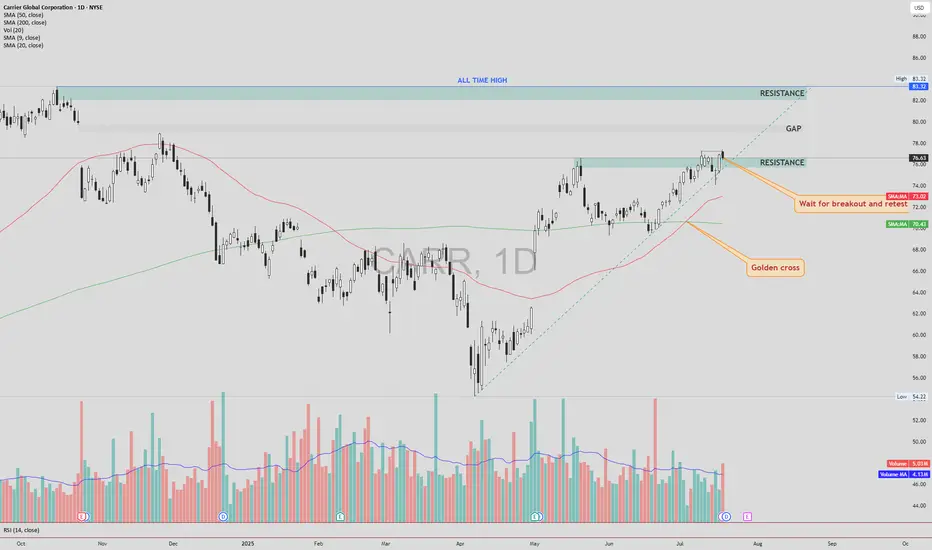
CARR – Bullish Breakout Toward Gap and ATHCarrier Global NYSE:CARR has closed above a key resistance zone near $76.50–$77.00 , indicating a possible breakout setup in progress. This move comes after a Golden Cross , where the 50 SMA crossed above the 200 SMA — a long-term bullish signal.
🔍 Technical Highlights:
✅ Golden Cross: Bullish momentum building.
✅ Breakout level: Price broke above horizontal resistance zone.
🔄 Next step: Wait for a potential retest of the breakout zone.
🔊 High volume on the breakout and retest would increase the strength and reliability of the setup.
🎯 Target Levels:
First Target (TP1): ~$80.00 — near the top of the existing gap.
Second Target (TP2): ~$83.32 — the current All-Time High (ATH).
🛡 Trade Plan:
Entry idea: After a clean retest of the breakout level with supportive volume.
Stop-loss: Below the retest zone or under 50 SMA (~$72-74 area).
Invalidation: If price falls back below resistance on high volume.
Conclusion:
CARR shows a strong breakout setup after a Golden Cross. A confirmed retest with volume could open the door toward the gap fill and new all-time highs.
DYOR – This is not financial advice.
EURAUD 4H cup and handleEURAUD 4H cup and handle formed and possibly breaking out to the upside. Price recently found support off the daily 50ema (overlayed on this 4h chart) and is holding above the daily 10 & 20EMAs (overlayed).
I'm a cat not a financial advisor.

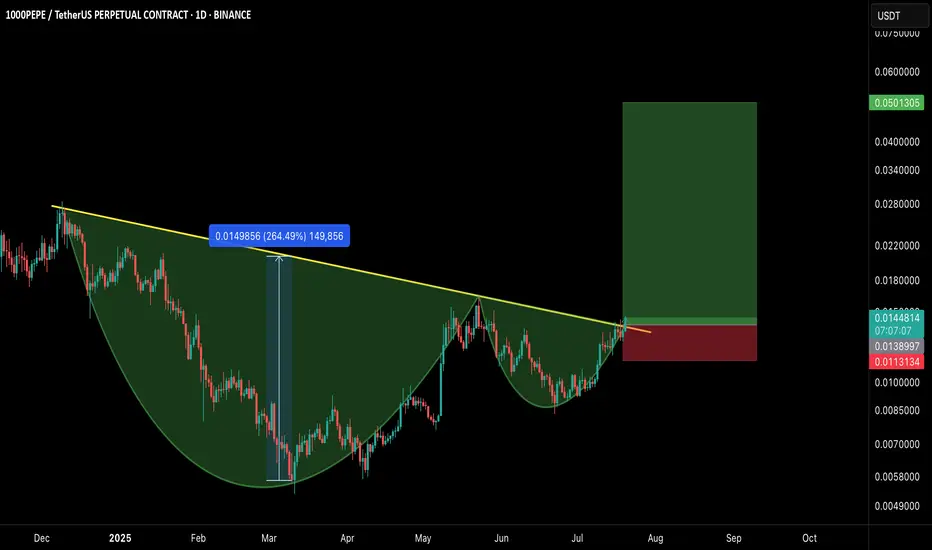
1000PEPE/USDT – CUP & HANDLE BREAKOUT!Hey Traders!
If you’re finding value in this analysis, smash that 👍 and hit Follow for high-accuracy trade setups that actually deliver!
A classic Cup and Handle formation just broke out with strong bullish confirmation, signaling the potential start of a massive trend reversal on the higher timeframe.
📊 Pattern Breakdown
✅ Cup & Handle pattern forming over 7+ months
📐 Breakout above neckline with volume confirmation
📈 Measured move target points towards $0.0501+
🛒 Long Entry:
CMP or on retest near $0.0128–$0.0138
🎯 Targets:
TP1: $0.022
TP2: $0.028
TP3: $0.035
TP4: $0.050
🛑 Stop-loss:
Below handle low — around $0.0113
📌 Risk-to-Reward:
Insane potential here with a 3.5R+ setup even with conservative targets.
📢 Final Thoughts:
This is a textbook reversal pattern breaking out after long accumulation. If BTC remains stable or bullish, meme momentum could supercharge this move.
DYOR + SL is a must!
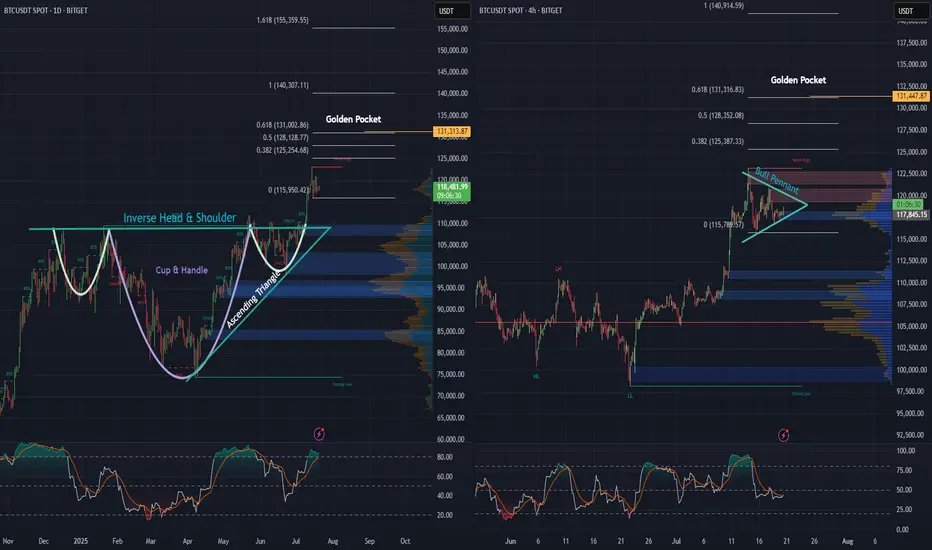
BTC daily, and 4 hr. Bullish Patterns Stack Up!Looking at the Daily and 4-hour charts for BTC, we can see multiple bullish formations unfolding.
An inverse head and shoulders - daily
A cup and handle - daily
An ascending triangle - daily
Price action looks strong, as we’ve begun the breakout from the neckline on the inverse H&S, as well as the cup and handle and ascending triangle simultaneously, and momentum is building fast.
Also, on the 4-hour chart, there’s a pretty substantial bull pennant taking shape. A breakout here could be the next leg up, and the push needed to keep momentum alive.
Zooming out, when we apply the trend-based Fibonacci extension, it reveals a $131,000 golden pocket, on both the the daily as well as the 4 hr. And that could be a major upside target if these bullish structures hold.
Stay tuned to see if BTC continues its move and sets a new all-time high.
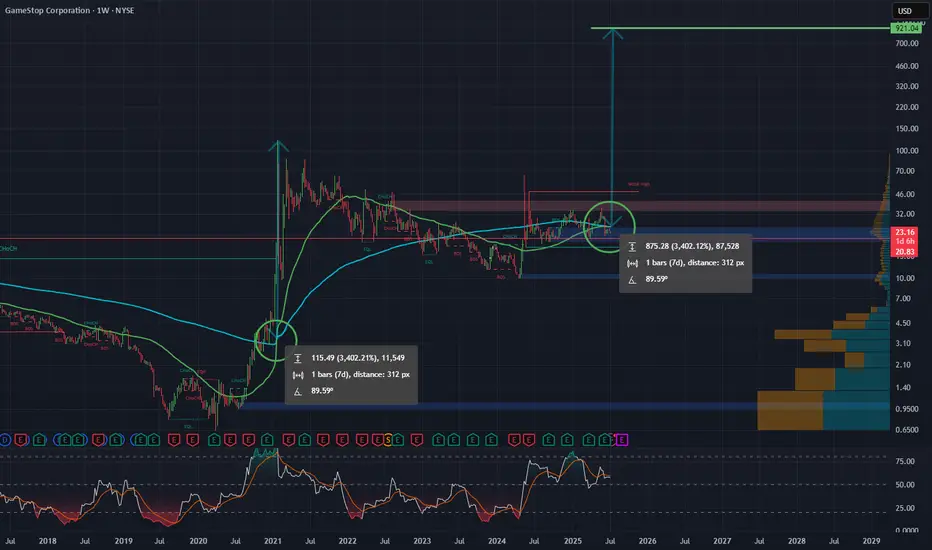
Golden Cross on GME WeeklyGME Chart Breakdown, Déjà Vu or Destiny? Something big just lit up the weekly chart, the 50 MA has pierced through the 200 MA, forming that golden cross traders dream about. On the weekly timeframe. Not a drill.
Now, let’s rewind. The last time this pattern appeared? January 2021. The infamous squeeze. Back then, GME didn’t just nudge upward, it catapulted nearly 4000%, going from a $3 floor to $120 in a blink.
Fast forward to today, new golden cross, new setup, and a $23 floor. If history rhymes even remotely, we’re staring down a hypothetical $1000 per share move. Yes, one thousand.
Is lightning about to strike twice? Stay tuned to find out!
Double Bull Flags on an Ascending Triangle breakout on the dailyDaily, double Bull Flag, on top of an Ascending Triangle Breakout. Golden Pocket on the Fib Ext is $588 🥂

Is it finally time for a rally?Looking at NVIDIA (NVDA) on the weekly chart over the past two years, a significant gap up becomes apparent around April, which persisted for much of the year. Considering the recent news and the stock's pullbacks lately, this may be the moment for NVDA to resume its upward grind. The coming weeks will reveal its direction.
Additionally, it's worth noting the formation of a massive bull pennant on the weekly chart. If history repeats itself and this pattern holds, the next 2 to 6 weeks could prove to be a thrilling period for NVDA.

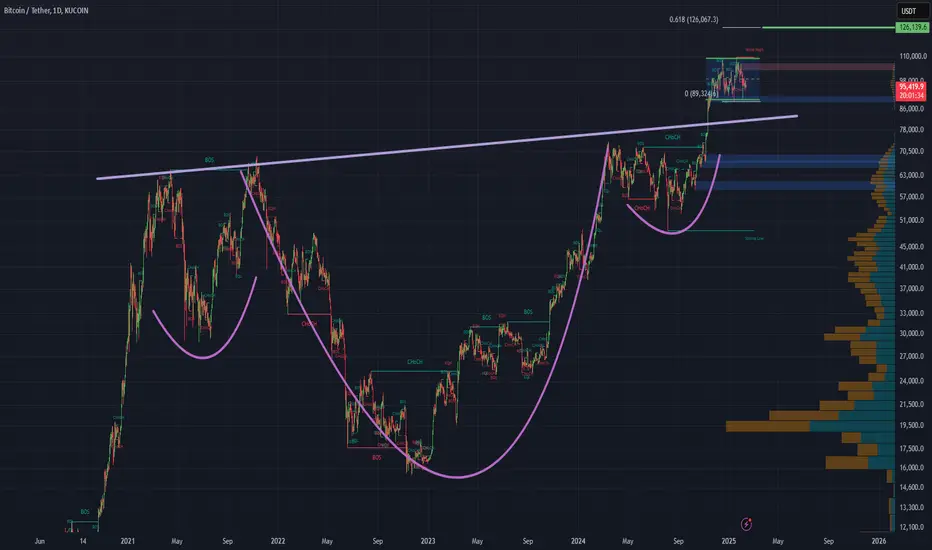
Bitcoin: Promising Patterns and Potential BreakoutBitcoin's recent price action has been nothing short of captivating for traders and analysts alike. On the daily chart, we've observed the formation of an Inverse Head & Shoulders and a Cup & Handle pattern, both of which have now transitioned into a Bull Flag. These bullish signals suggest a strong potential for upward movement.
Zooming into the 4-hour and 1-hour charts, we can see prominent Ascending Triangles taking shape. These patterns are often harbingers of significant breakouts, and it appears that Bitcoin is winding up for a substantial move.
Moreover, when utilizing a Trend-based Fibonacci Extension on the daily timeframe, the golden pocket points to a target of $126k, with the next pocket at $185k. This aligns with historical data and technical indicators, suggesting that Bitcoin might be poised to rewrite history once again.
Stay tuned as we monitor these developments and anticipate what could be a historic breakout for Bitcoin!
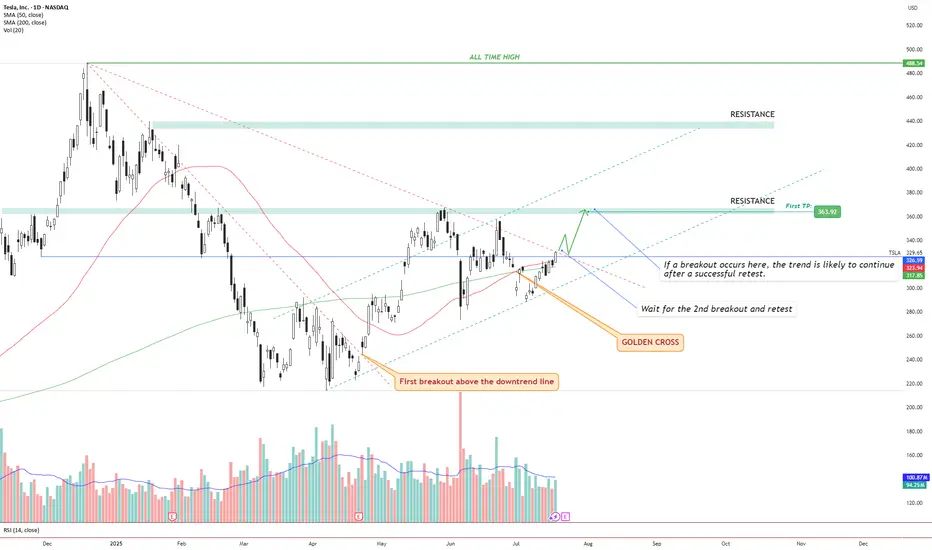
TSLA – Golden Cross + Dual Breakout Structure Targeting $363 andIdea Text:
Tesla NASDAQ:TSLA has recently printed a powerful Golden Cross , where the 50 SMA has crossed above the 200 SMA — signaling a potential long-term bullish shift in trend.
But price action shows more:
We’re observing a dual-breakout structure, where the first breakout above the long-term downtrend line has already occurred (see orange label), and the price is now approaching a critical horizontal resistance zone.
Let’s break it down step-by-step:
🔸 Step 1: Golden Cross
The 50 SMA crossed above 200 SMA — a classic signal for trend reversal. This often attracts institutional interest, especially if followed by breakout confirmation.
🔸 Step 2: First Breakout (Already Confirmed)
Price broke above the descending trendline, retested it, and maintained higher structure. This breakout initiated a shift in market sentiment from bearish to neutral-bullish.
🔸 Step 3: Second Breakout (Setup Forming)
Price is now testing horizontal resistance around $330–$335 zone. This zone also coincides with dynamic resistance from prior failed swing attempts. A successful breakout above this level, followed by a clean retest, can serve as confirmation for a bullish continuation.
🔸 Step 4: Target Setting
🎯 First TP is set at $363.92, a well-defined resistance level. If the breakout holds, next potential targets may develop around key zones such as $395 and $440, depending on price strength and continuation.
🔸 Risk Management
✅ Ideal entry after retest of breakout above ~$335.
❌ Stop-loss below the breakout level or below 50 SMA (~$315 area), depending on entry style.
🔄 Monitor volume: breakout without volume = weak move.
Conclusion:
We are watching a classic price action + moving average confluence setup. Golden Cross, breakout + retest structure, clean resistance level, and defined targets all align.
This setup is valid only with confirmation. No breakout = no trade.
⚠️ Not financial advice. DYOR.
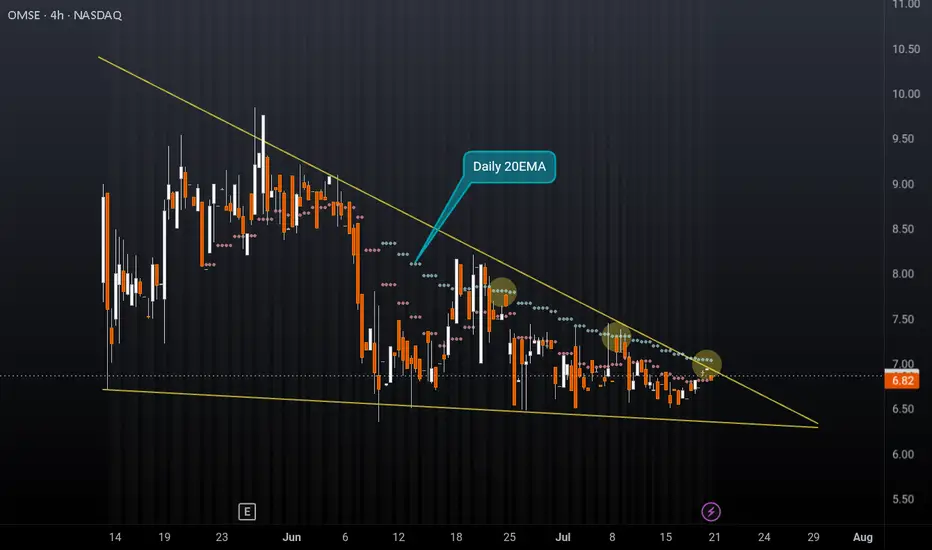
OMSE falling wedge after IPONeutral on OMSE, another relatively new ticker. Similar to my previous post on DVLT, this ticker is fundamentally strong but stuck in a falling wedge after IPO. Price is struggling to break the daily 20EMA (overlayed on this 4H chart) and has rejected multiple times. The company has strong financials, take the time to do some DD, however this pattern could break to the downside and hit new lows before we see any type of rally given the weakness in this sector at the moment. Set alerts and watch the price action play out, or don't bet your rent money on any direction if entering a position.
I'm just a cat not a financial advisor.
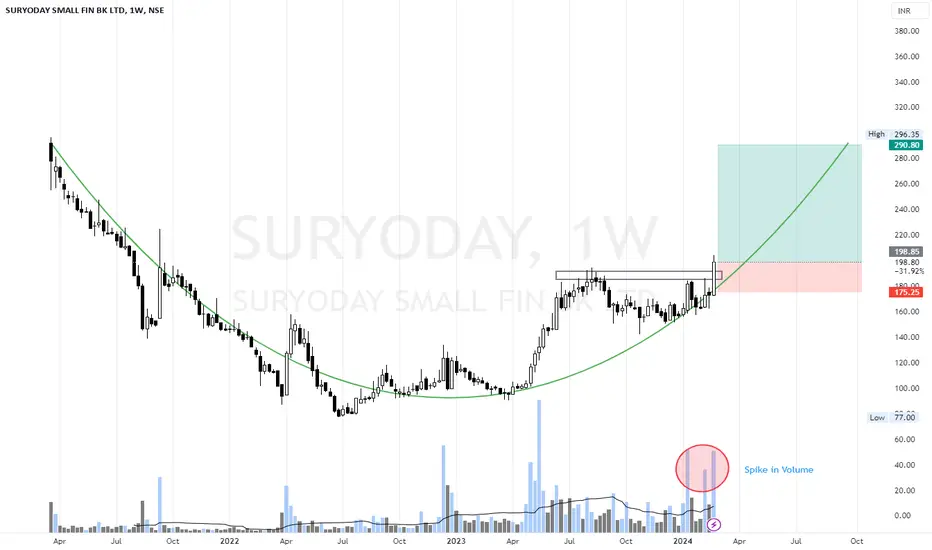
Suryoday Bullish long Term Buy IdeaAfter consolidation of Monts Finally Suryodaya has given a breakout and we can see the Volume is also on higher side, Since the Listing of the stock it was in downward direction, and from past year Stock is now in its bullish Run We can see a good upward move.
Disclaimer: I am not SEBI Registered; this is not a recommendation. Analysis shared for educational purpose only.
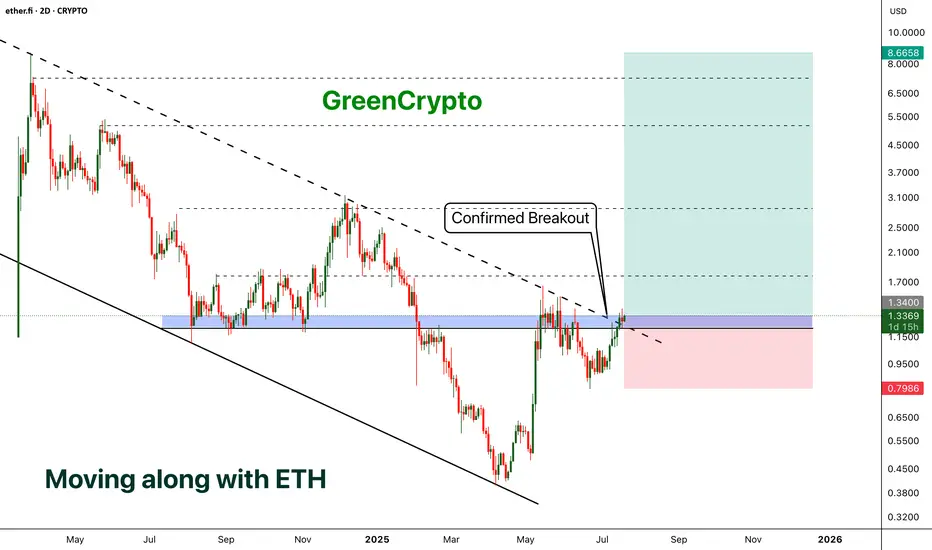
ETHFI - Moving along with the ETH- ETHFI has finally broken out from the descending channel pattern and now price is above the trending resistance line.
- We can expect a minor reversal (chances are less ) and parabolic move from here.
- I'm expecting at-least 500+% profit from this opportunity
Entry Price: 1.3384
Stop Loss: 0.7965
TP1: 1.7657
TP2: 2.5436
TP3: 4.5055
TP4: 5.6136
TP5: 8.5626
Max Leverage 5x.
Don't forget to keep stoploss.
Support us by Liking and following.
Thanks and Cheers!
GreenCrypto
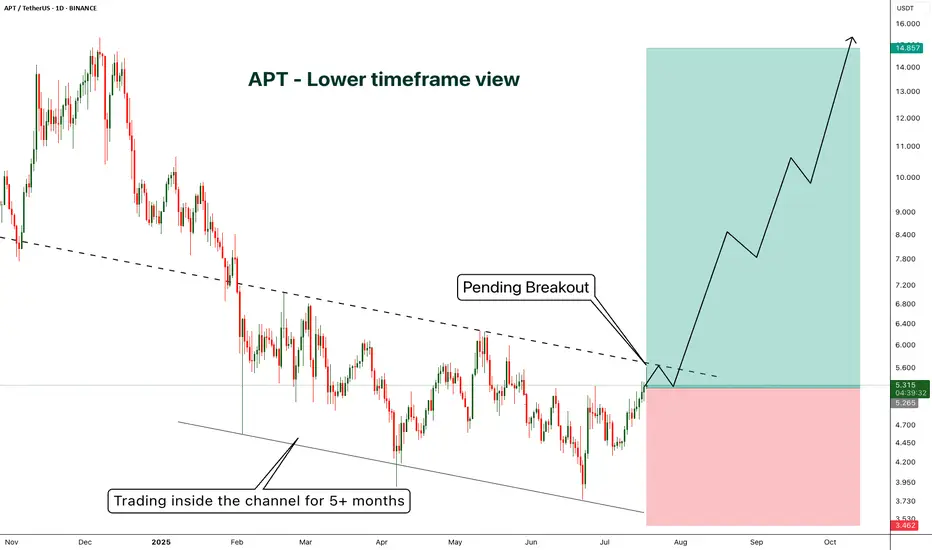
APT - A lower timeframe view - Breakout Entry- On 1D candle, APT is still trading inside the channel
- currently price is trading near the resistance and got rejected from the resistance as expected.
- I'm expecting few more candles near the resistance zone before breakout.
If we look at the higher timeframe (1W) view we shared earlier, there is huge potential for uptrend as we are expecting past pattern to repeat
if you are looking for a short term trade without focusing on weekly chart, this is a good opportunity
Entry Price: 5.313
Stop Loss: 3.462
TP1: 6.141
TP2: 7.270
TP3: 8.634
TP4: 10.583
TP5: 14.768
Don't forget to keep stoploss
Cheers
GreenCrypto
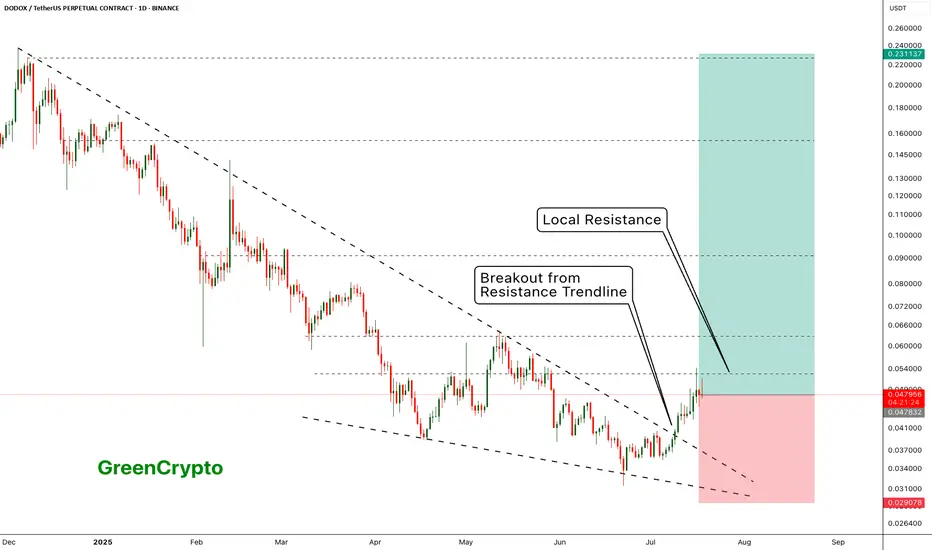
DODOX - Resistance is holding it back - Huge Potential- DODOX has successfully broken out from the resistance trendline
- Now its being pushed back back the weak local resistances
- I see a huge upward potential here.
Entry Price: 0.048271 ( Or you can wait for it breakout from the local resistance of 0.063051)
Stop Loss: 0.029078
TP1: 0.062621
TP2: 0.079766
TP3: 0.103243
TP4: 0.151853
TP5: 0.222332
Max Leverage 5x.
Don't forget to keep stoploss
Cheers!
GreenCrypto
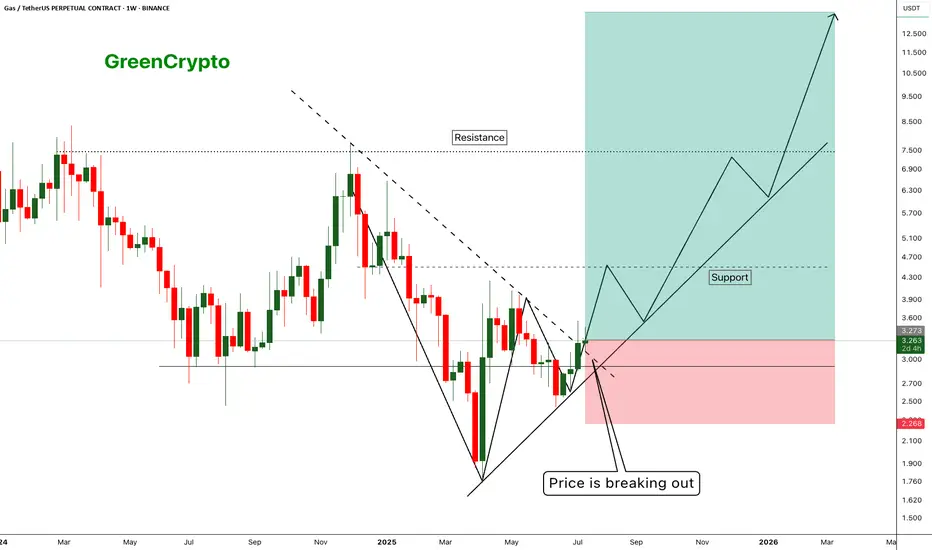
GAS - Huge Risk:Reward Trade 1:10 - Is there any Gas Left ?- Gas has finally managed to breakout from the resistance trendline and now trading just above the resistance
- I'm expecting this trend to continue along the support line shown in the chart.
Entry Price: 3.281
Stop Loss: 2.271
TP1: 3.944
TP2: 4.589
TP3: 6.775
TP4: 8.412
TP5: 13.512
Max Leverage 5x.
Don't forget to keep stoploss.
Support us by Liking and following.
Thanks and Cheers!
GreenCrypto
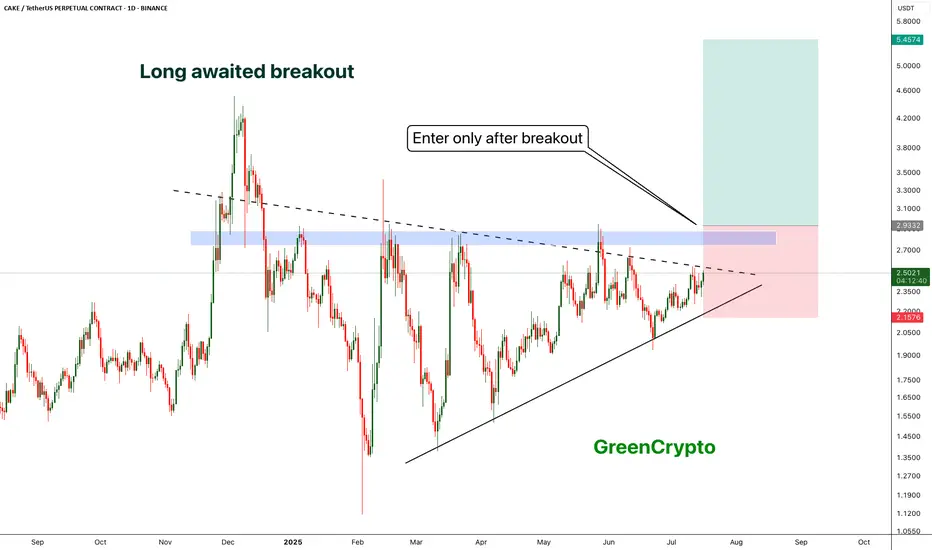
5$ is realistic target for CAKE- CAKE is trading inside the triangle since 2025
- now it seems like there is a possibility of breakout
- A clear breakout with decent volume would push the price towards 5$
- we will enter after the breakout
Entry Price: 2.9
Stop Loss: 2.15
TP1: 3.4371
TP2: 4.2671
TP3: 5.0083
Max Leverage 5x
Don't forget to keep stop loss
cheers
GreenCrypto
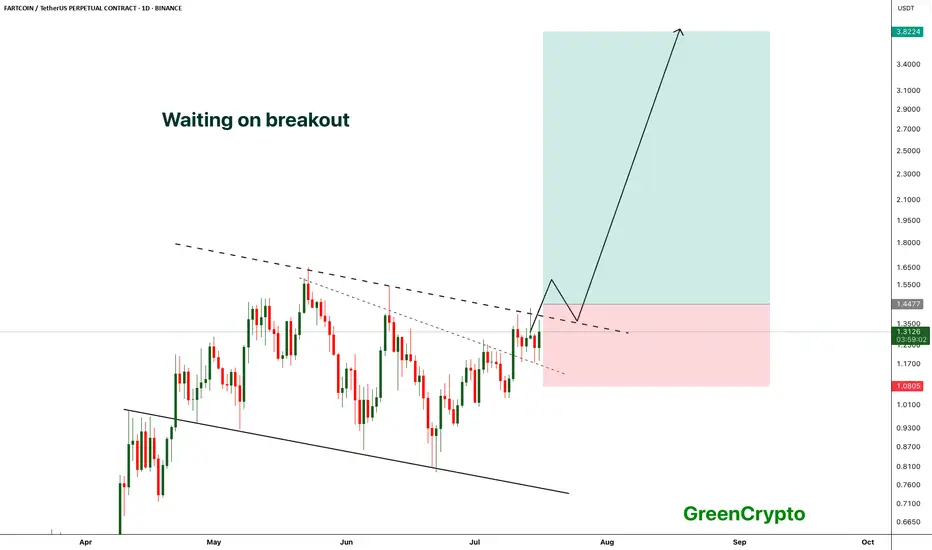
FARTCOIN - Breakout from the channel- FARTCOIN is waiting to breakout from the channel, a confirmed breakout would push the price to new all time high
- we have long trade opportunity once the price breaks above the resistance trendline
Entry Price: above 1.44
Stop Loss: Below 1.08
TP1: 1.6464
TP2: 1.8923
TP3: 2.2450
TP4: 2.9973
TP5: 3.8224
Max Leverage: 5x
Don't forget to keep stoploss
Cheers
GreenCrypto