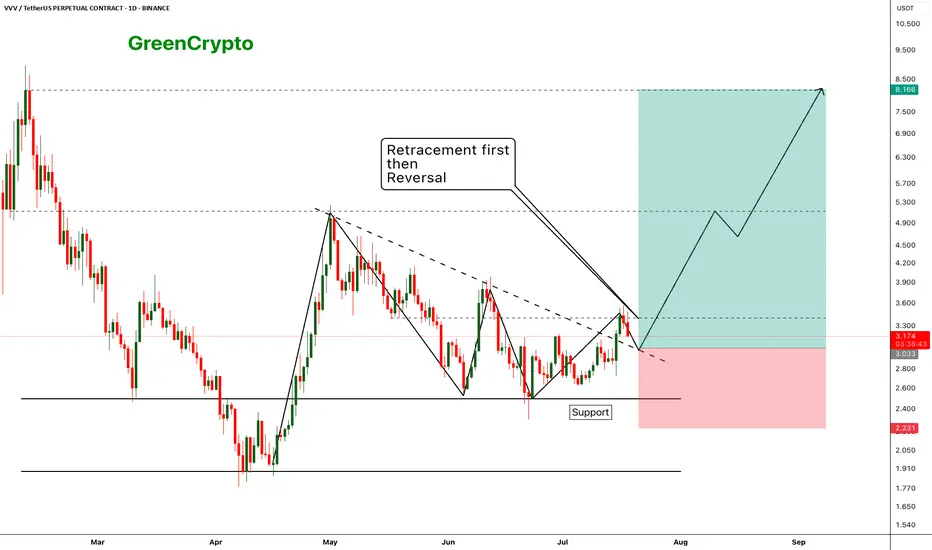
VVV - Expecting perfect reversal after the retracement- price has broken out from the resistance trendline and now we are seeing a retracement as expecting
- Price should hold the support (previous resistance) and reverse from the suppport zone.
- we can enter our trade once the retracement completed
Entry Price: 3.033
Stop Loss: 2.231
TP1: 3.411
TP2: 4.037
TP3: 4.851
TP4: 6.360
TP5: 8.028
Max Leverage 5x.
Don't forget to keep stoploss.
Cheers!
GreenCrypto
Breakout
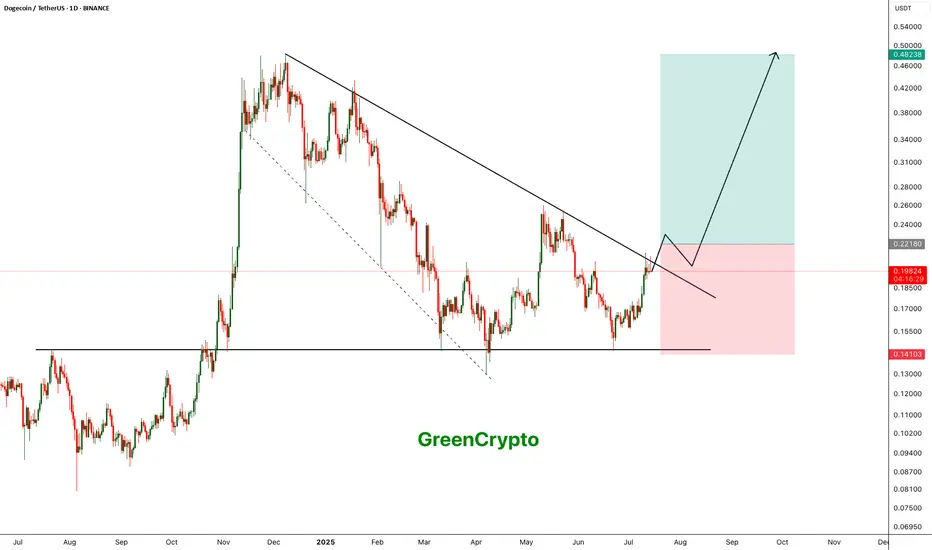
DOGE - Another Perspective- DOGE is currently trading nearing the trendline resistance and pending breakout
- A clear breakout from this resistance line is a must to continue to bullish momentum.
- we will enter the trade after confirmed breakout
Entry: 0.221
SL at: 0.14103
TP1: 0.26035
TP2: 0.33892
TP3: 0.47751
Stay tuned for more updates.
Cheers
GreenCrypto
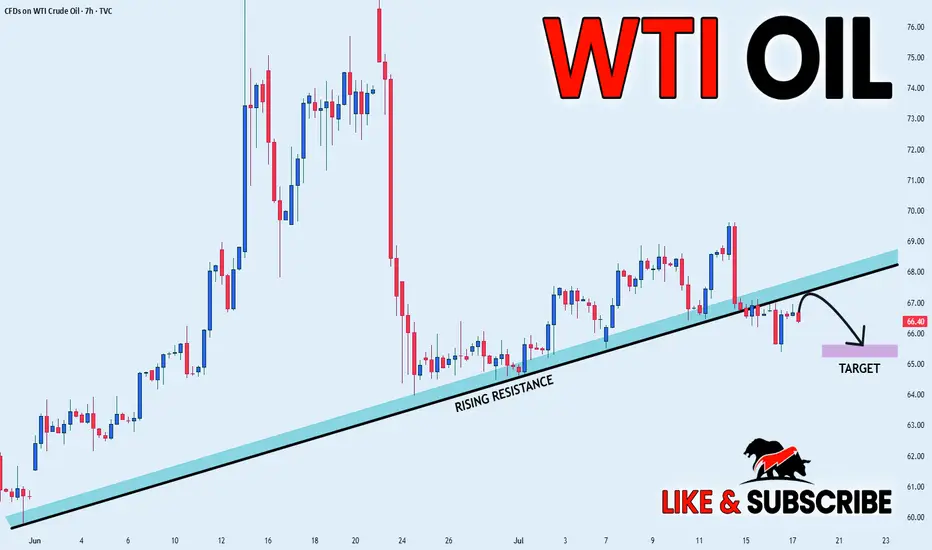
CRUDE OIL BEARISH BREAKOUT|SHORT|
✅CRUDE OIL broke the rising
Support line which is now a resistance
And the price made a retest an a pullback
So we we are bearish biased and we
Will be expecting a further
Bearish move down
SHORT🔥
✅Like and subscribe to never miss a new idea!✅
Disclosure: I am part of Trade Nation's Influencer program and receive a monthly fee for using their TradingView charts in my analysis.
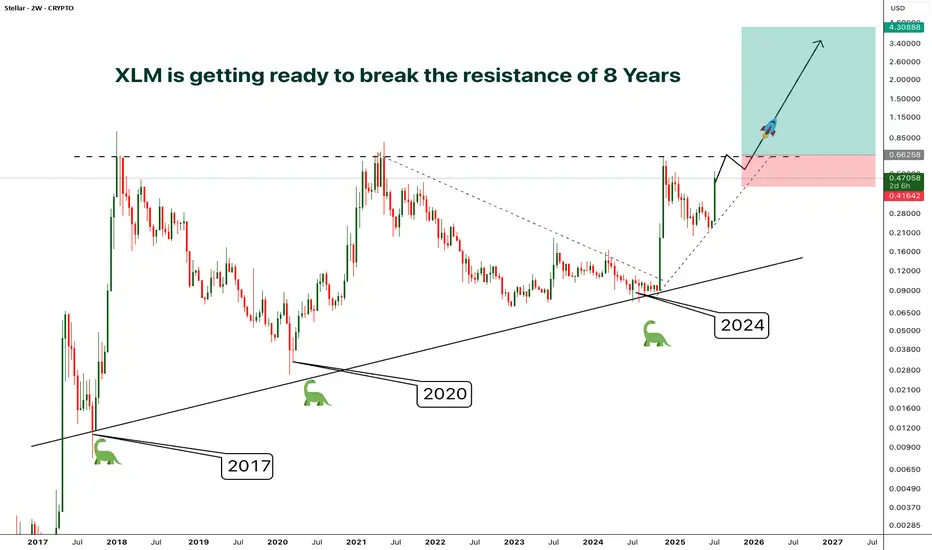
XLM - Resistance/Consolidation of 8 Years- Finally after 8 years of consolidation and getting rejected by the resistance at the same level around 0.65, XLM is preparing to break out from the almost decade old resistance
- A clear breakout from this resistance will phenomenal
- The price surge after the breakout will be unlike anything you've ever seen.
- I'm planning to enter after a confirmed breakout, entry before the breakout will be risky in case if the price gets rejected again.
Entry Price: Candle closeAbove 0.65
Stop Loss: Below 0.41
TP1: 0.88574
TP2: 1.21012
TP3: 1.92545
TP4: 2.68849
TP5: 4.27772
Don't forget to keep stoploss
Cheers
GreenCrypto
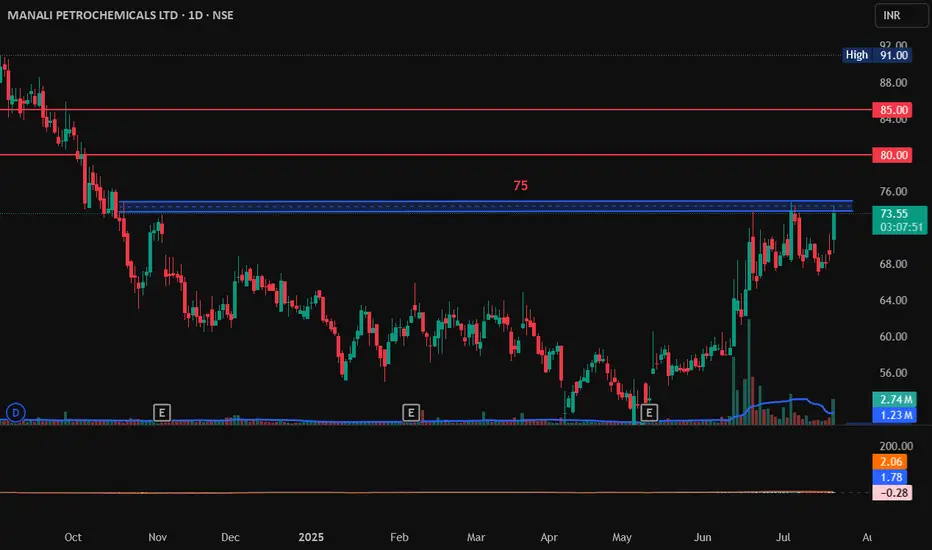
MANALI PETROCHEMICALS LTD, Breakout, LongMANALI PETROCHEMICALS LTD has raised 6% today and its near the resistance zone of 75. If it breaks this 75 and sustain it with Bullish candlestick patterns like Bullish Engulfing, Hammer & Inverted Hammer, Piercing Line, Morning Star, Three White Soldiers, Tweezer Bottoms or Bullish Harami.
Entry on Bullish pattern: 75
Target1: 80
Target2: 85.
SL: 70.
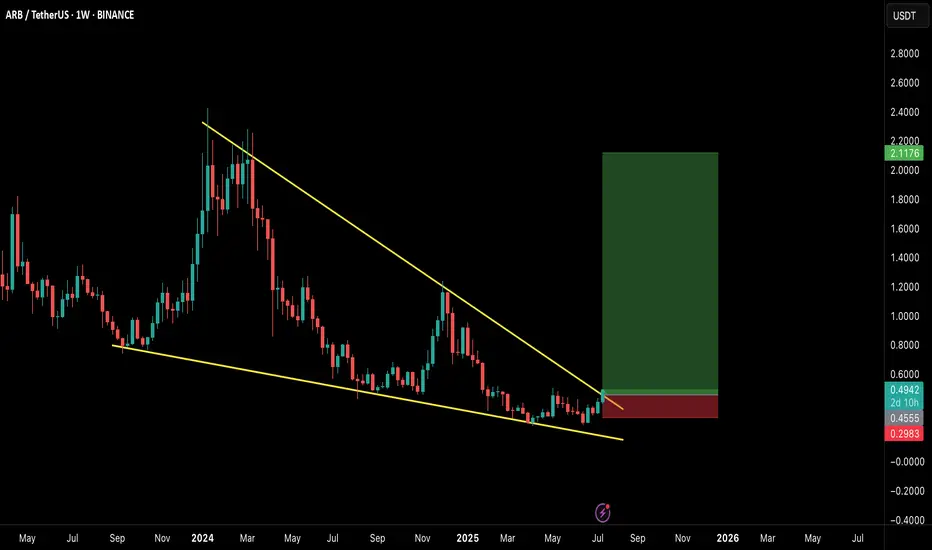
ARB/USDT – Weekly Breakout Setup!Hey Traders!
If you’re finding value in this analysis, smash that 👍 and hit Follow for high-accuracy trade setups that actually deliver!
Massive Falling Wedge Breakout in Play!
ARB just confirmed a breakout from a long-term falling wedge pattern on the weekly timeframe, which has historically been one of the most reliable bullish reversal structures in technical analysis.
🧠 Why this setup matters:
The falling wedge has been forming for over a year, indicating long-term accumulation and compression.
Price has clearly broken above the descending resistance, suggesting a potential shift in momentum.
The structure resembles previous explosive moves, and this could just be the start of a multi-month rally.
🟢 Trade Setup:
Entry: CMP ($0.49) & accumulate on any dips
Targets:
🎯 $0.85
🎯 $1.30
🎯 $2.10+ (Full wedge target)
Stop-loss: 🔴 Close below $0.30
Timeframe: Mid to long term (6–12 weeks or more)
🚀 Bullish Signals:
Weekly breakout candle with strong volume (confirmation pending close).
Market-wide sentiment is gradually turning, and ARB may become one of the leaders.
📌 Final Thoughts:
This is a high-conviction swing setup with a strong reward-to-risk ratio. Keep an eye on weekly close confirmation and market sentiment for better entries.
💬 Let me know your thoughts or if you’re riding this setup too!
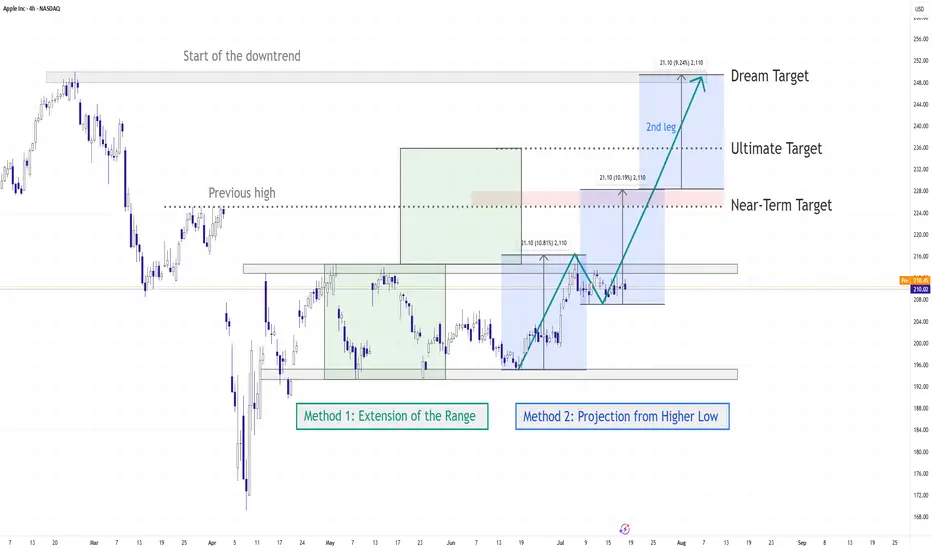
AAPL Set for a Breakout? | Technical Checklist & Projections
▍Observation & Context
▪ AAPL has been moving sideways within a clearly defined range for the past three months .
▪ On July 07 , price tested the range resistance decisively, showing some interest in the upside.
→ Let's first explore the bullish breakout scenario.
▍What Makes a Good Breakout ?
Before we talk about targets, let’s define what a good breakout looks like:
▪ A strong bullish candle breaking through the resistance in one clean move .
▪ Followed by a retest of the broken resistance (now acting as support).
▪ After that, price should ideally:
1. Form a higher low , and
2. Reach the next resistance or target zone before pulling back.
▍Target Price – Method 1: Extension of the Range
🔹 Near-Term Target: 1.5–1.618x Fibonacci Extension
- A common zone where momentum often pauses.
- Aligns with the previous high from the last downtrend.
- Technically, to reverse a trend, price needs to take out the previous high. Even though the range has “cooled off” the pressure, we still respect that level.
🔹 Ultimate Target: 2x Range Extension
- Represents a 100% projection of the previous range.
- Commonly used in range breakout targets.
🔹 Dream Target: 2.618x Fibonacci Extension
- Aligns with the start of the last downtrend , adding significance to the level.
- Often marks the exhaustion point of strong trends.
▍Target Price – Method 2: Projection from Higher Low
Note: The new higher low is not yet confirmed at the time of writing. The levels below assume an upward breakout without dropping below 207.22 . However, the same logic can be applied once the higher low forms.
🔹 Near-Term Target: Same as Method 1
🔹 Ultimate Target: 100% Projection of Prior Swing
- Projecting the prior swing (from previous low to recent high) from the new higher low .
- This level also aligns with the 1.5–1.618x Fibonacci extension of that swing, increasing its significance.
🔹 Dream Target: Another 100% projection
- Rare, but happens when momentum is very strong .
- In such cases, price might skip any retracement and launch directly into a second leg , equal to the previous swing.
- Here, the level aligns perfectly with the start of the last downtrend , just like the 2.618x extension in Method 1.
▋Mental Notes
▪ No one knows for sure if the breakout will be real or fake. But when it happens, knowing what to look for and where price might go next gives us a clear plan of action .
▪ The market will always find ways to surprise. Stay open and follow the flow.
▋Not Financial Advice
The information contained in this article is not intended as, and should not be understood as financial advice. You should take independent financial advice from a professional who is aware of the facts and circumstances of your individual situation.
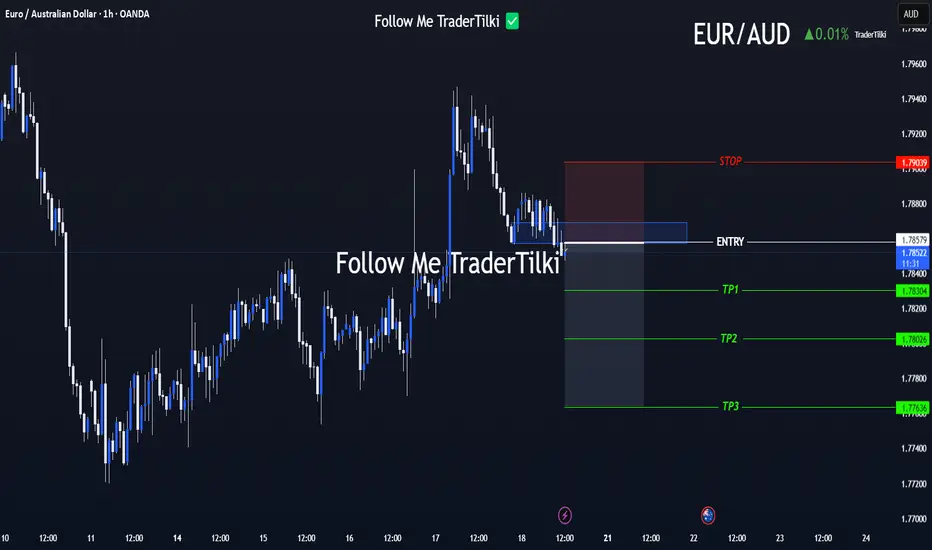
FX Setup of the Day: EURAUD SELL ZONEHey traders 👋
📌 SELL / EURAUD – Technical Breakdown
🟢 Entry: 1.78579
🎯 Target 1: 1.78304
🎯 Target 2: 1.78026
🎯 Target 3: 1.77636
🔴 Stop Loss: 1.79039
📈 Risk/Reward Ratio: 2.00
I’ve carefully validated these levels and crafted a clean, focused analysis for you.
Every like seriously fuels my drive to produce more top-tier content 📈
Your support genuinely means a lot to me.
Thanks from the heart to everyone showing love 💙
🎯 Clear targets, solid strategy.
🤝 Let’s move forward with logic and discipline.
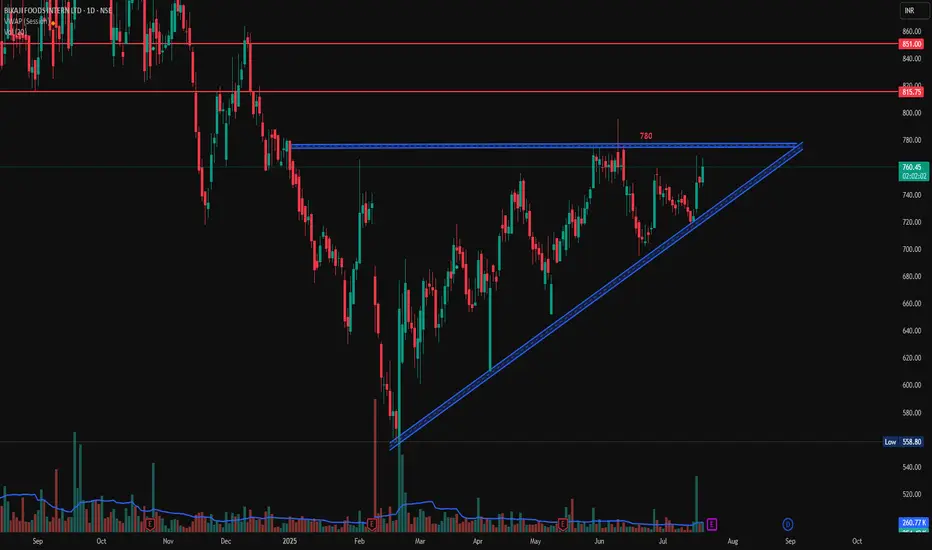
Bikaji Food Triangular Pattern, Long, 1DBikaji Food is following a triangular pattern. If it breaks the level of 780 with Bullish candlestick patterns like Bullish Engulfing, Hammer & Inverted Hammer, Piercing Line, Morning Star, Three White Soldiers, Tweezer Bottoms or Bullish Harami, then take a long trade on this stock with first target of 815 and second target of 851.
Entry: 780 (on Bullish candlestick pattern)
Target1: 815
Target2: 851
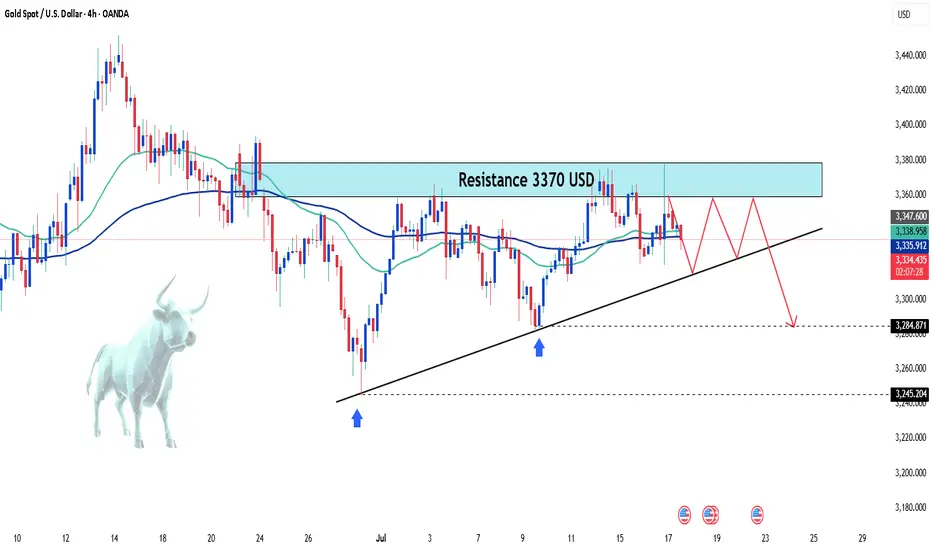
Gold prices fall in the short term – What's next?Hello everyone, what’s your take on gold?
Today, gold continues to attract short-term selling pressure as USD buying momentum returns and expectations for Fed rate cuts diminish. On the other hand, an overall positive risk sentiment is also seen as another factor weighing on the precious metal.
At the time of writing, gold is trading around the EMA 34 and 89 near 3,336 USD. With no major updates expected, the market is likely to remain steady throughout the day.
From a technical perspective, the bearish trend persists, with prices capped below the trendline. A series of lower highs and lower lows could push XAUUSD to retest deeper levels, potentially reaching the 3,300 USD mark. However, lingering trade uncertainties may limit losses for this safe-haven asset.
This is just my view on the market, not financial advice.

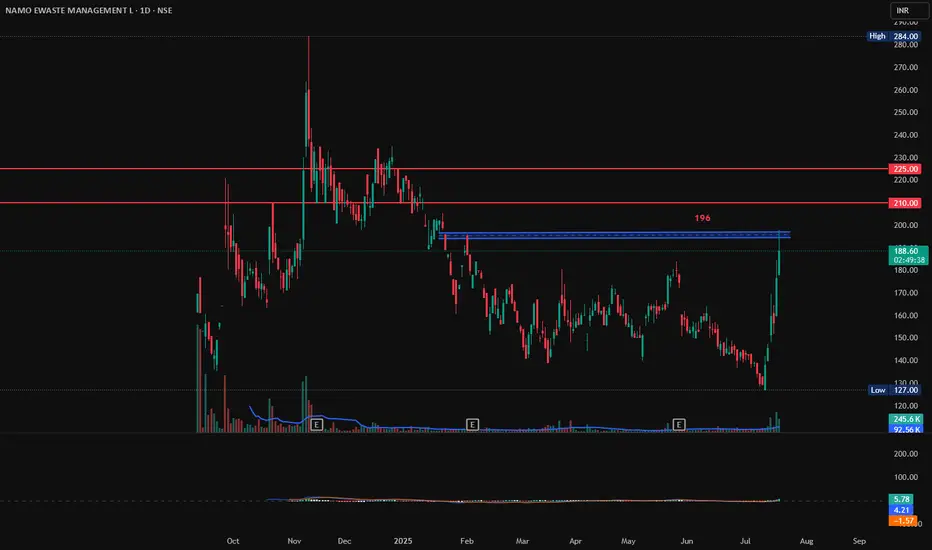
NAMO EWASTE MANAGEMENT, Long, Breakout, 1DNAMO EWASTE MANAGEMENT has gain 6% today with good volumes. If it breaks and sustains 196 with Bullish candlestick patterns like Bullish Engulfing, Hammer & Inverted Hammer, Piercing Line, Morning Star, Three White Soldiers, Tweezer Bottoms or Bullish Harami, then there are good chances for it to go further up from here. First target will be 210 and second target 225.
Entry: 196 (on Bullish candlestick pattern)
Target1: 210
Target2: 225.
SL: 185
Gold's Short-Term Decline: What's Next?Hello everyone, what do you think about gold?
Today, gold continues its short-term downtrend. After new data was released at the end of yesterday’s trading session, the USD rose by 0.3%, and U.S. Treasury yields also increased, reducing the appeal of gold. Additionally, the latest unemployment claims data shows improvement in the U.S. economy, which has contributed to the drop in the precious metal.
As of writing, gold is trading around the EMA 34, 89 levels at 3,336 USD. With the recent news, the market is expected to maintain its current stance throughout the day, as no new significant updates are expected.
From a technical standpoint, the downtrend remains in place, with prices continuing to be capped below the trendline. The series of lower highs and lows could likely lead XAUUSD to test lower levels, with the possibility of reaching the 3,300 USD mark.
What do you think about the price of gold today? Let us know in the comments!

Latest Gold Price Update TodayGold prices today continue to maintain a short-term uptrend, driven by trade tensions and U.S. inflation data.
The weakening of the USD and the drop in U.S. Treasury yields have increased gold's appeal as a safe-haven asset. The trade tensions between the U.S. and the EU, along with new tariff measures, further boost the demand for gold.
Additionally, the U.S. PPI for June rose by 2.3%, lower than the forecast and May’s increase, suggesting that inflation could decrease in the future. The market expects the Fed to cut interest rates in September, weakening the USD and supporting gold's uptrend.
With factors like trade tensions, a weaker USD, and positive inflation data, gold prices may continue to rise. Investors need to closely monitor these factors to devise an appropriate strategy.
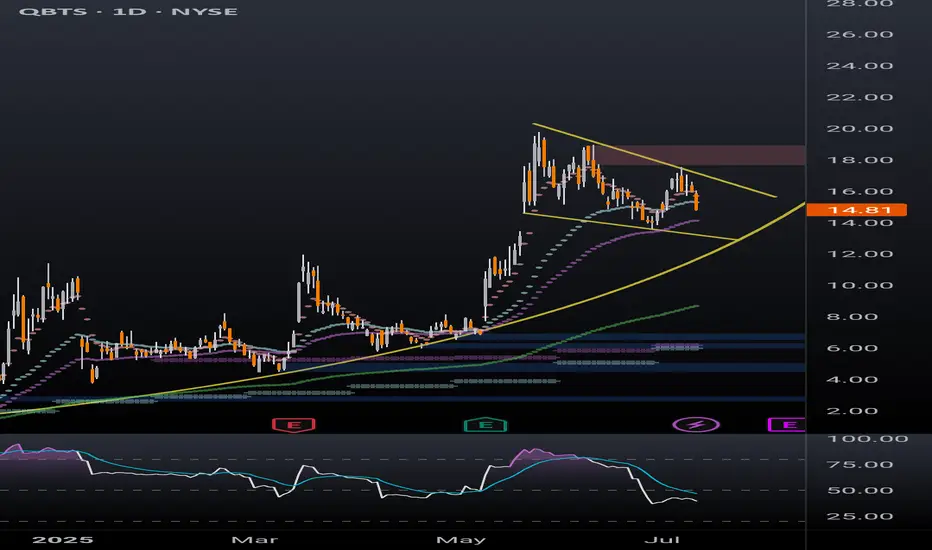
QBTS bull flag dailyBetter look at quantum computing ticker QBTS bull flag on the daily timeframe. Previous post looked at the weekly timeframe to highlight the bullish momentum. Lots of retail money piled into this one in the last few months, a breakout of this bull flag will likely be followed by a parabolic move.
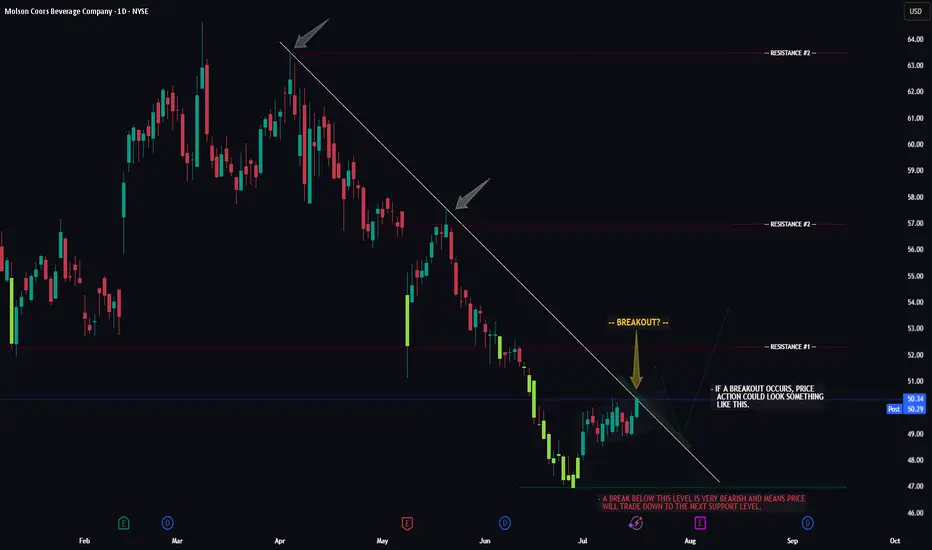
TAP -- Breakout Attempt -- Target LevelsHello Traders!
The chart of TAP (Molson Beer co.) is currently flirting with a major resistance trendline. Now whether or not price can successfully seal the deal and make it too third base remains to be seen.
If price does breakout, watch for a potential retrace to the breakout trendline first, then we could see the larger move to resistance level #1.
If price gets rejected and fails to breakout we could see a move below support before it attempts to breakout again.
Thanks everyone and best of luck with your trading journey!
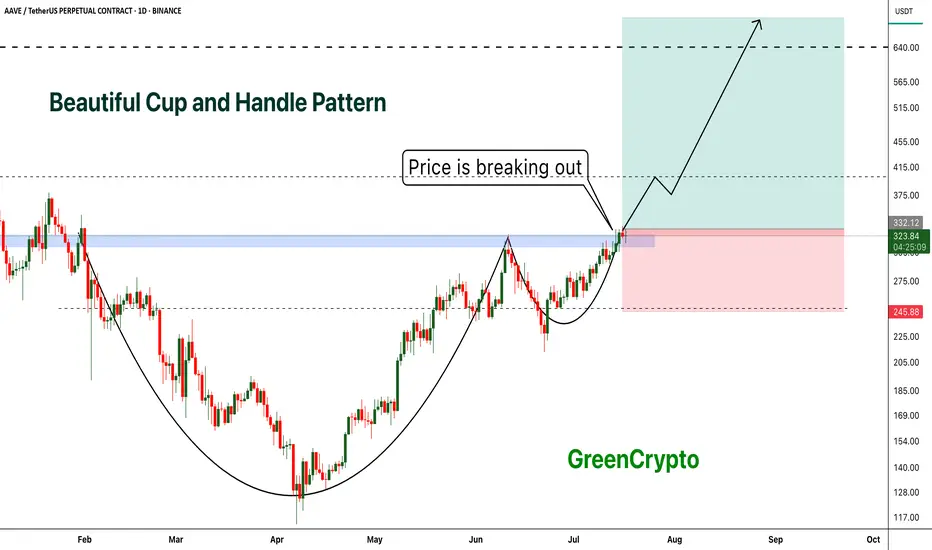
AAVE - Beautiful Cup and Handle Pattern Breakout- AAVE is breaking out from cup and handle pattern finally
- Cup and handle pattern breakout usually results in perfect trend continuation
- A huge long trade opportunity from this
Entry Price: 335 Above
Stop Loss: 245
TP1: 381.89
TP2: 429.16
TP3: 525.94
TP4: 628.78
TP5: 712.89
Max Leverage 5x:
Don't forget to keep stoploss
Cheers
GreenCrypto
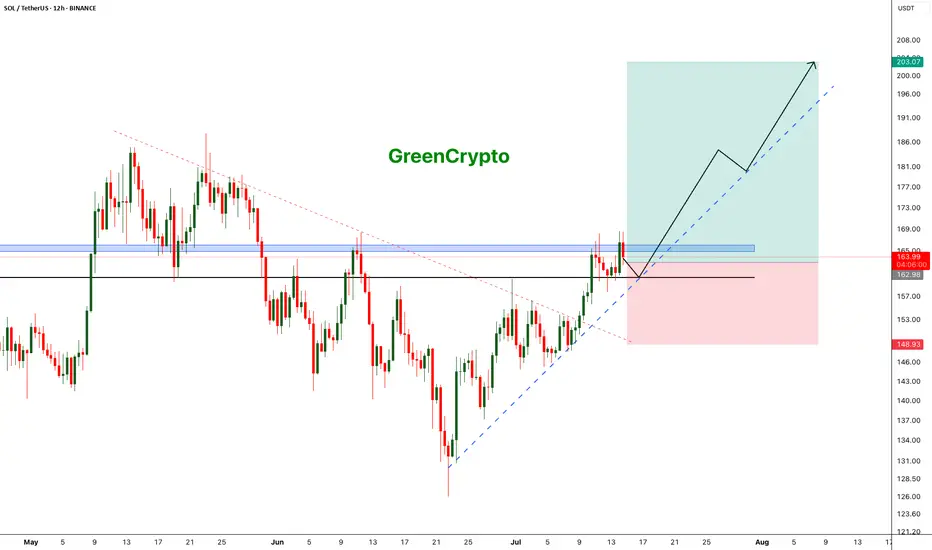
SOL - Excellent Trade Opportunity- Trade is giving us a trade with huge potential with huge risk reward ratio.
- Currently price is heading towards teh support around 160 range and this is strong support zone.
- I'm expecting price to bounce back from this zone and head towards the next target of 200 range
Entry Price: 163
StopLoss: 148
TP1: 172
TP2: 182
TP3: 200
Stay tuned for more updates.
Cheers
GreenCrypto
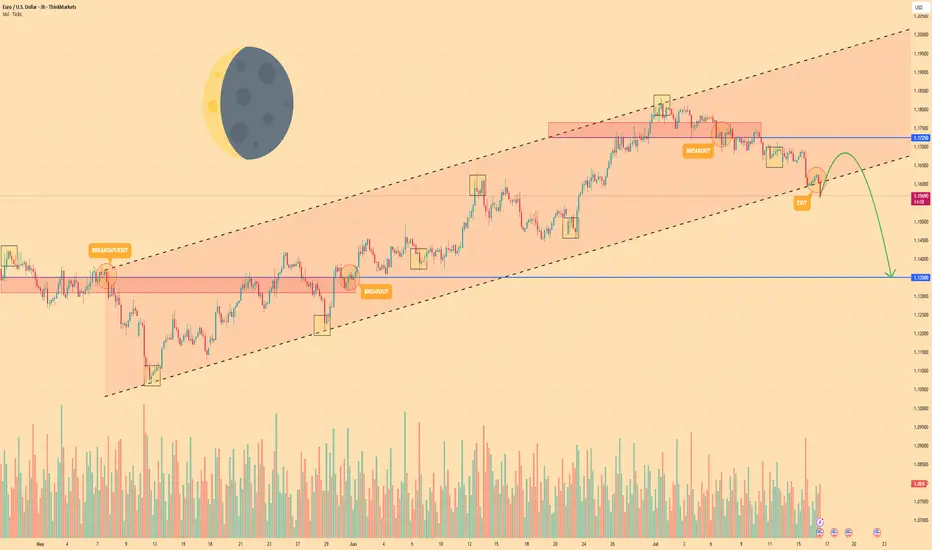
EURO - Price may drop to $1.1350 support level Hi guys, this is my overview for EURUSD, feel free to check it and write your feedback in comments👊
Euro began its journey by breaking into a rising channel off the swing low near $1.1080, establishing a clear uptrend.
Within this channel, price carved out steady support along the lower trendline, touching $1.1350 before buyers stepped.
Mid-channel, two breakout attempts at $1.1550 and $1.1725 highlighted bullish conviction, yet both retreated back below resistance.
Simultaneously, two exit signals appeared near the upper trendline around $1.1765, showing that upward momentum was losing steam at key inflection points.
Currently, EUR is holding just below the channel base after a minor bounce, consolidating as traders weigh the next move.
I foresee a brief climb toward near $1.1670 before a renewed bearish thrust drives price back down to test $1.1350 level.
If this post is useful to you, you can support me with like/boost and advice in comments❤️
Disclaimer: As part of ThinkMarkets’ Influencer Program, I am sponsored to share and publish their charts in my analysis.
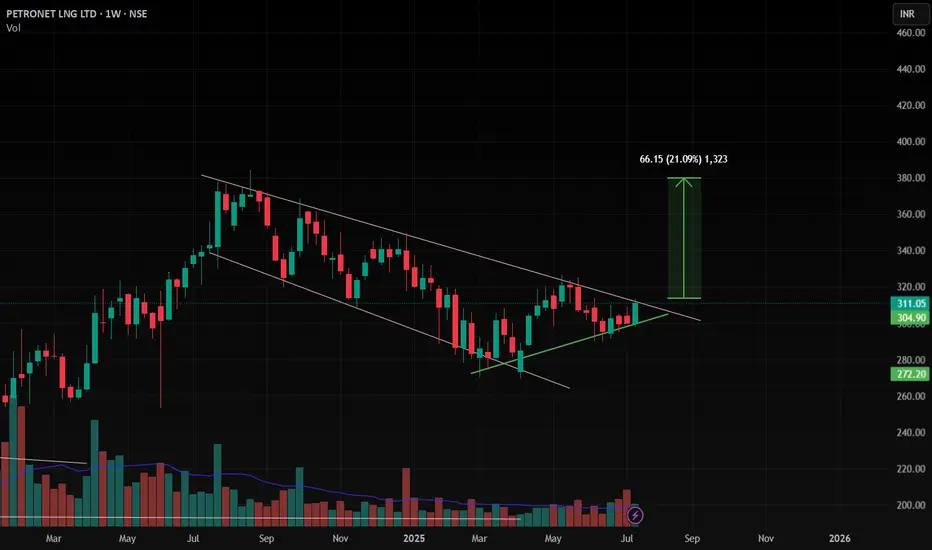
Petronet , 1W , BullishAs the Pattern is Formed and Ready for Breakout , enter after strong candle close in weekly Timeframe and put SL below Swing low . follow proper risk management
follow for more swing ideas like this
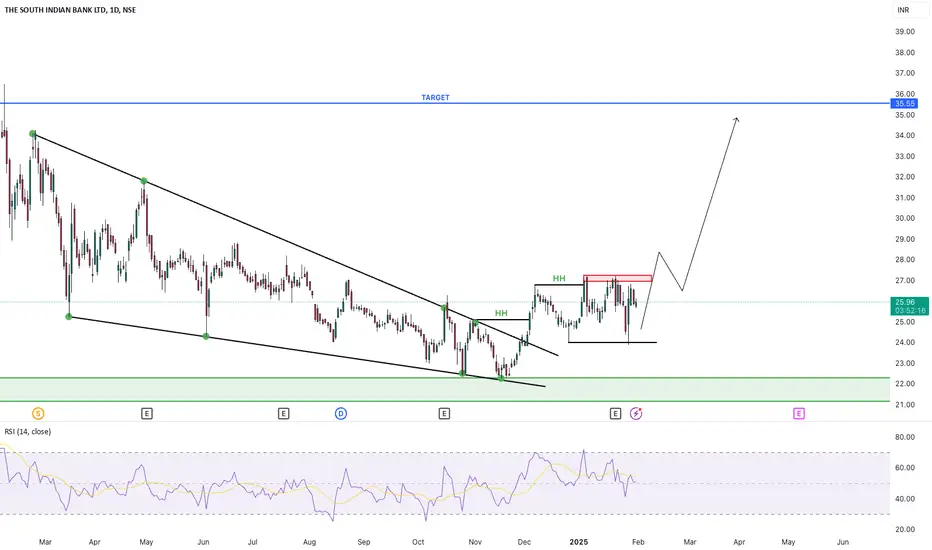
SOUTHBANK - BUY SOUTHBANK - BUY NOW
Key points :
South Indian Bank strong Fundamentals .
Stock PE - 5.47
Industry PE - 10.8
Stock Price Trade at Below Book Value ..
Company Price - Possible to Double
Technical :
Monthly - Take Support
Day - Symmetrical Triangle Pattern Breakout
Entry - 25.45 Rs
Target - 35.55 Rs
Stoploss - 21 Rs
Expected - 39 %
This is Only for My Trade Setup . Dont follow Blindly . Take Educational Purpose Only .
We not any responsiblities for Profit and loss ..
Thank You . Happy Trading ..
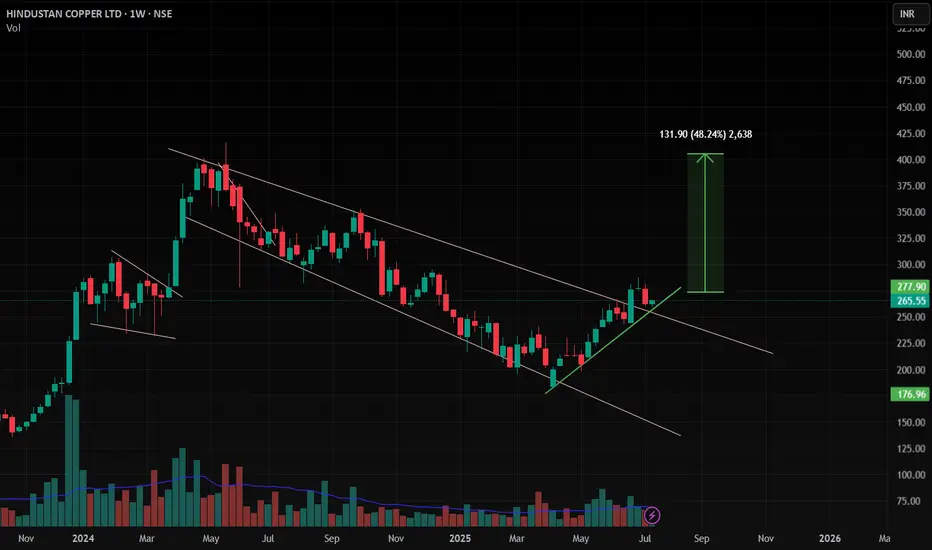
HINDCOPPER , 1W , Bullishthe Pattern is already broken out and now it is at Retest point wait patiently for strong close in weekly . then enter with proper risk management , keep SL below its Swing Low
Follow for more Swing ideas like this
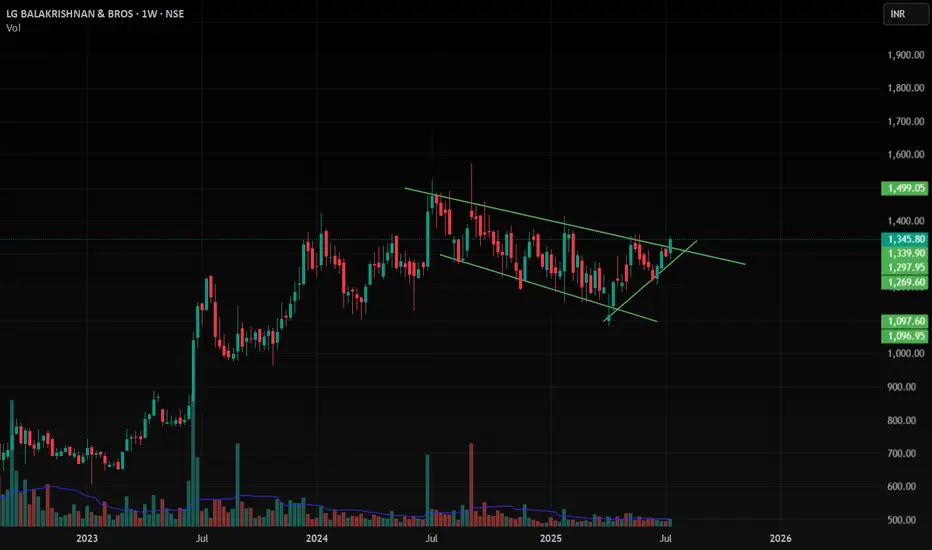
LGBBROSLTD , 1W , Bullish NSE:LGBBROSLTD as the channel pattern is Broken , wait for proper Close in Weekly then enter with proper risk management ,
put SL below its swing low
Follow for more swing ideas like this
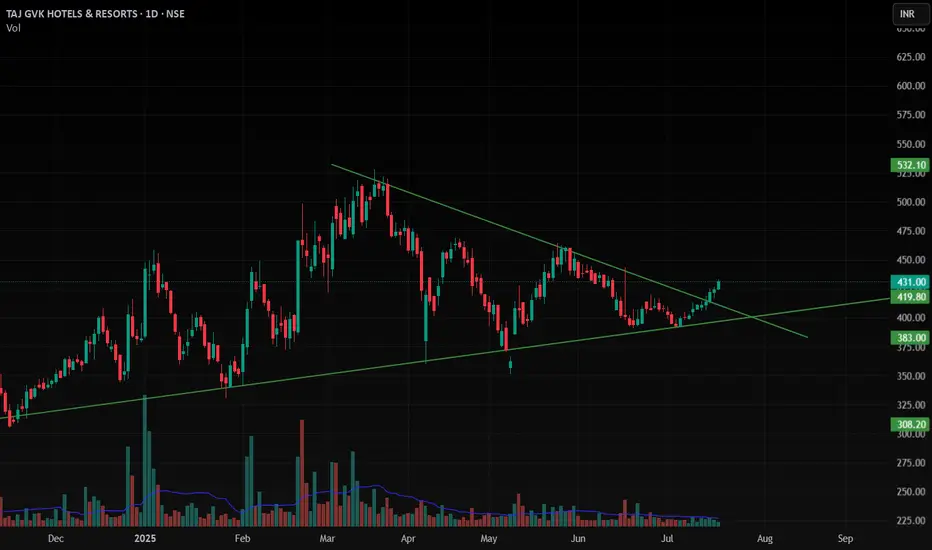
TAJGVK , 1D , Bullish as this stock given breakout from the Triangle Pattern with Good Volume , this stock is ready to Enter .
put SL below its swing low
follow more swing ideas like this .