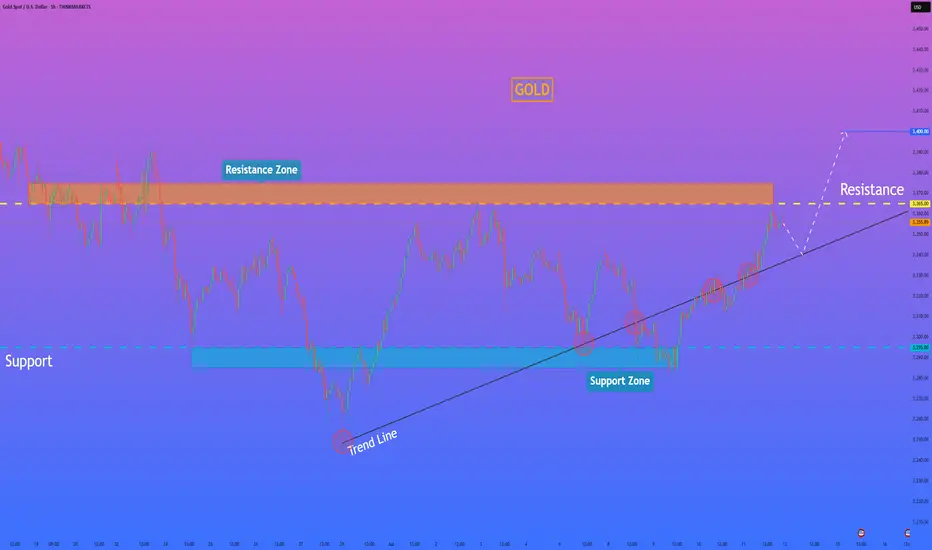
HelenP. I Gold will break resistance level and continue to growHi folks today I'm prepared for you Euro analytics. After a strong bullish impulse, the price managed to break above the local resistance zone and reach the 3365 level. This zone had previously acted as a barrier for upward movement, but now the price is consolidating just below it, forming a possible correction setup. I see that price followed a clear trend line during its recent rally, and multiple times this line acted as dynamic support. The buyers respected it and entered the market with each touch. Currently, Gold is hovering near the upper boundary of the resistance zone. I expect that before continuing to grow, the price may make a slight correction toward the trend line, using it again as a support for a potential rebound. This would also allow the market to gather more liquidity before targeting new highs. Once the correction completes and the trend line holds, I expect gold to rise again, break through the 3365 resistance level, and continue its upward movement toward 3400 points, which is my main goal for this setup. Given the strong trend, the bullish impulse, and clear support from the trend line, I remain optimistic and anticipate further growth. If you like my analytics you may support me with your like/comment.❤️
Disclaimer: As part of ThinkMarkets’ Influencer Program, I am sponsored to share and publish their charts in my analysis.
Breakout
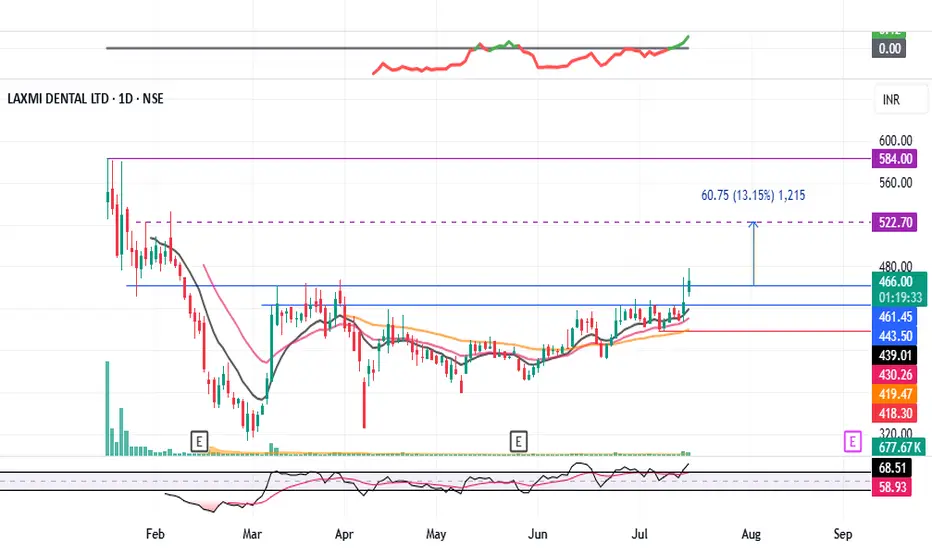
LAXMIDENTL : Consolidation Breakout#LAXMIDENTL #breakout #breakouttrading #ipostock
LAXMIDENTL : Swing Trade
>> Consolidation Breakout
>> Volumes Building up
>> Stock in Momentum
>> Good Strength in stock
>> Trending setup
Swing Traders can lock profit at 10% and keep trailing
Pls Boost, Comment & Follow for more analysis
Disc : Charts shared are for Learning purpose not a Trade Recommendation, Take postions only after consulting your Financial Advisor or a SEBI Registered Advisor.
Elliott Wave Analysis of Usha Martin USHAMARTThe script is currently in (v) of 3rd wave on daily time frame. This should be followed by a short retracement and then a 5th wave up. Will keep updating this chart as it progresses.

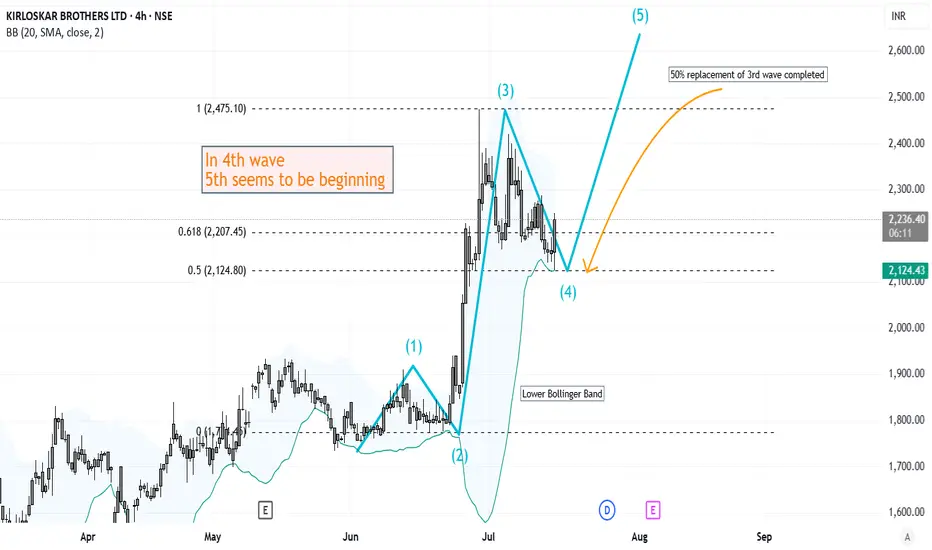
Elliott Wave Analysis of Kirloskar Brothers KIRLOSBROSThe script is currently in 4th wave of hourly chart. The 4th wave seems to be ending, which means a 5th wave will start from here. The wave patters and patterns, retracements and analysis have been highlighted on the chart. Will update this as it progresses.
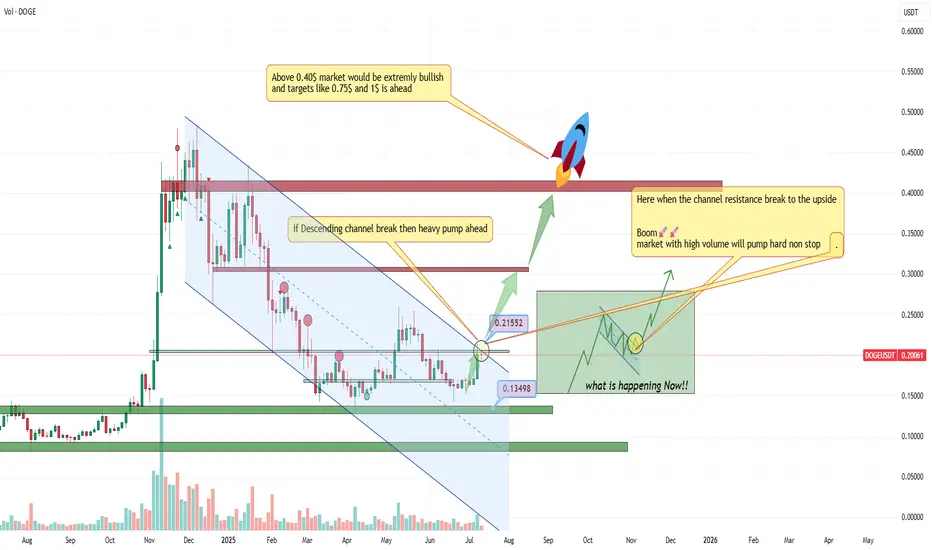
Wooow DOGEUSDT breakout happening Major resistance which is 0.22$ and is also channel resistance is breaking and BINANCE:DOGEUSDT would be nonstop bullish after that at least for a while to the targets like 0.40$ and 0.60$.
As we can see on the chart here is last valid and strong resistance zone after that i am expecting nonstop rise for This token which is still sleep and soon will follow the market and also lead with daily +15% candles.
DISCLAIMER: ((trade based on your own decision))
<<press like👍 if you enjoy💚
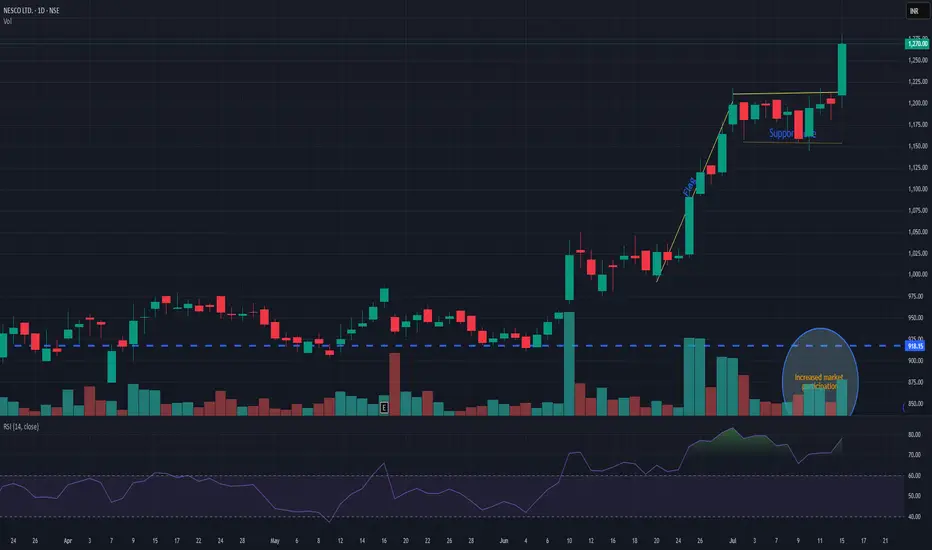
NESCONESCO giving flag pattern breakout with decent volume. Support is seen nr 1180. while pole initiation can be seen near 1010. Currently trading near 1270. It has a potential for new momentum. Keep it on radar.
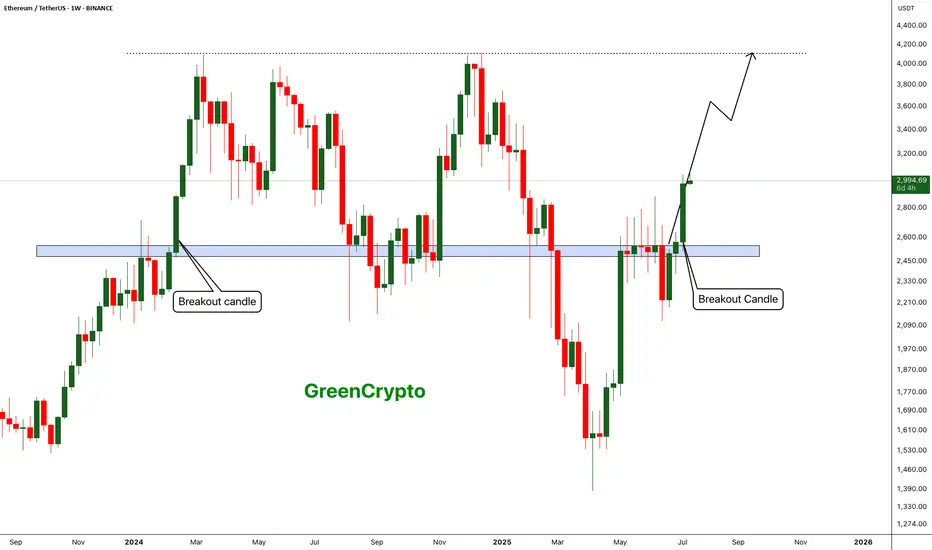
ETH - Confirmed target is 4100- After successfully breakout from the major resistance price is heading towards the next resistance line.
- From the previous all time high, we have a clear resistance around 4100 range.
- We can expect this bullish trend to continue easily and reach the next resistance around 4100.
Stay tuned for more updates
Cheers
GreenCrypto
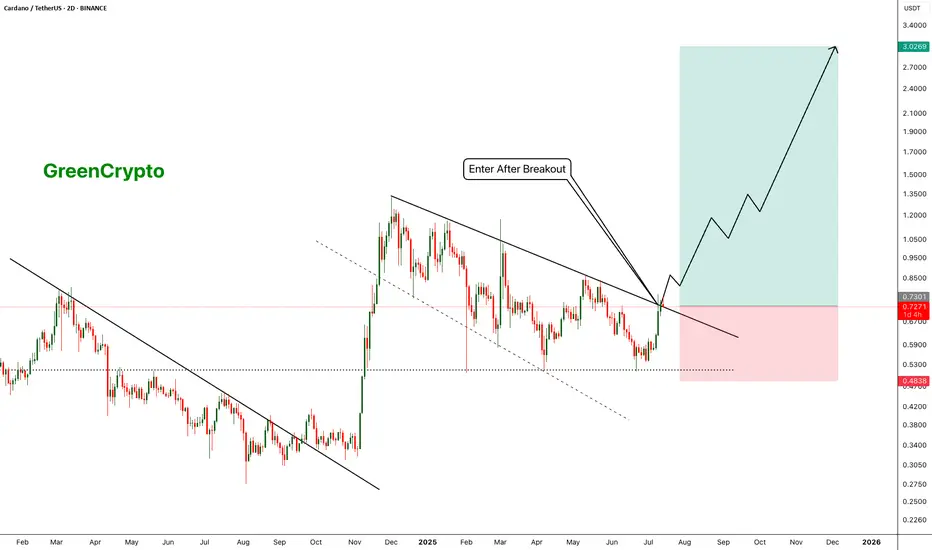
ADA - Beginning of something crazy- ADA is looking forward to the successfully breakout of the trendline resistance.
- A clean breakout from this resistance must to fuel the bullish trend.
- I'm expecting a target of 3$ from this trend.
Entry Price: 0.72
Stop Loss: 0.4838
TP1: 0.8602
TP2: 1.0342
TP3: 1.3379
TP4: 2.0144
TP5: 2.4818
TP6: 3.0329
Stay tuned for more updates
Cheers
GreenCrypto
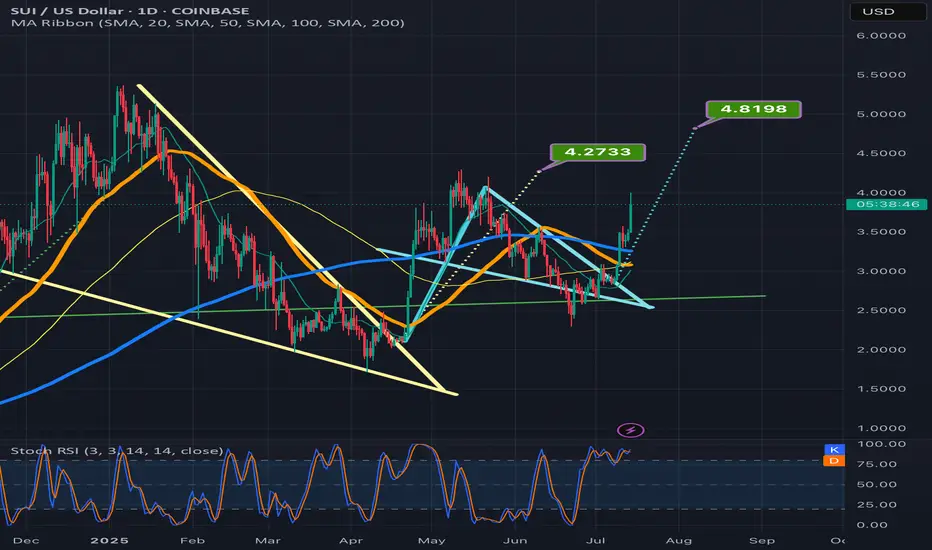
SUI on its way to the teal pennants breakout targetSui has joined the bullishness here as it has brown up from the pennant and well on its way to the target. *not financial advice*
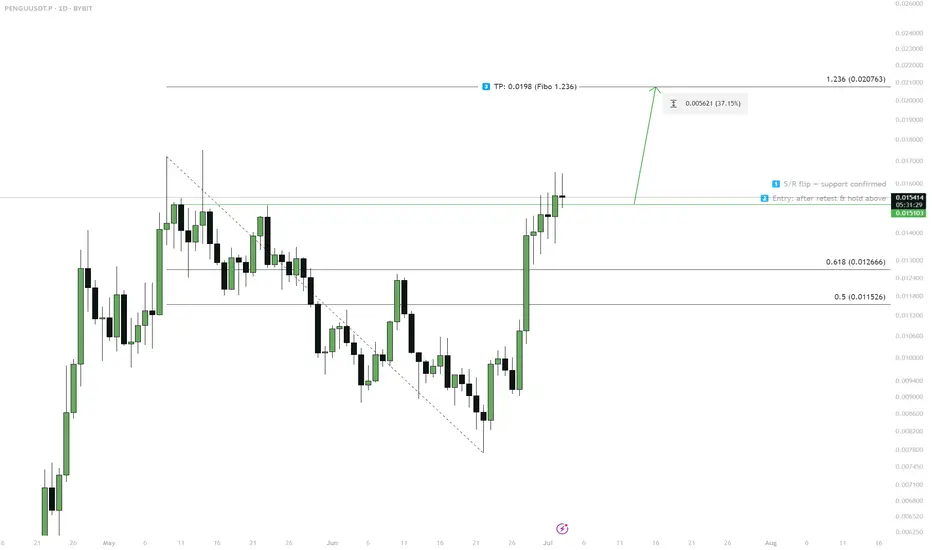
PENGU — S/R Flip & Breakout Scenario1. S/R flip at 0.0151 — wait for retest
2. Enter on successful hold above 0.0151
3. Target: 0.0198 (Fibo 1.236)
4. If fails to hold above 0.0151 — scenario invalid
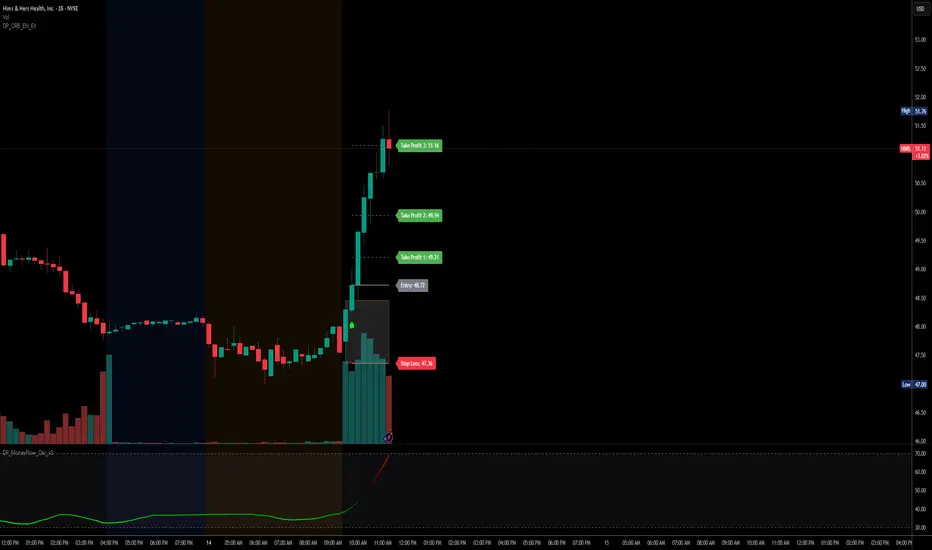
$HIMS - ORBCLEAN breakout for NYSE:HIMS today.
DP_ORB Indicator marked it at candle close outside of ORB Zone, with confirmation bias from a higher high, and volume. All take profits were hit!
If you want the DP_ORB Indicator for FREE:
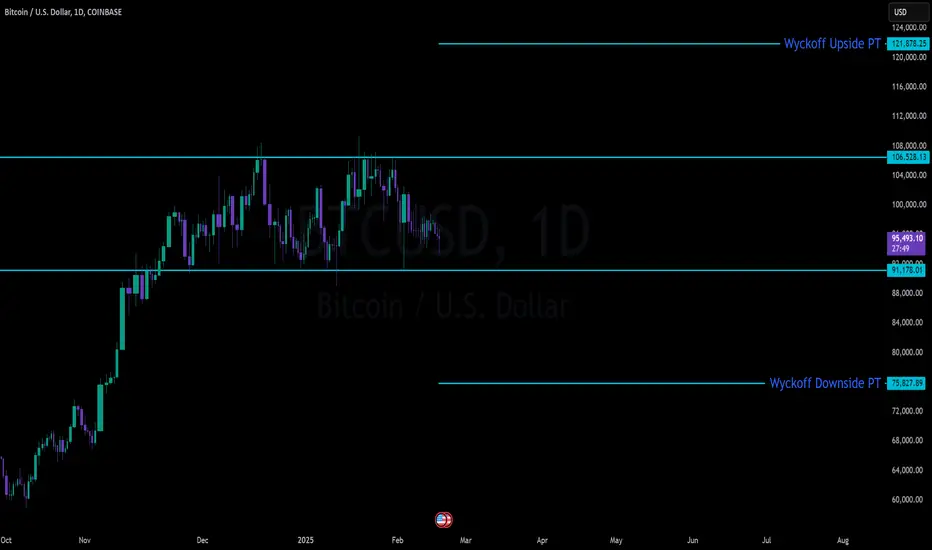
BTC Massive SetupConsolidation for months between 91k and 106k
- Classic Wyckoff setup as an accumulation/distribution
- Price targets of: 121.878 (122k is the popular target) to the upside with 75,827 on the down
- Saylor today put out news to be raising another $2 billion to buy BTC. Either he is going to be able to hold the floor or get washed out
- Trade can be taken with confirmation of breakout on either side pretty easily as momentum will be so strong that being on the wrong side will most likely be an immediate stop out
FET/USDT – Head & Shoulders Breakout!Hey Traders — if you're into high-conviction setups with real momentum, this one’s for you.
ONDO is trading inside a falling wedge on the daily chart — a classic bullish structure that often leads to explosive breakouts. 📈
FET just broke out of a classic inverse head & shoulders pattern — a strong bullish reversal structure! The breakout looks clean with a confirmed close above the neckline and volume starting to pick up.
💼 Entry: CMP ($0.75)
🎯 Targets: $0.85 / $0.95 / $1.09
🛑 Stop-loss: $0.705
📈 Risk-Reward: Favorable
🧠 Why it matters:
Clean breakout above resistance
Strong trend reversal structure
Potential for 40%+ move ahead.
💬 Are you in this breakout play or watching from the sidelines? Let’s talk below!
👉 Smash that LIKE and FOLLOW for more real-time setups!

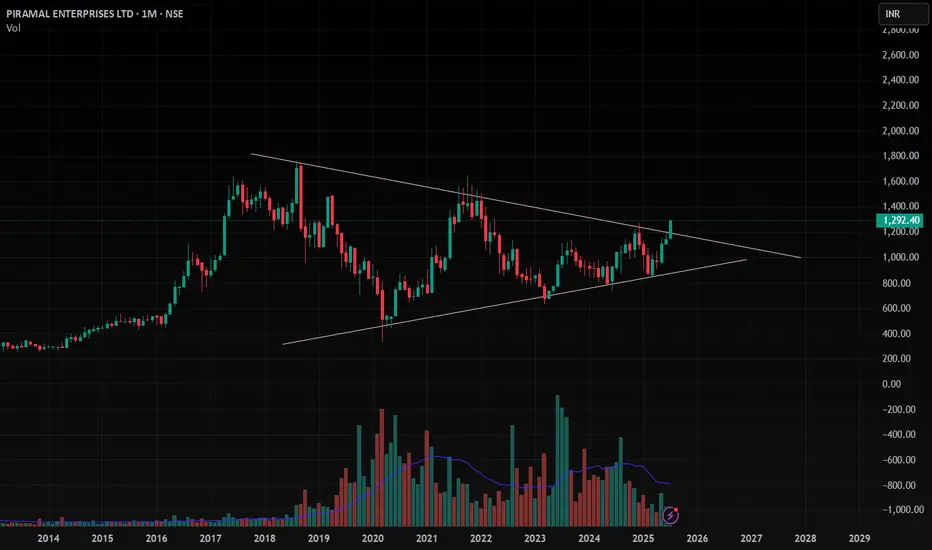
PEL , 1M , BullishThe Triangle Pattern is Breaking Out in Monthly Time Wait for Strong and Perfect close in Weekly Time and Enter after Confirmation .
Take Risk According to your capital
Follow for more ideas like this
New Week on Gold! Will the Bullishness continue?I was bullish on gold and price ended up doing as expected last week and looking for it to continue this week. But i have to sit on hands for now to see how they want to play Monday. Will they move to create a Low for the week first? or will they break out to start early on new highs? I have to see some type of confirmation first. Then we can get active.

FET — AI Market Wake-Up Above $0.801. Watch for breakout & close above $0.80
2. Enter on confirmed weekly hold > $0.80
3. TP: $1.12–1.25 (major resistance)
4. Key support: $0.73–0.71 (must hold)
5. Stop: below $0.71

SYRMA Weekly Breakout | High Volume + 1.5-Year Base Structure🚨 Breakout Alert on SYRMA (Weekly)
After 1.5 years of sideways consolidation, SYRMA has finally broken out with strong conviction. The breakout is supported by the highest weekly volume seen in months — signaling smart money accumulation.
📊 Technical Setup:
🔹 1.5-year base formation now broken
🔹 Breakout candle closed above resistance with strength
🔹 Volume spike confirms breakout validity (HVE)
🔹 Structure resembles classic Stage 2 breakout
🟢 Ideal retest zone: ₹670–₹680
🛑 Support zone: ₹635–₹645
Fundamental Snapshot:
✅ Revenue: ₹2,000 Cr → ₹3,800 Cr in 2 years
✅ Net Profit up 50% YoY
✅ EPS (TTM): ₹9.57
✅ Promoter holding: ~46%
✅ Dominant player in EMS & IoT hardware
⚡Macro trend supports domestic electronics manufacturing — still early in the cycle.

GBP-CHF Bearish Breakout! Sell!
Hello,Traders!
GBP-CHF is trading in a strong
Downtrend and the pair
Broke the key horizontal
Level around 1.0780 which
Reinforces our bearish
Bias and we will be
Expecting a further
Bearish move down
On Monday!
Sell!
Comment and subscribe to help us grow!
Check out other forecasts below too!
Disclosure: I am part of Trade Nation's Influencer program and receive a monthly fee for using their TradingView charts in my analysis.

CAD_JPY BULLISH BREAKOUT|LONG|
✅CAD_JPY broke the key
Structure level of 107.400
While trading in a strong uptrend
Which makes me bullish biased
And I think that after the retest of
The broken level is complete
A rebound and bullish continuation will follow
LONG🚀
✅Like and subscribe to never miss a new idea!✅
Disclosure: I am part of Trade Nation's Influencer program and receive a monthly fee for using their TradingView charts in my analysis.

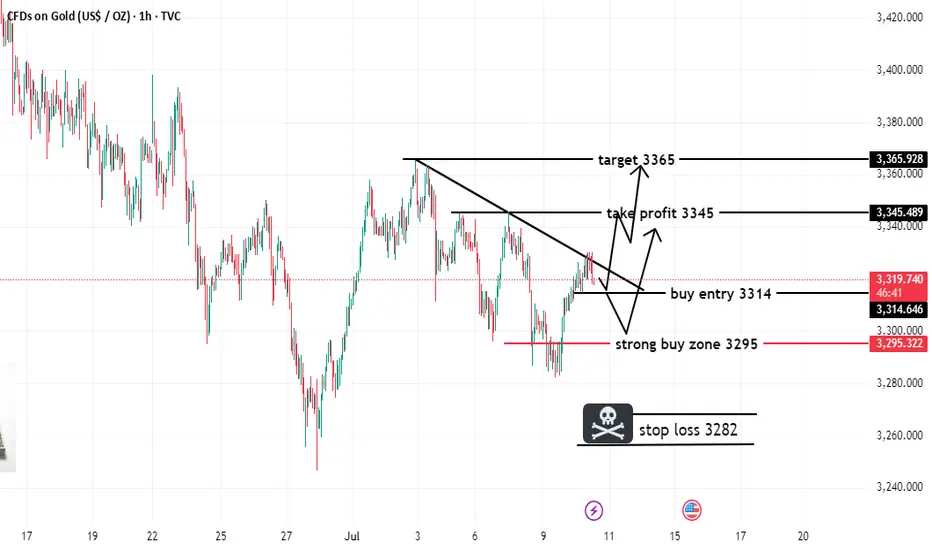
XAUUSD BREAKOUT TRADE (READ CAPTION)hi trader's. what do you think about gold
current price: 3318
gold is breakout bullish trade line gold retest down side. then gold taking support and jump upside
support zone: 3314,3295
resistance zone :3345,3365
stop loss: 3282 market low
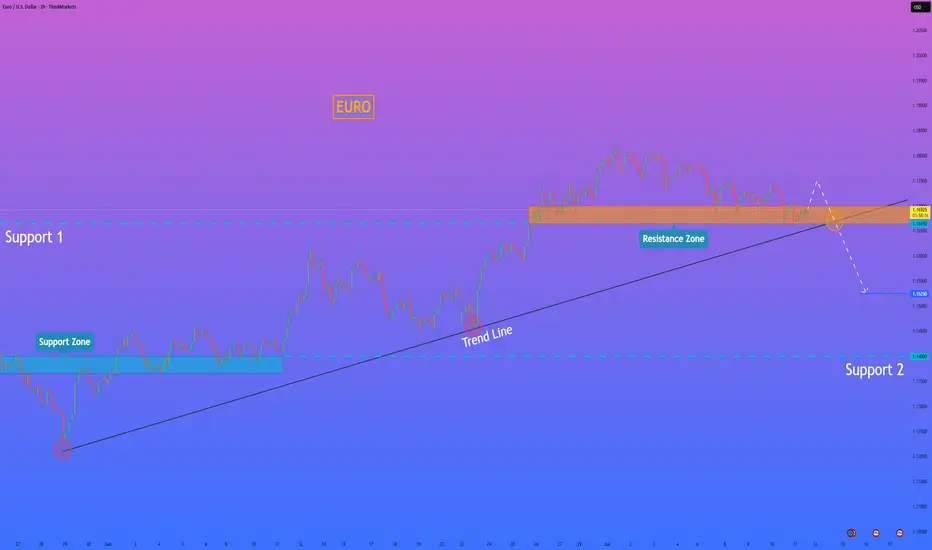
HelenP. I Euro will drop more, breaking the support levelHi folks today I'm prepared for you Euro analytics. After analyzing the current structure of the EURUSD chart, I noticed a strong break of the ascending trend line, which had been respected for a long period. The price has now returned to test the broken trend line from below, aligning with the resistance zone between 1.1665 and 1.1700 points. This area used to serve as solid support, but after the breakout, it turned into resistance. The retest from below could become the final confirmation before the pair continues its downward movement. Right now, EUR is trading just inside this resistance zone. There is a small chance the price might move slightly higher to touch the upper boundary of the zone, but overall, the pressure looks bearish. I expect that after a minor bounce, EUR will decline again, breaking below the local support at 1.1665. Once that happens, a larger impulse down could be triggered, targeting even 1.1525 points, which is my main goal for this setup. This bearish scenario is supported by the failed attempts to recover above the trend line and the fact that previous support has already flipped to resistance. If you like my analytics you may support me with your like/comment.❤️
Disclaimer: As part of ThinkMarkets’ Influencer Program, I am sponsored to share and publish their charts in my analysis.
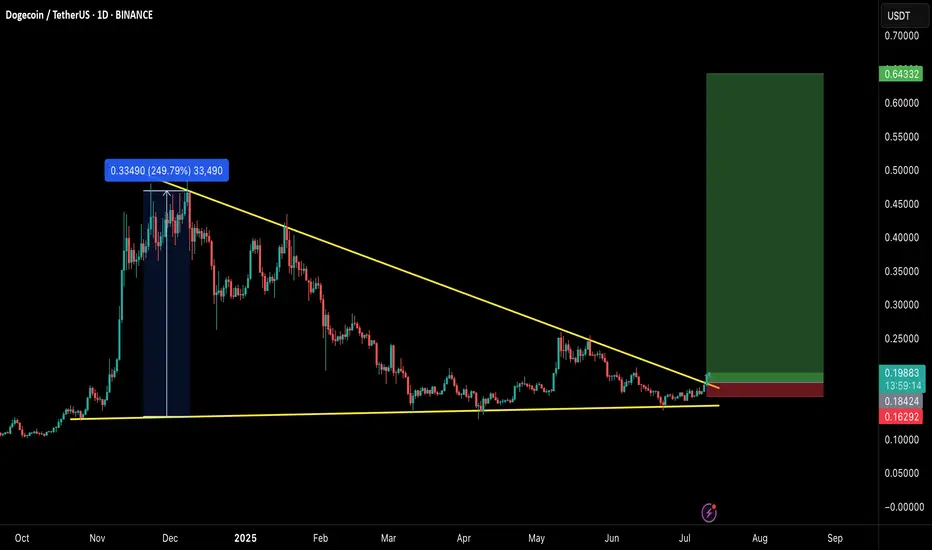
DOGE/USDT – Is Dogecoin About to Ignite Altseason Again?Hey Traders!
If you’re finding value in this analysis, smash that 👍 and hit Follow for high-accuracy trade setups that actually deliver!
Dogecoin just broke out of a multi-month descending wedge — and history tells us to pay close attention when this meme king wakes up. Let’s dive into why this setup could be the start of something massive.
📈 Chart Pattern
DOGE has been consolidating for months inside a falling wedge — a classic bullish reversal structure. It’s now finally broken out with strong volume confirmation, holding above the 50 EMA and showing signs of momentum building up.
🔍 Historical Clue
Remember what happened in the previous bull markets?
✅ 2021: DOGE exploded 2000%+ and triggered the craziest altseason ever.
✅ 2017: DOGE moved first, followed by hundreds of altcoins rallying massively.
Now, in 2025 — it looks eerily similar. Every time DOGE wakes up, it signals that retail and meme sentiment is heating up, a classic altseason ignition.
🎯 Trade Setup
Entry: $0.198 (Already triggered)
Targets:
TP1: $0.28
TP2: $0.42
TP3: $0.64
Stoploss: $0.162
Risk-Reward: Massive upside potential, with clearly defined invalidation.
💡 Final Thoughts
Altcoins are starting to follow. ETH has broken out. XRP is running. BTC dominance has rejected trendline resistance. Everything is aligning. If history repeats, this breakout in DOGE could mark the official start of Altseason 2025.
👉 Don’t sleep on DOGE. This might just be the trigger we’ve been waiting for.
📌 Follow for more setups & insights. Stay tuned!
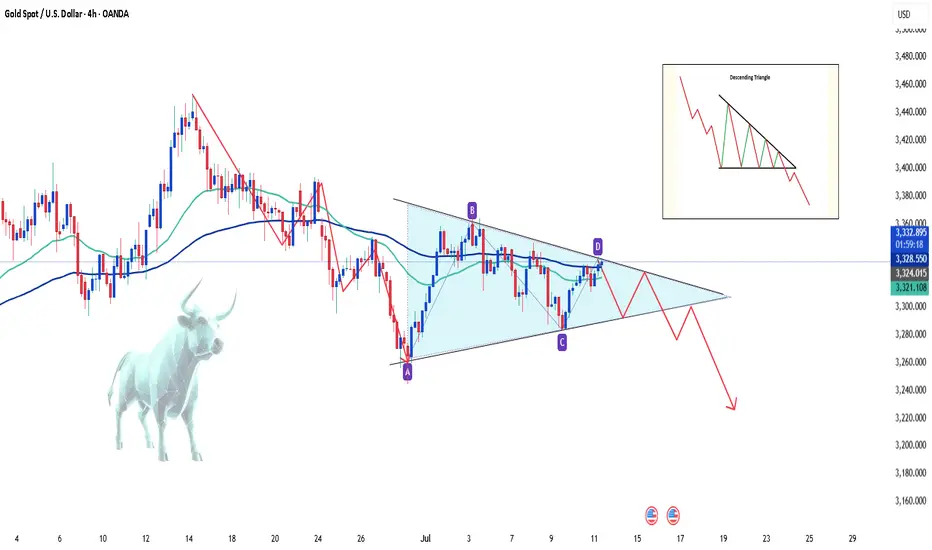
XAUUSD - Sell or Buy ? Hello everyone, great to see you again!
Today, OANDA:XAUUSD remains under notable pressure as the U.S. continues to signal a tougher trade stance. The latest move: the U.S. President announced a 50% import tariff on copper and a potential 200% tariff on pharmaceuticals, following a previous tariff notice ranging from 25% to 40% sent to 14 countries — including Japan, South Korea, Thailand, and Malaysia.
This isn’t just about protectionism. These measures fuel fears of global inflation, supply chain disruptions, and a broader economic slowdown. With surging prices in raw materials and essential goods, consumers may be forced to cut back spending, a classic warning sign for future growth.
In this environment, investors had hoped gold would shine again as a safe haven asset. However, the recent bullish momentum has been underwhelming, signaling ongoing market hesitation.
📉 On the H4 chart, XAUUSD is being squeezed into a descending pattern, which typically carries a high probability of a downside breakout. If the current support fails, the next target could fall below the 32xx area.
On the flip side, if supportive news emerges — such as a hint of rate cuts from the Fed — gold must break above the $3,335 level to revive bullish sentiment.
🔎 What do you think? Will gold break lower — or bounce back? Drop your thoughts below!