Bitcoin Breaks Out – The Final Test Has Begun 🚀🔥 Bitcoin Breaks Out – The Final Test Has Begun 💥📈
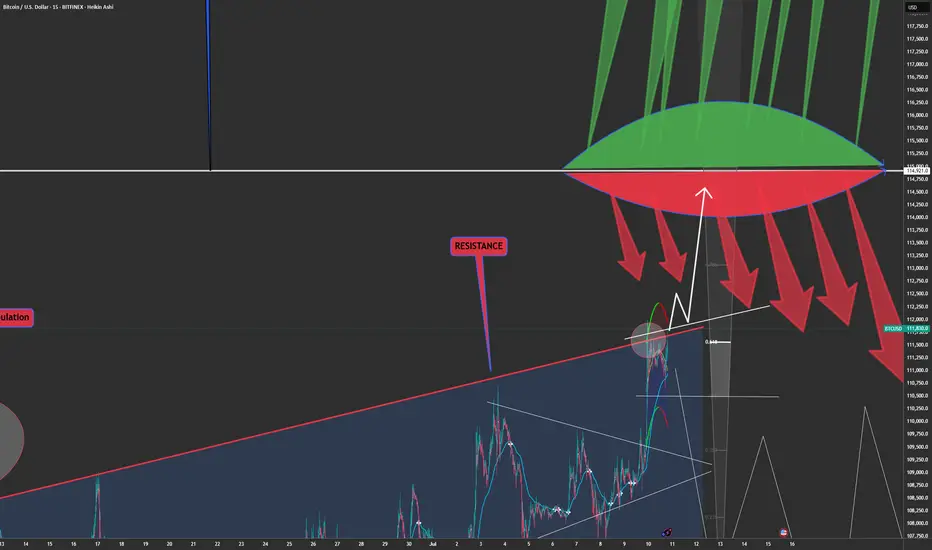
Boom! The breakout is here. After days of grinding under resistance, BTC has finally burst out of the channel — and all eyes are now on the monster level at $114,900.
📊 We spoke about this level again and again — the third macro test, the “HUGE-est Level EVER,” the battleground between Ultimate FOMO and End of Cycle.
⚠️ This breakout could lead to:
✔️ Acceleration to retest 114,900
✔️ A potential 3rd attempt to break the golden structure
✔️ Euphoria or exhaustion — no middle ground
🧠 Smart traders will remember:
– 8+ divergences still exist on higher timeframes
– The risk of failed breakout traps is high
– But this is what we’ve been waiting for: confirmation + continuation
🎯 If momentum holds, we may be on our way to test the upper macro structure. This is not the time to hesitate — it’s time to manage risk like a pro and track the flow.
💡 Catch up on the setup:
👉 Where Can Bitcoin Go? Part 8
👉 July 10th Market Outlook – Uncharted Waters
🗣️ It’s not about prediction — it’s about preparation.
We were ready. Are you?
One Love,
The FXPROFESSOR 💙
Disclosure: I am happy to be part of the Trade Nation's Influencer program and receive a monthly fee for using their TradingView charts in my analysis. Awesome broker, where the trader really comes first! 🌟🤝📈
Breakout
AUD_CAD WILL KEEP GROWING|LONG|
✅AUD_CAD is going up
Now and the pair made a bullish
Breakout of the key horizontal
Level of 0.8980 and the breakout
Is confirmed so we are bullish
Biased and we will be expecting
A further bullish move up
LONG🚀
✅Like and subscribe to never miss a new idea!✅
Disclosure: I am part of Trade Nation's Influencer program and receive a monthly fee for using their TradingView charts in my analysis.

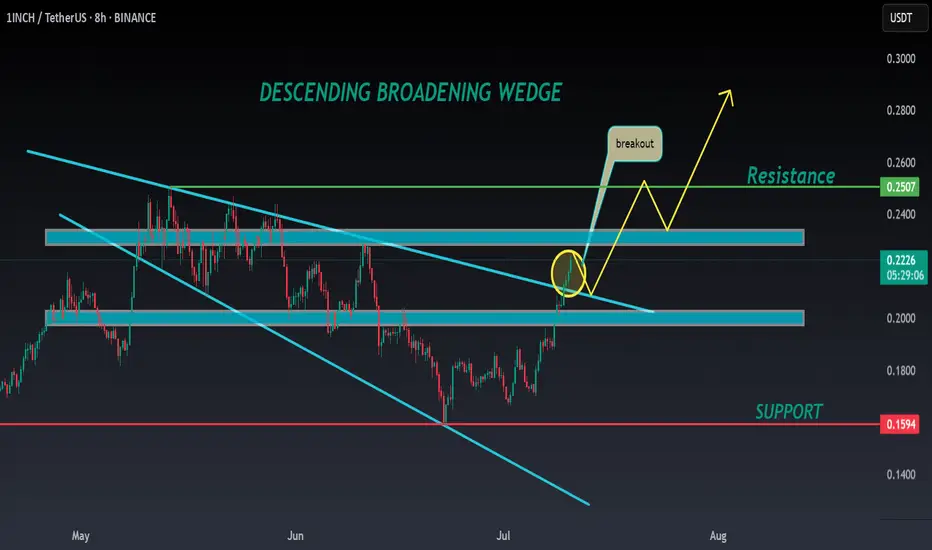
1INCH ANALYSIS🔮 #1INCH Analysis 🚀🚀
💲💲 #1INCH was trading in a Descending Broadening Wedge Pattern, give a perfect breakout and will retests the levels. If the price of #1INCH sustains the breakout then we will see a bullish move. 📈📈
💸Current Price -- $0.2220
📈Target Price -- $0.2510
⁉️ What to do?
- We have marked crucial levels in the chart . We can trade according to the chart and make some profits. 🚀💸
🏷Remember, the crypto market is dynamic in nature and changes rapidly, so always use stop loss and take proper knowledge before investments.
#1INCH #Cryptocurrency #Breakout #DYOR
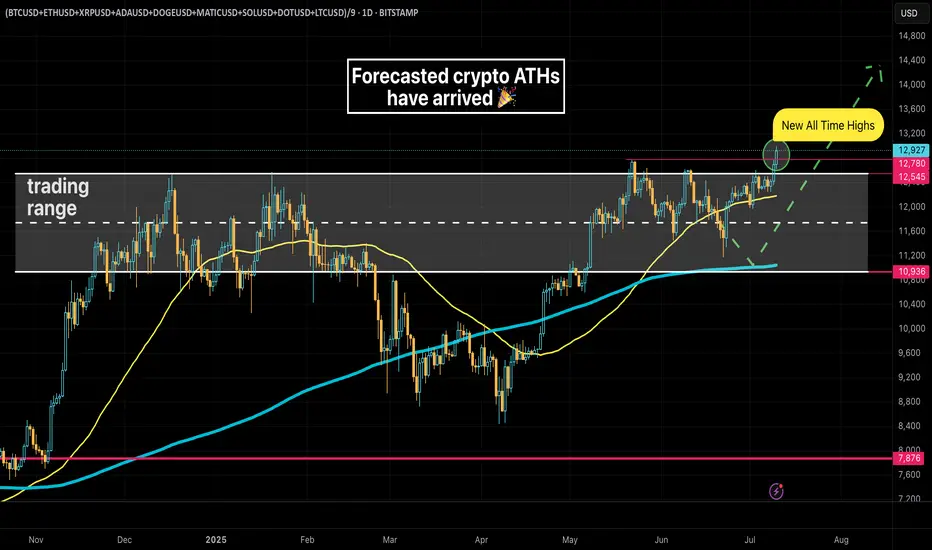
Crypto at All Time Highs! But...Last month I shared a chart of an equal-weight crypto basket suggesting crypto may be on the cusp of fresh All Time Highs -- those highs have arrived! While that is certainly exciting for crypto holders one should take note of other aspects of the rally.
The US Dollar has depreciated substantially against foreign currencies this year (2025)
Bitcoin has yet to reach a fresh high against Gold
Bitcoin is strongly correlated to US equities, which are also at all time highs
USD Decline
The US Dollar is down a whopping 10% against a basket of foreign currencies this year, lead ostensibly by President Trump's raucous political policies, most notably aggressive tariffs across the globe and industries. The crypto rally therefore could be characterized as more of a Dollar softening than a crypto strengthening.
Bitcoin v Gold
Bitcoin - still the epicenter of all things crypto has not topped Gold.
Gold in fact has been on a heater of late against the Dollar.
Many folks still regard Gold as "real money". As such crypto could be said to be in a "stealth bear market", especially considering the declining momentum against Gold while failing to match its highs.
Bitcoin v Stocks
Bitcoin is also strongly correlated to US equity performance, despite claims that it's a hedge. The correlation has only grown stronger as Bitcoin's price against the Dollar has soared.
That said, it does consistently outperform equities, as long as the music is still playing!
Closing Thoughts
Most people likely don't care about how Bitcoin is faring against Gold. Bitcoin, the highest quality form of crypto is itself still highly speculative. While an equal-weight basket of cryptos is impressively reaching an all time high against the Dollar, coins with smaller market caps will surely be the first to go when this speculative impulse subsides.
There's probably still some gas in the tank at this point, but now is a good time to consider trimming positions before you miss the chance 🤑
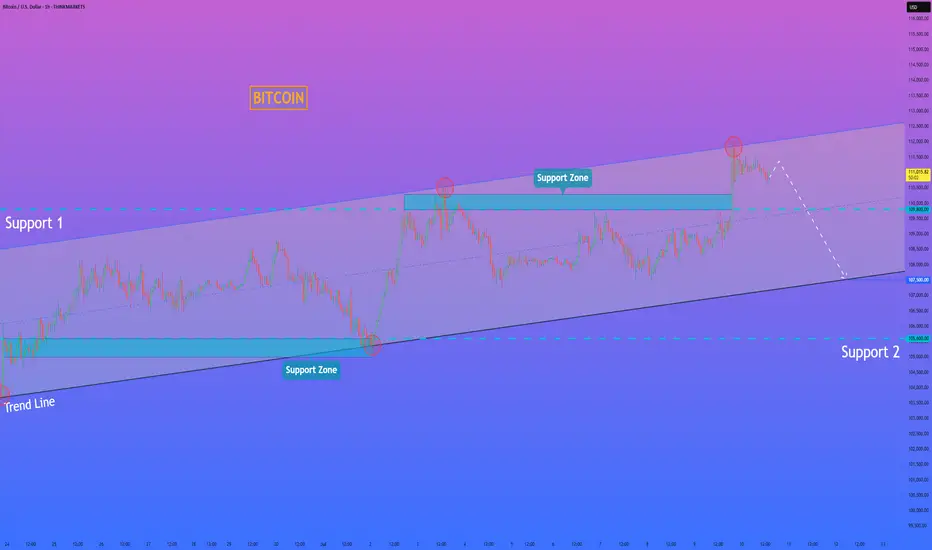
HelenP. I Bitcoin can continue to fall and break support levelHi folks today I'm prepared for you Bitcoin analytics. If we look at the chart, we can see that Bitcoin has been trading inside a well-defined upward channel. The price recently touched the upper boundary of this channel for the second time and formed a clear reaction, indicating strong resistance. After this, BTCUSD started to pull back from the resistance zone around 110300 - 109800 points. At the moment, it is trading slightly above this support area, but momentum is already shifting downward. Given this structure, I believe Bitcoin is likely to continue its decline and break below the support zone. The previous upward impulse has already lost steam, and there are no signs of strong buying activity around the current levels. The next logical target in this scenario is the lower boundary of the channel, near the 107500 level, where the trend line acts as dynamic support. This level has historically served as a rebound point, and I expect it to do so again. My current idea is short, aiming for a move down toward the trend line. If BTCUSD breaks through the first support and confirms the weakness, the price could fall quickly and test the next support area around 105600 - 105000 points. But for now, I will be watching the 107500 level closely. If you like my analytics you may support me with your like/comment ❤️
Disclaimer: As part of ThinkMarkets’ Influencer Program, I am sponsored to share and publish their charts in my analysis.
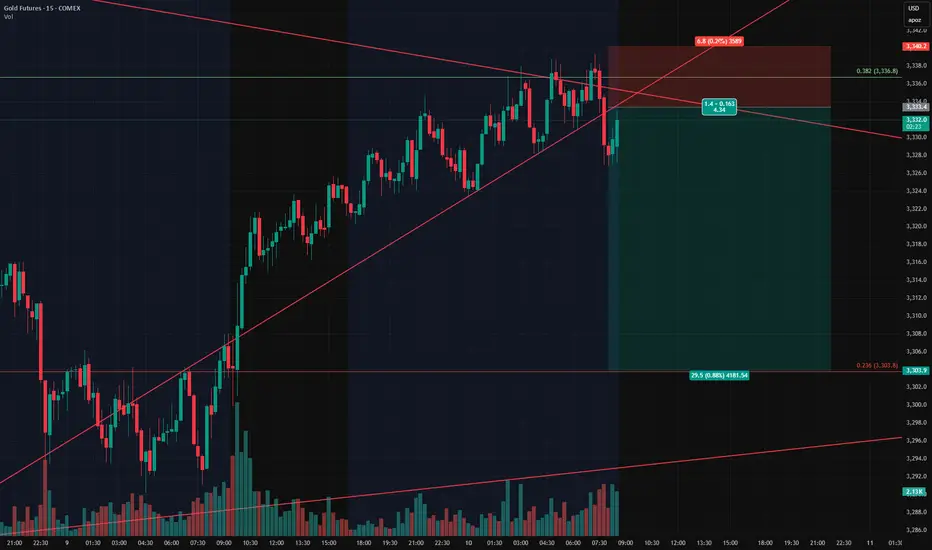
Gold Trade Setup – Long Invalidated, Watching Retest for ShortGold has been consolidating between $3,200 and $3,500, recently pressing against a descending resistance line that has rejected price several times. I was favoring the upside, but our long setup was invalidated — the stop loss at $3,330 was hit.
Price is now retesting ascending support, and I'm shifting focus to a short opportunity, using our previous long entry level (~$3,333) as a key area of interest for entries.
Here’s the updated plan:
Short Entry: Around $3,333
Stop Loss: $3,340
Take Profit: $3,303
Remaining cautious but opportunistic — the larger structure is vulnerable and could break further if support fails.
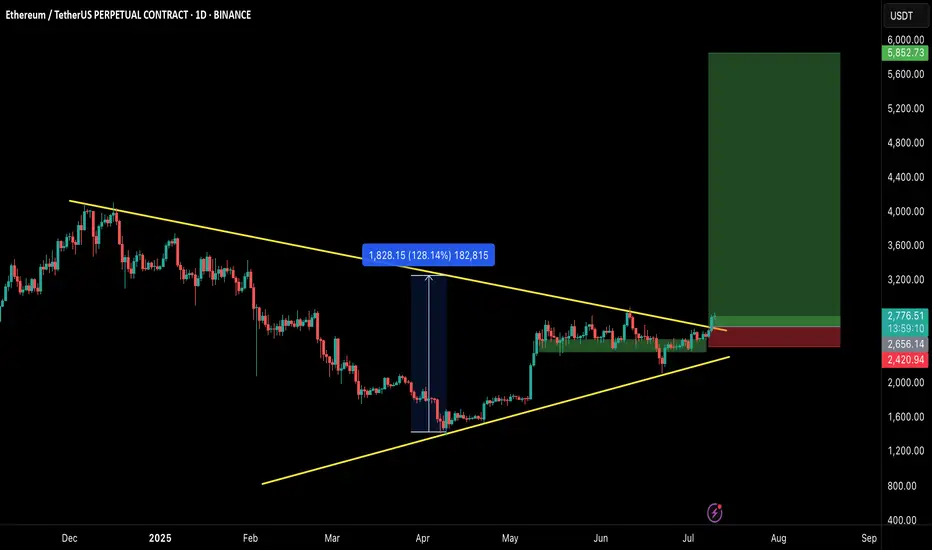
ETHEREUM BREAKOUT CONFIRMED!Hey Traders!
If you’re finding value in this analysis, smash that 👍 and hit Follow for high-accuracy trade setups that actually deliver!
After months of consolidation inside this massive symmetrical triangle, ETH finally breaks out on the daily chart—and this could be the spark for the next major rally! 🔥
📈 Structure: Symmetrical Triangle
✅ Breakout Confirmed
📍 CMP: ~$2,760
🎯 Next Major Target: $5,000+
This is the breakout bulls have been waiting for! If momentum sustains, ETH could enter price discovery territory soon. Buckle up—the real move might just be beginning. 🚀
Let’s see how far it runs from here!
Drop your targets in the comments 👇
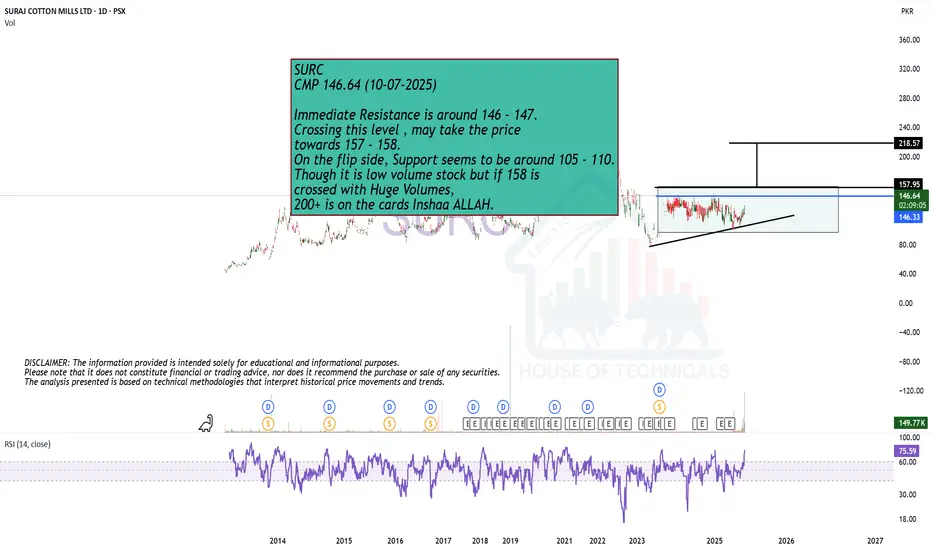
Breakout Expected.SURC
CMP 146.64 (10-07-2025)
Immediate Resistance is around 146 - 147.
Crossing this level , may take the price
towards 157 - 158.
On the flip side, Support seems to be around 105 - 110.
Though it is low volume stock but if 158 is
crossed with Huge Volumes,
200+ is on the cards Inshaa ALLAH.
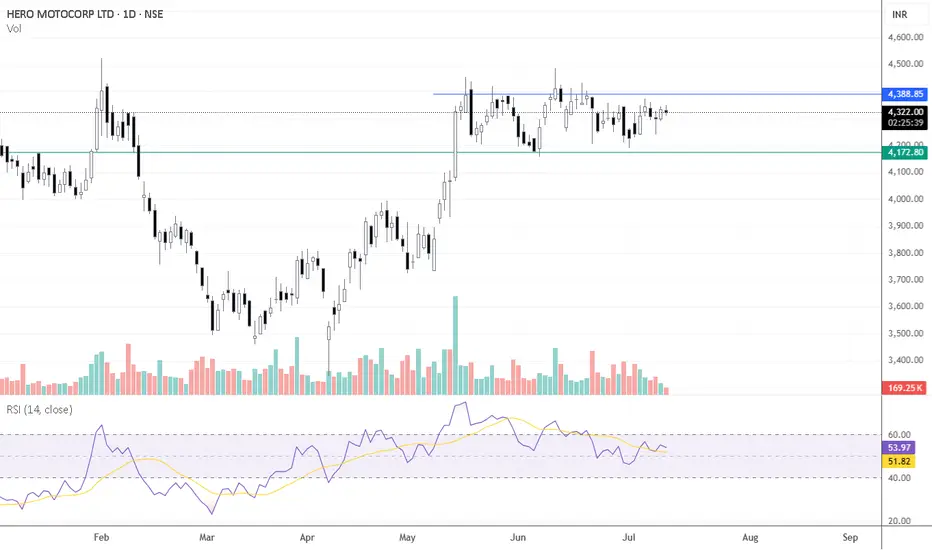
Hero MotoCorp — Daily Chart Breakout Trade SetupHero MotoCorp — Daily Chart Breakout Trade Setup
Range Bound: The stock has been consolidating between ₹4,170–₹4,400 for the past several weeks.
Structure: This is a classic rectangle consolidation, often a continuation pattern.
Volume: Watch for volume expansion on the breakout; prior breakouts lacked follow-through due to low volumes.
Higher Timeframe (Weekly/Monthly) charts show a bullish continuation since mid-May, with high-volume candles across weekly and monthly charts
Key resistance zones: Weekly resistance lies between ₹4,930–₹5,000.
Strong fundamental macro tailwinds: March sales show robust performance in both domestic ICE and EV segments (Vida)
🔍 Key Confirmation Signals for a Potential Trade
✅ Strong daily candle close above ₹4,420
✅ Above-average volume on breakout
✅ RSI crossing 60 on breakout adds momentum confirmation
⚠️ Risk Management Notes
Avoid early entry within the range (false breakouts possible)
Wait for EOD close above resistance for confirmation
Consider a trailing SL once the stock crosses ₹4,500
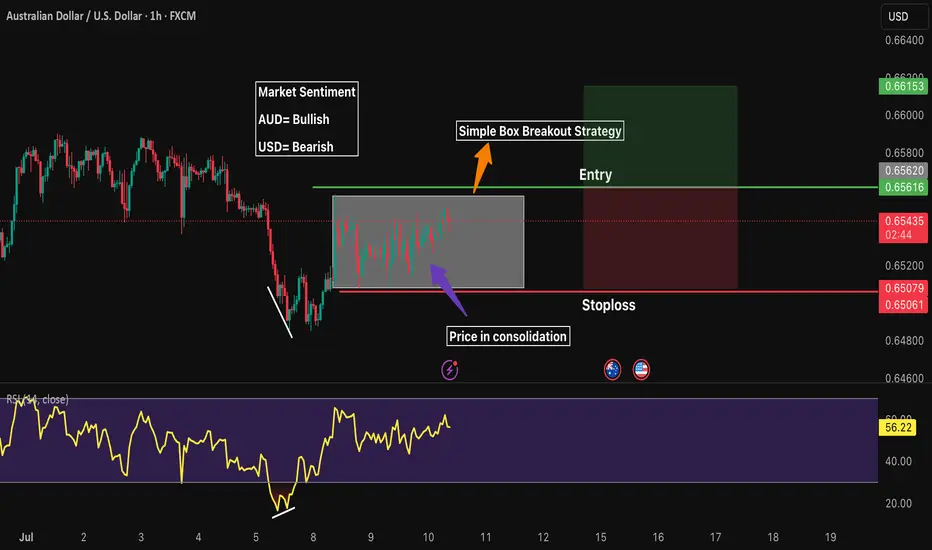
AUDUSD 1H LongMarket Sentiment
AUD= Bullish
USD= Bearish
Waiting for price to breakout from its consolidation box
RR 1:1
Gold Loses Its Shine – Short-Term Sentiment Turns BearishHello everyone, great to see you again for today’s market chat!
The factors that once made gold appealing — inflation fears, economic uncertainty, and the flight to safety — are gradually fading. As confidence grows that the Fed will maintain high interest rates for an extended period, capital is steadily moving away from gold and into more stable, yield-generating assets.
Across the financial community, there’s growing consensus: gold is no longer a top investment priority. The U.S. dollar is gaining strength, Treasury yields are rising, and gold’s support structure is weakening. While investors await the Fed’s next move, many are staying on the sidelines — or even leaning toward a bearish outlook. Notably, the rebound in the DXY is also playing a key role in adding pressure.
Gold is currently lacking momentum, lacking support, and most of all — lacking conviction. At this stage, the trend is no longer a debate, but a widely accepted short-term reality.
What about you — where do you think gold is headed next?

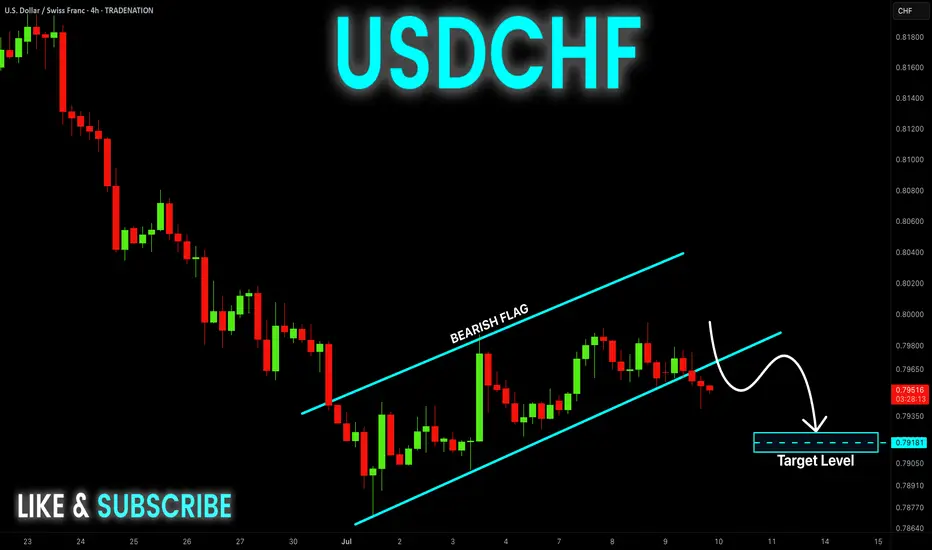
USD-CHF Bearish Flag! Sell!
Hello,Traders!
USD-CHF is trading in a
Downtrend and the pair broke
Out of the bearish flag so
We are bearish biased
And we will be expecting
A further bearish move down
Sell!
Comment and subscribe to help us grow!
Check out other forecasts below too!
Disclosure: I am part of Trade Nation's Influencer program and receive a monthly fee for using their TradingView charts in my analysis.
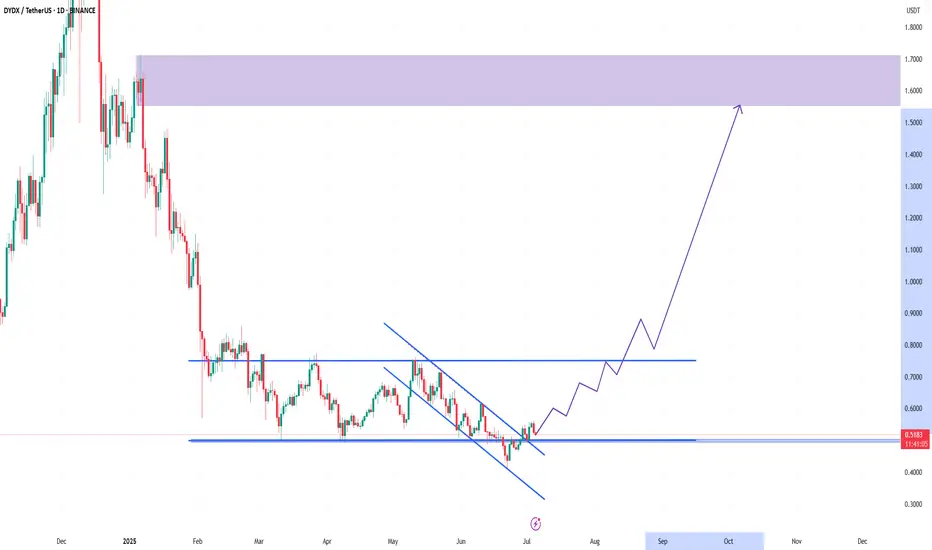
DYDX Breakout from Falling Wedge | Targeting $1.60+# DYDX Breakout from Falling Wedge | Targeting $1.60+
📈 **DYDX/USDT Analysis – Daily Timeframe**
DYDX has just broken out of a falling wedge pattern – a classic bullish reversal formation – after holding a strong support zone around **$0.50**. This zone has acted as a reliable demand area for several months.
---
🔍 **Technical Highlights:**
- ✅ Falling wedge breakout confirmed with daily candle close above resistance
- 🟢 Strong support at $0.50–$0.52
- ⚠️ Horizontal resistance at $0.75 may act as a short-term barrier
- 🚀 Potential rally toward major resistance at **$1.60–$1.70** (target zone)
---
🎯 **Profit Targets:**
- First Target: **$0.75**
- Final Target: **$1.60 – $1.70**
❌ **Invalidation (Stop-loss idea):**
- If price breaks below $0.48 with volume, the bullish scenario may be invalidated.
---
📊 This setup is based on breakout structure and potential trend reversal. If volume confirms, this could be the beginning of a new mid-term uptrend.
💬 Let me know what you think about this setup! Would love to hear your feedback.
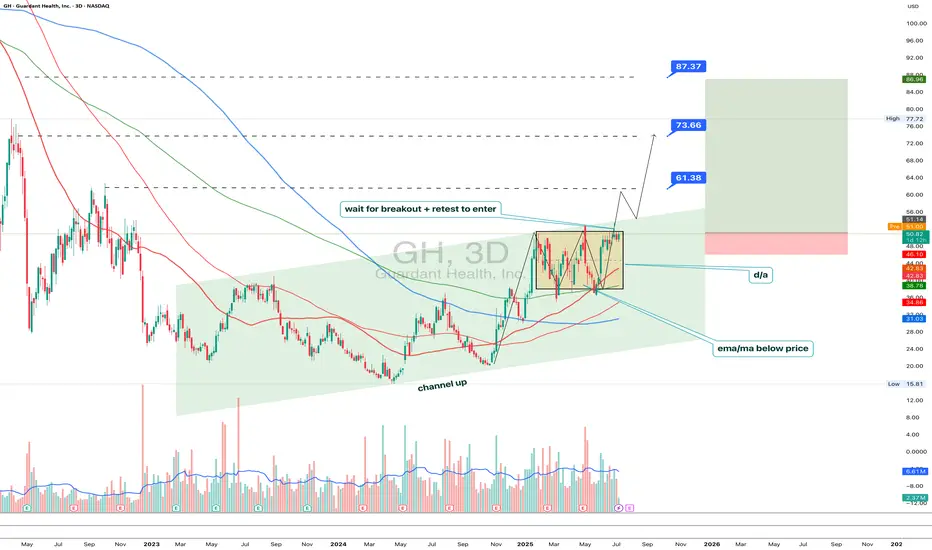
GH 3D: breakout forming inside ascending channelThe price of GH continues consolidating within the top of an ascending channel, confirming bullish structure. The rectangular accumulation has lasted for over three months, with price staying above all major EMAs and MAs - a strong trend confirmation. On the last impulse, volume increased, and now the price is compressing again. A breakout with a retest would serve as a valid entry. First target lies near 61.38, second at 73.66, and third at 87.37 - aligned with the upper range of the medium-term Fibonacci extension. Fundamentally, GH remains a promising biotech pick amid sector rotation and potential Fed easing. EMAs and MAs sit below price, and D/A supports the breakout scenario. Waiting for confirmation before entering.
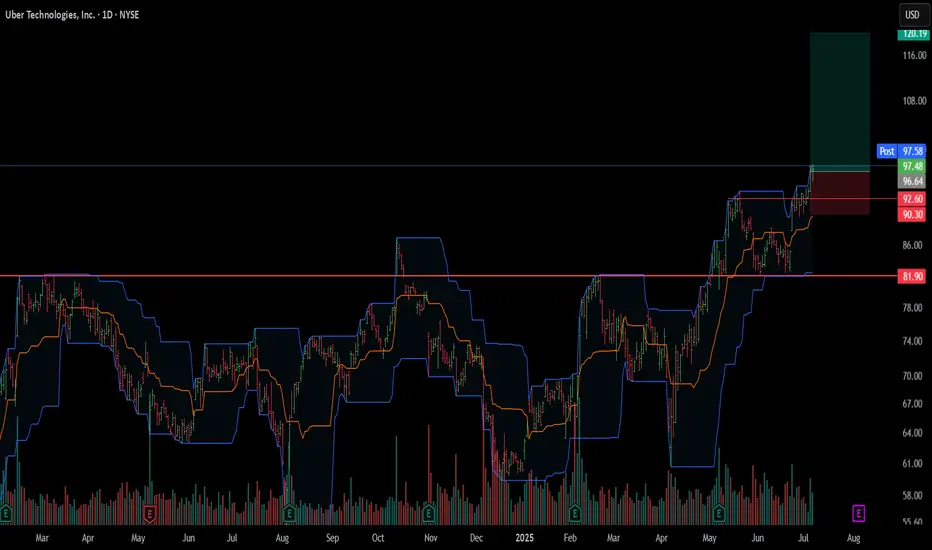
UBER longBroken long term resistance, retested, and once again pushed 20 day Donchian Channel.
Turtles are coming out of their shells taking UBER to the new ATHs.
Long term hold.
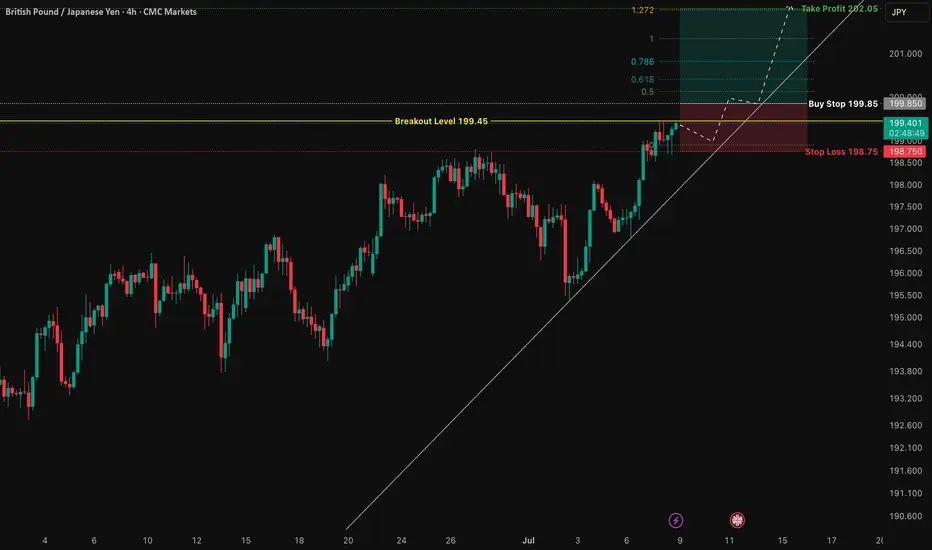
GBP/JPY: Total Confluence Targeting 202.05 BreakoutThis is a high-conviction trade setup based on a powerful confluence of fundamental drivers and multi-timeframe technical alignment. We are anticipating a bullish breakout in GBP/JPY, catalyzed by the upcoming UK GDP data release. The price action has formed a classic "coiled spring" pattern, indicating a significant buildup of energy before a potential move higher.
The analysis is based on pure price action, structure, and macroeconomics. The chart is kept intentionally clean to highlight the strength of the setup itself.
The Fundamental Why 📰
Two core data-driven factors underpin this trade:
1️⃣ Macro Policy Divergence: The primary long-term driver is the stark monetary policy difference between a relatively hawkish Bank of England (BoE), which is still fighting inflation, and an ultra-dovish Bank of Japan (BoJ). This fundamental imbalance creates a natural tailwind for GBP/JPY.
2️⃣ Positive Leading Indicators: Recent economic data from the UK has shown surprising strength. Both the Services and Manufacturing PMIs for June beat expectations, suggesting underlying resilience in the economy. This points to a higher probability of an upside surprise in Friday's GDP figures, which would be the direct catalyst for a breakout.
The Technical Picture 📊
Our confidence comes from a rare "Total Confluence," where every timeframe tells the same bullish story.
The Monthly Chart (Strategic View): Shows a powerful, multi-year uptrend that has decisively broken the critical 8-year resistance from the 2015 highs. The macro trend is undeniably bullish.
The Weekly Chart (The Confirmation): Confirms the uptrend is resuming now after breaking out of a year-long bullish continuation pattern. The "resting" phase appears to be over.
The 4-Hour Chart (The Setup): This is the "coiled spring." Price is consolidating in a very tight range right underneath the key breakout level of 199.45. This shows a lack of sellers and a buildup of buying pressure.
Fibonacci Confluence: Our take profit target is not random. It aligns perfectly with the 1.272 Trend-Based Fibonacci Extension, giving us objective, mathematical confirmation for the target at 202.05.
The Trade Plan ✅
This is a "set and forget" breakout strategy. The order should be placed as a Buy Stop to capture the momentum as it breaks higher.
📉 Asset: GBP/JPY
👉 Entry (Buy Stop): 199.85
⛔️ Stop Loss: 198.75
🎯 Take Profit: 202.05
🧠 Risk/Reward: 1:2
This analysis is for educational purposes. Always conduct your own research and manage your risk appropriately. Good luck.
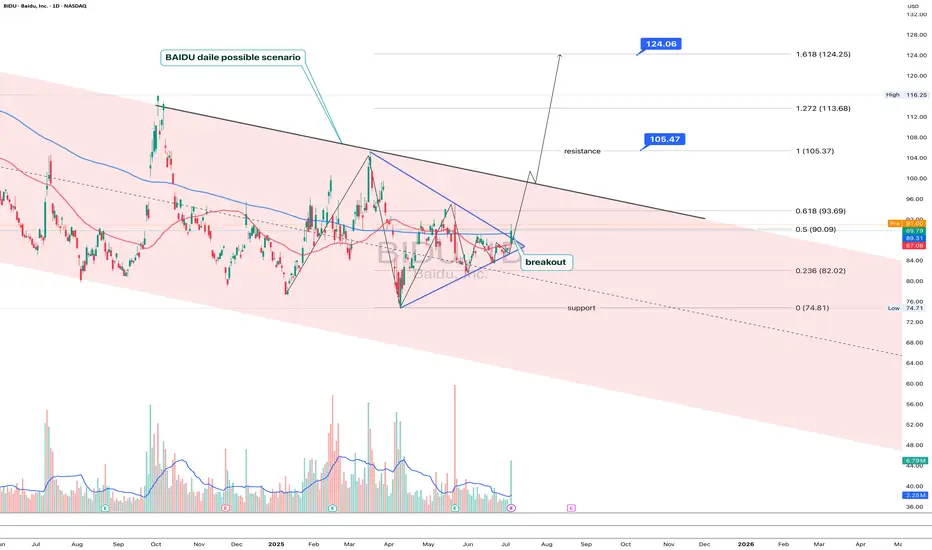
BIDU 1D: triangle breakoutBIDU 1D: triangle breakout + real-world AI deployment boosts bulls
Baidu (BIDU) breaks out of a triangle within a falling channel on the daily chart, with solid volume, reclaim of the 50MA, and approach to the 200MA. $90.09 flips into support. Targets stretch to $105.47 / $113.68 / $124.06 (Fibo levels).
Fundamentally, Car Inc just launched a robo-car rental service powered by Baidu’s Apollo unit. Fully autonomous, bookable for 4 hours to 7 days — this is not future tech, it’s live now. With a $32.6B market cap and low P/E (~12), BIDU looks positioned for revaluation if sentiment shifts.
Tactical setup: entry by market or retest of $90, stop below $82.
When the robot drives customers - you just drive the trade.
Breakout vs Fakeout: How to Spot the DifferenceHello, Traders! 🖖🏻
There’s probably no phrase that triggers more mixed emotions in crypto trading than: “Looks like we’re breaking out!”. Because let’s be honest…For every clean breakout that follows through with momentum…
…there’s a fakeout waiting to trap overconfident entries.
So, how do you tell the difference? Let’s break it down!
🧱 What Is a Breakout?
A breakout occurs when the price moves decisively beyond a key level, such as support, resistance, a trendline, or a range boundary, and holds.
What makes it a REAL breakout?
Volume Expansion: More participants step in as the price moves through the level.
Strong Candle Closes: Especially on higher timeframes like 4H or 1D.
Follow-Through: The market doesn’t just poke above the level. It builds on it.
No Immediate Rejection: You don’t see a sharp wick straight back below.
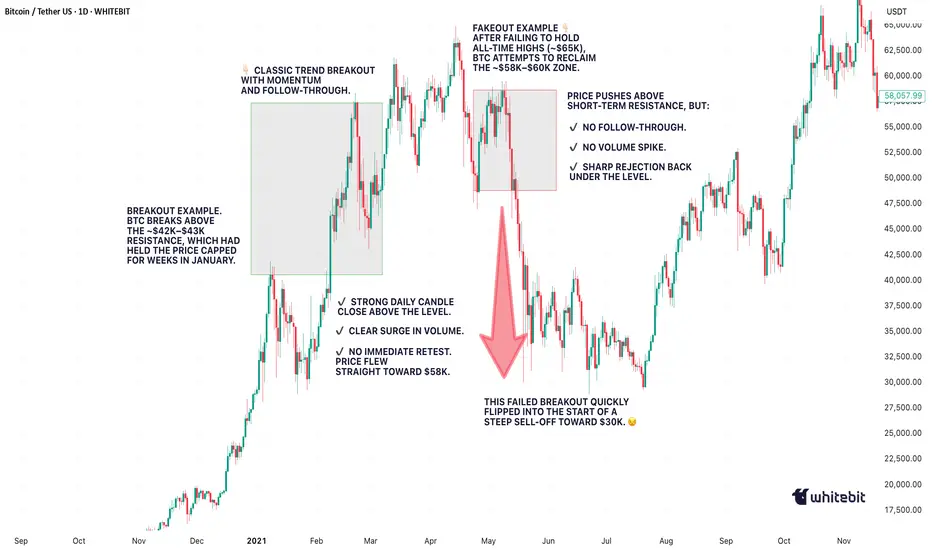
Example from BTC (2021):
Look back at January to February 2021. BTC had been stuck under the $42K–$43K resistance for weeks. Every push got sold off, until it didn’t.
When the breakout finally came, it was clean. The massive daily candle closed right through the level. Volume exploded. And there wasn’t even a polite little retest, price just launched straight toward $58K, leaving anyone waiting for a pullback completely behind.
Pure trend breakout energy. Everything lined up: the context, the volume, the structure — textbook 🤌🏻
🪤 What Is a Fakeout?
A fakeout, on the other hand, looks like a breakout… until it isn’t. The price briefly moves beyond a key level, but then snaps back inside the range, often trapping late buyers (or sellers) and triggering stop-losses.
Common Signs of a FAKEOUT:
Low or Declining Volume (at the breakout moment).
Quick Rejection with a Long Wick (especially on intraday charts).
Failure to Hold Above the Level on Retest.
Divergence Between Timeframes: For example, a 15M breakout that looks strong while the 4H still shows consolidation.
Classic BTC example:
This one was sneaky! After BTC hit its all-time high around $65K, the market started looking shaky. Price tried to recover by pushing back into the $58K–$60K zone, a pretty critical level at the time. It looked like a breakout attempt… but something was off. No real volume. No strong candle closes. And then, BOOM, hard rejection. The price popped just enough above resistance to lure in breakout traders (and probably clear out some stop-losses)… then completely reversed. And not just a minor pullback, this fakeout basically triggered the entire leg down toward $30K. Classic liquidity grab. The kind of move that looks like strength for a second… until it absolutely isn’t.
🕵️♂️ Key Differences: Breakout vs Fakeout (Checklist)
🧠 What Causes Fakeouts in Crypto?
Honestly, fakeouts aren’t some kind of accident. They’re almost baked into how crypto markets work.
Part of it comes down to simple liquidity hunting. The market knows exactly where traders tend to place their stop losses, right above resistance or just below support. Price often spikes into those zones, triggers stops, fills larger orders for bigger players… and then reverses completely.
Another reason? A lack of real conviction. Sometimes, it’s mostly retail traders chasing a move. Price pokes above a key level, but there just isn’t enough momentum to sustain it. Without bigger buyers or sellers stepping in, the move collapses right back.
And let’s be honest. When everyone on Crypto Twitter is watching the exact same level, fakeouts become almost inevitable. The more obvious the setup, the more likely it gets front-run, faded, or manipulated.
Plus, a huge mistake? People ignore the higher timeframe context. A breakout on the 15-minute chart might feel exciting… but if the 1D or 4H is still clearly in a downtrend, that breakout is fighting against the bigger picture. No surprise it fails. Fakeouts happen because the market’s job is to make most people wrong, at least for a moment.
🧭 Final Thought
Breakouts and fakeouts are part of the same game: they involve both liquidity and psychology. The market rewards patience, context, and waiting for confirmation. Sometimes, missing the first candle can save you from being a liability to someone else. So, next time an asset “breaks out,” take a second look. Is it really moving with force? Or is it just another trap waiting to be sprung?
What’s the last fakeout that caught you off guard? Drop your story in the comments. Let’s compare lessons learned!
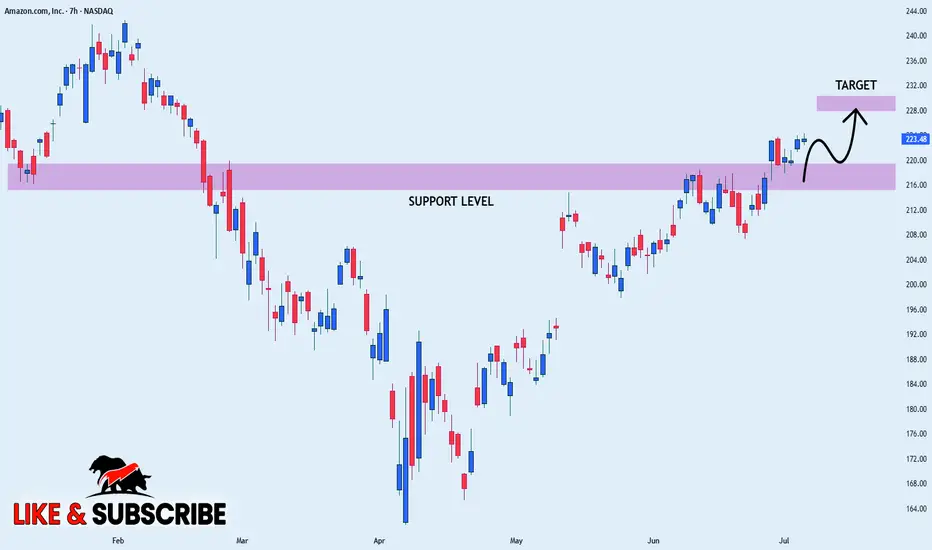
AMAZON STRONG UPTREND|LONG|
✅AMAZON is going up
Now and the stock made a bullish
Breakout of the key horizontal
Level of 220$ and the breakout
Is confirmed so we are bullish
Biased and we will be expecting
A further bullish move up
LONG🚀
✅Like and subscribe to never miss a new idea!✅
Disclosure: I am part of Trade Nation's Influencer program and receive a monthly fee for using their TradingView charts in my analysis.
Technical Analysis: Price Breakout and BeyondHello Friends,
Welcome to RK_Chaarts,
Let's try to analyze a stock from the FMCG sector, "Dabur India Limited".
Elliott Wave perspective.
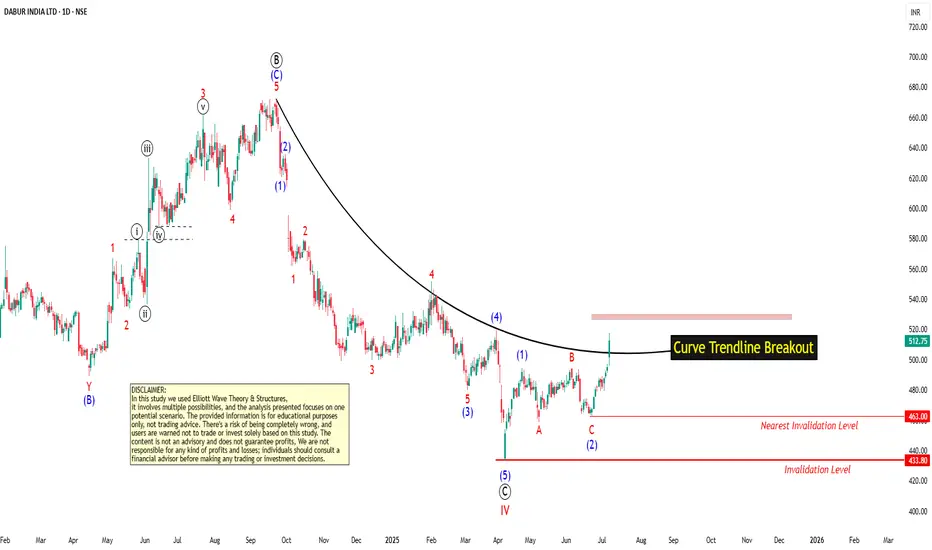
We can see that the correction is completed, which is the IVth wave of the monthly time frame of cycle degree in Red. Now, possibly the impulse wave Vth had start unfolding. If we go inside that, we'll see its five sub-divisions in black, labeled ((1))-((2))-((3))-((4))-((5)) of primary degree.
Possibly, wave ((1)) has started unfolding, and within wave ((1)), we'll see five sub-divisions in blue, which is the intermediate degree. Within this, waves (1) and (2) looks complete, and wave (3) has started, which has also broken out of the curve line.
Invalidation level
If our wave counts are correct, the bottom level of wave IV, which is 433, will be our main invalidation level. If the price goes below this level, it will trigger the invalidation level. If that happens, we'll need to re-analyze the chart from a wave count perspective.
But if the price stays above this invalidation level, then our view, which is based on the analysis, will remain bullish, and the chart will remain bullish.
Projected Target
As per Elliott wave theory, it can show new ATH in Long Term, only if Invalidation level is not breached.
Breakout with good Intensity of Volumes
The breakout has a good intensity of volume. The volume in the breakout candle is looking very good, which is 3-4 times higher than the average. This means that market participation is very good during this breakout. So, Conviction is high on this breakout.
We can clearly see that the price has closed above the 50 Exponential Moving Average (EMA), 100 EMA, and 200 EMA, which is a very good sign that the price has overcome all these hurdles along with Breakout.
Now, if there are any hurdles above, they could be the 200 EMA on the weekly time frame, which is coming near the level of 529, and the 50 EMA on the monthly time frame, which is coming near the price of 527. Currently, the price is trading around 513.
Once it crosses 529 or 530, it may show even more strength after that.
Dow Theory Trend confirmation
Based on Dow Theory, if we observe, the price which was falling and making lower highs and lower lows, has now started forming a Higher High and Higher Low pattern on the daily time frame, which is again a sign of bullishness.
Standard Deviation crossed
Price is trading above the mid-Bollinger Band on the weekly time frame, i.e., in the bullish territory. On the daily time frame, Prince has also crossed the upper Bollinger Band, meaning it has broken out and is expanding above the upper Bollinger Band, which is a bullish sign
Supporting Indicators
On the daily time frame, a very good breakout is visible inside RSI, and is also moving above 72. Additionally, on both the daily and weekly time frames, the MACD has given a positive crossover.
Before making any trading decisions, please conduct your own analysis or consult with a technical expert or financial consultant.
I am not Sebi registered analyst.
My studies are for educational purpose only.
Please Consult your financial advisor before trading or investing.
I am not responsible for any kinds of your profits and your losses.
Most investors treat trading as a hobby because they have a full-time job doing something else.
However, If you treat trading like a business, it will pay you like a business.
If you treat like a hobby, hobbies don't pay, they cost you...!
Hope this post is helpful to community
Thanks
RK💕
Disclaimer and Risk Warning.
The analysis and discussion provided on in.tradingview.com/u/RK_Chaarts/ is intended for educational purposes only and should not be relied upon for trading decisions. RK_Chaarts is not an investment adviser and the information provided here should not be taken as professional investment advice. Before buying or selling any investments, securities, or precious metals, it is recommended that you conduct your own due diligence. RK_Chaarts does not share in your profits and will not take responsibility for any losses you may incur. So Please Consult your financial advisor before trading or investing.
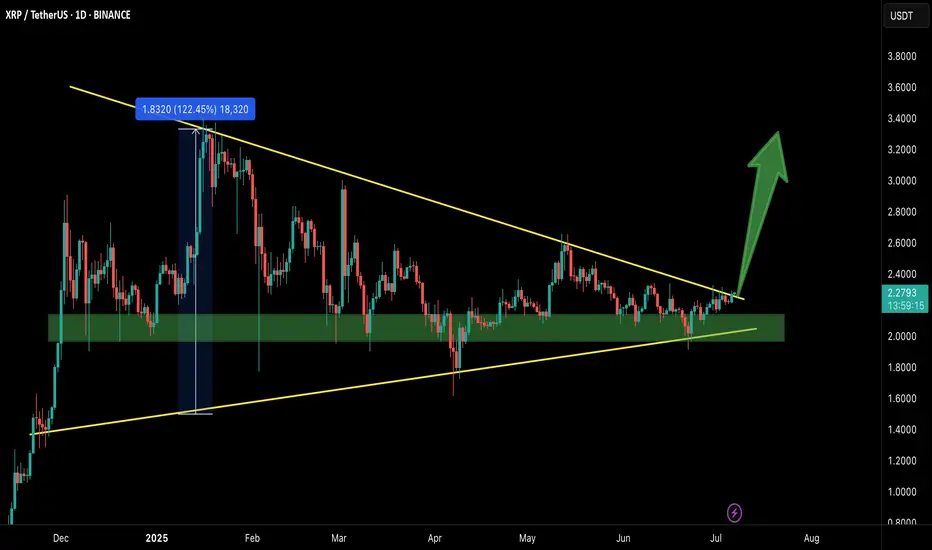
XRP/USDT – Breakout Confirmed!Hey Traders — if you're into high-conviction setups with real momentum, this one’s for you.
XRP has finally broken out from the massive symmetrical triangle on the 1D timeframe after holding the green support zone like a champ.
This structure has been compressing for months, and with this breakout, momentum could be shifting in favor of the bulls.
Entry: Current Market Price (CMP)
Add More: On dips above $2.20
Targets: $2.60 / $2.95 / $3.40 / $3.80
Stop Loss: $2.05
Leverage: 5x–10x
As long as price stays above the breakout zone, this setup holds strong potential. Keep a close eye for volume confirmation and follow-through.
Let’s see how this plays out. Will update as it unfolds.
UTIAMCUTIAMC giving trend-line breakout with increased volume. It is trending just 5=7% away from ATH. 1250 seems strong support and on upper side it may trade above 12-15%. Keep it on radar

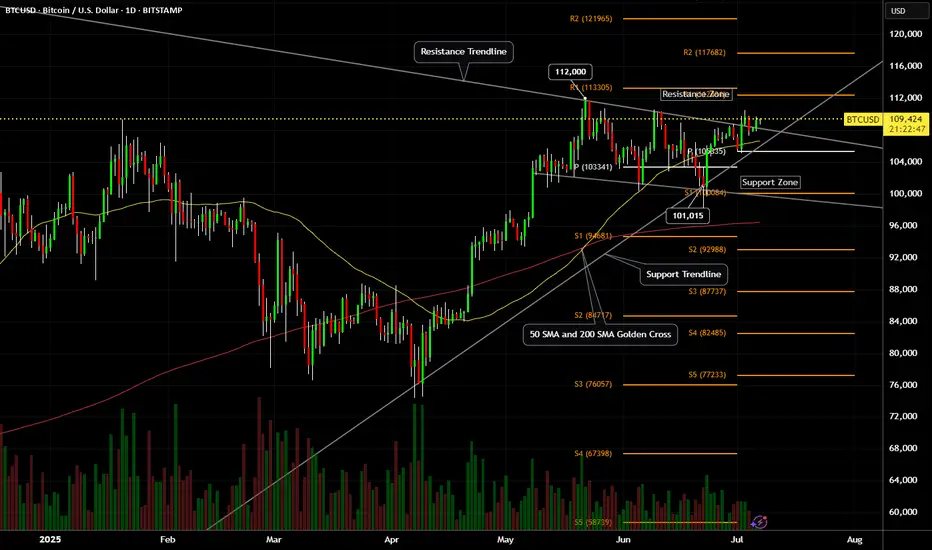
Bitcoin (BTCUSD) - Daily Price Uptrend, Resistance Breakout TestBitcoin (BTCUSD) has been in a recent Daily price Uptrend, rallying up from the $100,000 price support level.
A SMA Golden Cross printed on May 21st, 2025.
Bitcoin price is attempting a resistance zone test and has yet to breakout and hold above the $111,000 to $112,000 price zone.
Resistance levels: $110,000 , $112,000 , $117,000 , $121,000.
Support levels: $108,000 , $107,000 , $105,000 , $104,000 , $100,000.
Recent crypto industry, government legislation news, and institutional crypto purchases have helped to keep Bitcoin price above $100,000 support.
Stock market correlation volatility could also affect the crypto market and prices for the next 30 to 45 days.