Brent and WTI: Is $100 oil just Around the corner?#Brent and #WTI prices are steadily climbing, now reaching $73.30 and $71.15 per barrel. The market is showing strong signs of an upward trend, similar to what we saw in 2021–2022. With global demand picking up and increased interest from major market participants, analysts believe prices could soon push past the $100 mark — especially amid ongoing global tensions and rising consumption.
Standard Chartered forecasts Brent reaching $95 by December 2025, while some outlooks go even higher. What’s fueling this potential rally? Top 5 reasons oil may surge in the coming months:
Global instability : Tensions in the Middle East and unrest in key producers like Venezuela and Nigeria raise concerns about supply disruptions. Any flare-ups could push prices to $90, $95 — or beyond.
Economic recovery : Asia and developing economies are bouncing back fast. With industrial activity rising, so does energy demand — including for oil.
OPEC+ tight supply policy : OPEC+ is likely to maintain production cuts to support prices and keep the market balanced.
Low reserves, limited expansion : Stockpiles remain tight, and exploration has lagged in recent years. If demand spikes, producers may struggle to scale output quickly.
Aviation and petrochemicals rebound : Global air traffic and plastic manufacturing are growing, increasing demand for jet fuel and oil-based feedstocks.
Together, these factors create a strong setup for upward momentum in Brent and WTI prices. According to FreshForex analysts , the current levels could mark the beginning of a new growth cycle.
Brent-wti

Slowing Global Economy and Output Hikes Weigh on Brent OilBrent crude oil is holding steady around the $60 level, even after OPEC announced another 411,000 barrels per day increase in output, following similar hikes in May, June and smaller one in April. This latest adjustment comes at a time when global economic slowdown concerns are rising, making the decision a risky one. Although the main reason points to non-compliance from Kazakhstan and Iraq, some believe the United States may have played a role, possibly through pressure from Trump aimed at controlling inflation during the ongoing tariff hikes.
With several consecutive production increases now in place, a growing surplus is likely to develop over the second half of 2025. This would maintain downward pressure on oil prices if demand fails to keep pace. At the same time, the broader economic outlook is weakening. Recent manufacturing activity data from China, the United States, the European Union, and the United Kingdom all came in below 50, suggesting a faster rate of contraction. The presence of widespread tariffs is expected to continue weighing on business sentiment and consumer demand, potentially leading to rising unemployment and slowing growth.
In this environment, any short-term spikes in Brent and WTI prices are likely to remain opportunities to sell, unless there is a meaningful shift in underlying fundamentals. For a more detailed view of economic trends, please refer to the latest monthly report.
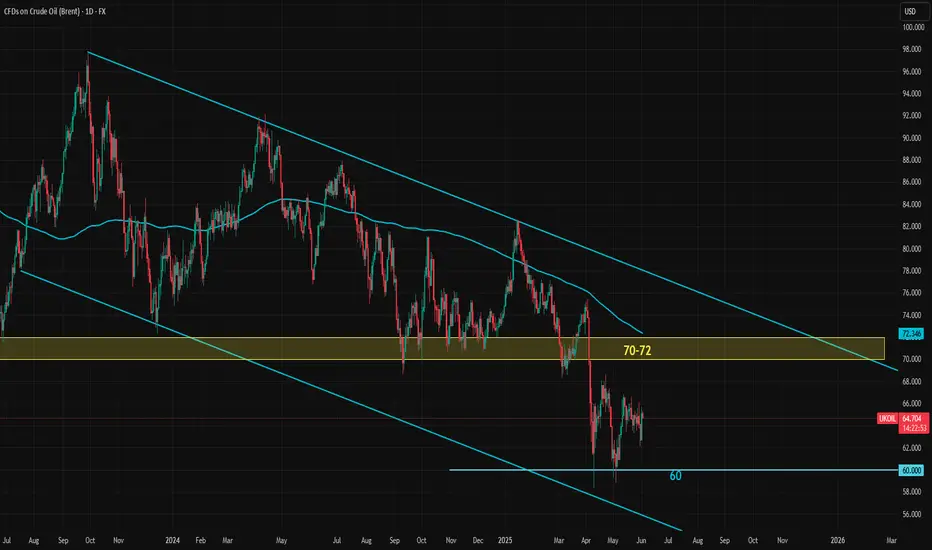
Brent crude has been in a steady downtrend since March of last year. While the price movement doesn't follow a perfect trend channel, the structure has generally held well. At the moment, Brent is hovering near the middle of this declining channel.
The former long-term support zone around $70 to $72. If prices move up toward this zone, it could present a fresh selling opportunity as long as the resistance holds. On the downside, the $60 level and the area just below it have formed a solid medium-term support, which has held up so far.
Still, oil bulls should be cautious around the $60 mark. Even though support looks strong for now, the overall direction of the trend and the broader fundamental backdrop suggest that this level could eventually break. Any long positions taken near current levels should factor in the potential for renewed downside pressure.
OPEC Cuts Oil Demand Forecast While Increasing SupplyOil prices are feeling bearish pressure. OPEC was unable to increase production significantly last year to stabilize prices. High interest rates have kept global economies cool enough. However, starting in May, OPEC will begin unwinding its voluntary production cuts. The timing of this decision is questionable. Tariffs are expected to hit global economies hard, while the Fed is likely to hold rates steady for a few more months. Recession risks in the world’s two largest economies, the U.S. and China are rising.
OPEC has acknowledged this trend by lowering its oil demand forecast for 2025 and 2026 by nearly 10%.
If summarized:
Oil demand is expected to fall 10%, possibly more if the U.S. and/or China enter recession.
Trump is expected to boost U.S. drilling, increasing supply.
OPEC will start to unwind supply cuts, increasing supply.
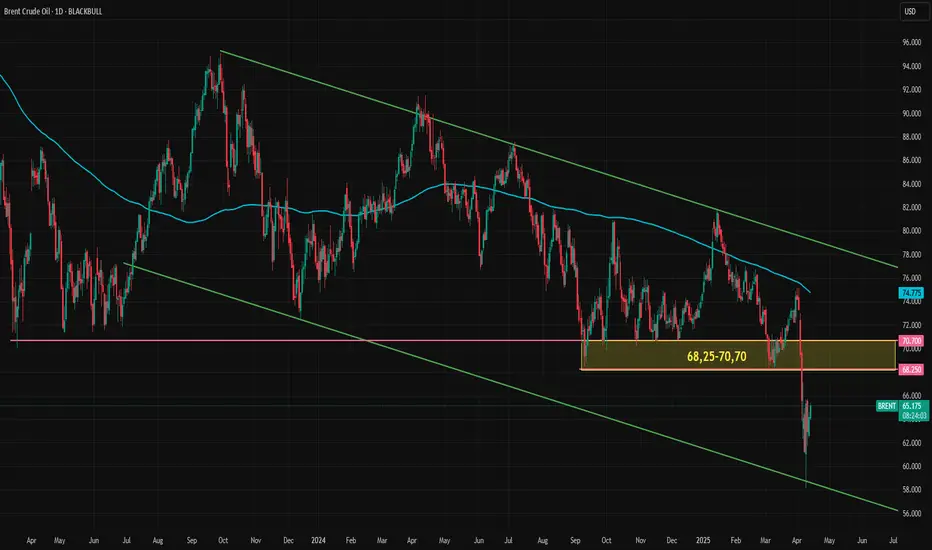
Brent is likely to remain under bearish pressure throughout the year because of rising supply and falling demand. As long as the current fundamental outlook remains unchanged, upward moves should be viewed as selling opportunities. A downtrend channel has formed since mid-2023, with the lower boundary recently tested. There is now an upward reaction. If this continues toward the 68.25–70.70 zone—previously a demand zone, now a potential supply zone—traders may look for short entry setups, provided this zone holds, with nearby stop-loss levels.
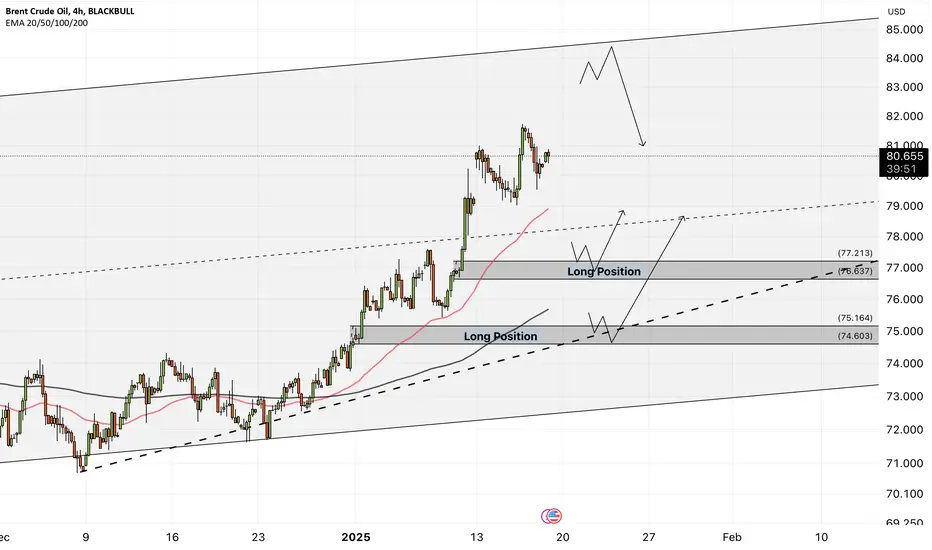
Brent - Peace returned to the Middle East?!Brent oil is above EMA200 and EMA50 in the 4-hour time frame and is moving in its upward channel. On the ceiling of the ascending channel, we will look for oil selling positions. In case of a valid break of the $80 range, we can see the continuation of the downward trend. On the other hand, within the demand zone, we can buy with a suitable risk reward.
Brent crude oil prices have surpassed $80 per barrel. This price increase continues to be supported by declining U.S. crude oil inventories and uncertainties surrounding Russian oil supplies following new U.S. sanctions.
The International Energy Agency (IEA) has stated that the latest U.S. sanctions have the potential to significantly disrupt Russia’s energy exports. These sanctions have blacklisted over one-fifth of the tanker fleet transporting Russian oil. Last week, 160 sanctioned tankers transported over 1.6 million barrels per day of Russian oil in 2024, accounting for approximately 22% of the country’s maritime exports. However, the IEA has maintained its current outlook on Russia’s oil supply and will update it based on future developments.
Meanwhile, reports indicate that Israel and Hamas have reached a ceasefire agreement, though Israel’s Prime Minister’s Office stated that details are yet to be finalized. Israeli Prime Minister Benjamin Netanyahu thanked U.S. President-elect Donald Trump for his role in the Gaza agreement and announced plans to meet him in Washington soon. Netanyahu also expressed gratitude to U.S. President Joe Biden for aiding in the hostage agreement. A senior Hamas official confirmed the group’s commitment to the ceasefire proposed by mediators.
In the oil market, attention remains focused on uncertainties surrounding Russian oil supply after the announcement of stricter U.S. sanctions. Additionally, declining U.S. crude oil inventories provide further support for prices. According to the Energy Information Administration (EIA), U.S. commercial crude oil inventories fell by 1.96 million barrels last week to under 413 million barrels, the lowest level since March 2022. This decline was primarily due to a decrease in crude oil imports by 304,000 barrels per day and an increase in exports by 1 million barrels per day. In refined products, despite a 1.6% drop in refinery utilization, gasoline and distillate inventories rose by 5.85 million barrels and 3.08 million barrels, respectively.
The Colonial Pipeline, which transports about 1.5 million barrels per day of gasoline from the U.S. Gulf Coast to the East Coast, is expected to remain closed until Friday following a leak earlier this week. This has provided limited upward support to gasoline prices.
The IEA and OPEC have both released their monthly oil market reports. The IEA warned that new U.S. sanctions on Russia’s energy sector could lead to supply disruptions. Additionally, the agency revised its global oil demand growth forecast upward due to colder weather in the Northern Hemisphere. The IEA estimates that global oil demand in 2024 will increase by 940,000 barrels per day, 90,000 barrels per day higher than the previous estimate. For 2025, demand is expected to grow by 1.05 million barrels per day.
OPEC, in its monthly report, maintained its 2025 oil demand growth estimate at 1.45 million barrels per day. For 2026, the group’s initial forecast predicts an increase of 1.43 million barrels per day. OPEC also kept its 2025 supply growth estimate for non-OPEC+ countries unchanged at 1.11 million barrels per day and expects a similar increase for 2026. OPEC’s production in December rose slightly to 26.74 million barrels per day, while overall OPEC+ output fell by 14,000 barrels per day to 40.65 million barrels per day due to reduced production in Kazakhstan. OPEC data indicates that demand for OPEC+ crude in 2025 will reach 42.5 million barrels per day and rise to 42.7 million barrels per day in 2026.
Iraq’s Oil Minister Hayan Abdul-Ghani told Reuters that Iraq plans to sign a major oil and gas deal in Kirkuk with BP by early February. He noted that this deal will surpass the scale of the major 2023 agreement with TotalEnergies.
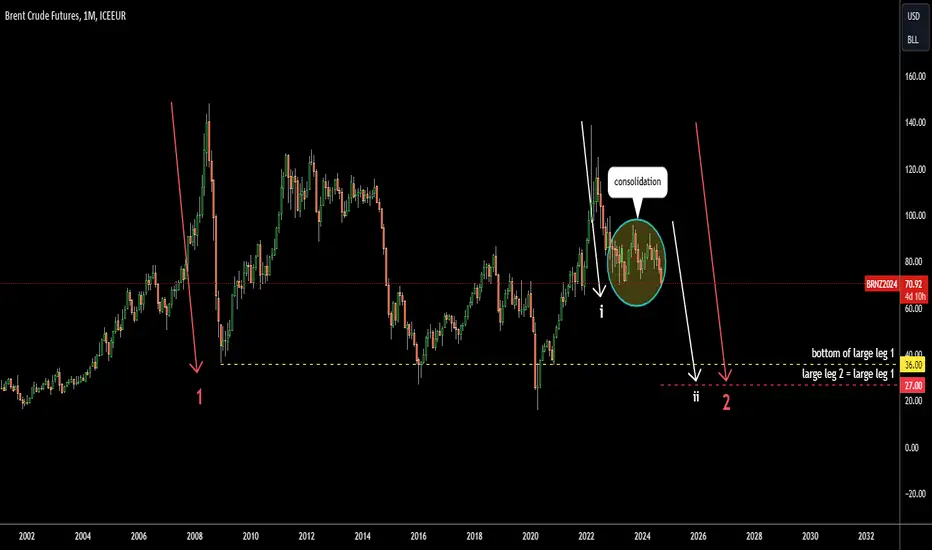
Brent crude oil looks into the abyss: first $36 then $27 Brent oil is in the giant range of $16 and $150
The price is in the decline within the red large leg 2 down.
It consists of 2 white smaller legs.
Leg ii is in the progress after a small consolidation (blue).
The first downward target is at the bottom of red large leg 1 at $36
The next target is located at the equal distance of red large leg 1 in second leg at $27
Saudi Arabia gave up oil target of $100 to increase output.
Cooling Chinese economy is also a bearish factor.
CRUDE OIL (WTI): Intraday Bullish Move
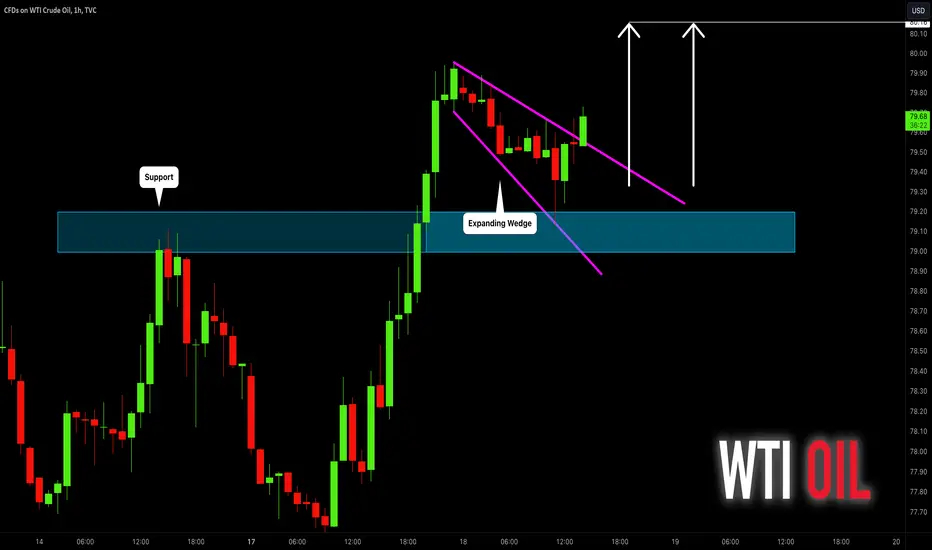
I see a breakout of an intraday horizontal resistance on WTI.
After a violation, the market started to correct within the expanding wedge pattern.
Test of a broken structure made the market bullish again.
I think that bulls may push the prices higher today.
Goal - 80.15
❤️Please, support my work with like, thank you!❤️
BRENT. Weekly trading levels 20 - 24.05.2024During the week you can trade from these price levels. Finding the entry point into a transaction and its support is up to you, depending on your trading style and the development of the situation. Zones show preferred price ranges WHERE to look for an entry point into a trade.
If you expect any medium-term price movements, then most likely they will start from one of the zones.
Levels are valid for a week, the date is in the title. Next week I will adjust the levels based on new data and publish a new post.
! Please note that brokers have a difference in quotes, take this into account when trading.
The history of level development can be seen in my previous posts. They cannot be edited or deleted. Everything is fair. :)
----------------------------------------------
I don’t play guess the direction (that’s why there are no directional arrows), but zones (levels) are used for trading. We wait for the zone to approach, watch the reaction, and enter the trade.
Levels are drawn based on volumes and data from the CME. They are used as areas of interest for trading. Traded as classic support/resistance levels. We see the reaction to the rebound, we trade the rebound. We see a breakout and continue to trade on a rollback to the level. The worst option is if we revolve around the zone in a flat.
Do not reverse the market at every level; if there is a trend movement, consider it as an opportunity to continue the movement. Until the price has drawn a reversal pattern.
Don't forget to like Rocket and Subscribe!!! Feedback is very important to me!

BRENT. Levels for intraday trading 15.05.2024During the day you can trade from these price levels. Finding the entry point into a trade is up to you, depending on your trading style and the development of the situation.
If you expect any medium-term price movements, then most likely they will start from one of the zones.Relevant to use as a location for installing TP.
Levels are valid throughout the day, the date is in the title. The next morning I adjust the levels based on current data and publish a new post.
The history of level development can be seen in my previous posts. They cannot be edited or deleted. Everything is fair. :)
---------------------------------------
Levels are drawn before the European session, based on volumes and data from the CME. They are used as zones of interest for intraday trading. When approaching a level, a “reaction” is expected, which can be traded for both a rebound and a breakout. The worst option is if we revolve around the level in a flat.
Do not reverse the market at every level. If there is a trend movement, consider it as an opportunity to continue the movement. Until the price has drawn a reversal pattern.
TV does not allow publishing timeframes smaller than M15.Reactions to levels and the search for entry points are more convenient to look at M5-M1.
Don’t forget to like Rocket and Subscribe!!!

BRENT. Levels for intraday trading 10.05.2024During the day you can trade from these price levels. Finding the entry point into a trade is up to you, depending on your trading style and the development of the situation.
If you expect any medium-term price movements, then most likely they will start from one of the zones.Relevant to use as a location for installing TP.
Levels are valid throughout the day, the date is in the title. The next morning I adjust the levels based on current data and publish a new post.
The history of level development can be seen in my previous posts. They cannot be edited or deleted. Everything is fair. :)
---------------------------------------
Levels are drawn before the European session, based on volumes and data from the CME. They are used as zones of interest for intraday trading. When approaching a level, a “reaction” is expected, which can be traded for both a rebound and a breakout. The worst option is if we revolve around the level in a flat.
Do not reverse the market at every level. If there is a trend movement, consider it as an opportunity to continue the movement. Until the price has drawn a reversal pattern.
TV does not allow publishing timeframes smaller than M15.Reactions to levels and the search for entry points are more convenient to look at M5-M1.
Don’t forget to like Rocket and Subscribe!!!

BRENT. Levels for intraday trading 9.05.2024During the day you can trade from these price levels. Finding the entry point into a trade is up to you, depending on your trading style and the development of the situation.
If you expect any medium-term price movements, then most likely they will start from one of the zones.Relevant to use as a location for installing TP.
Levels are valid throughout the day, the date is in the title. The next morning I adjust the levels based on current data and publish a new post.
The history of level development can be seen in my previous posts. They cannot be edited or deleted. Everything is fair. :)
---------------------------------------
Levels are drawn before the European session, based on volumes and data from the CME. They are used as zones of interest for intraday trading. When approaching a level, a “reaction” is expected, which can be traded for both a rebound and a breakout. The worst option is if we revolve around the level in a flat.
Do not reverse the market at every level. If there is a trend movement, consider it as an opportunity to continue the movement. Until the price has drawn a reversal pattern.
TV does not allow publishing timeframes smaller than M15.Reactions to levels and the search for entry points are more convenient to look at M5-M1.
Don’t forget to like Rocket and Subscribe!!!

BRENT. Levels for intraday trading 8.05.2024During the day you can trade from these price levels. Finding the entry point into a trade is up to you, depending on your trading style and the development of the situation.
If you expect any medium-term price movements, then most likely they will start from one of the zones.Relevant to use as a location for installing TP.
Levels are valid throughout the day, the date is in the title. The next morning I adjust the levels based on current data and publish a new post.
The history of level development can be seen in my previous posts. They cannot be edited or deleted. Everything is fair. :)
---------------------------------------
Levels are drawn before the European session, based on volumes and data from the CME. They are used as zones of interest for intraday trading. When approaching a level, a “reaction” is expected, which can be traded for both a rebound and a breakout. The worst option is if we revolve around the level in a flat.
Do not reverse the market at every level. If there is a trend movement, consider it as an opportunity to continue the movement. Until the price has drawn a reversal pattern.
TV does not allow publishing timeframes smaller than M15.Reactions to levels and the search for entry points are more convenient to look at M5-M1.
Don’t forget to like Rocket and Subscribe!!!

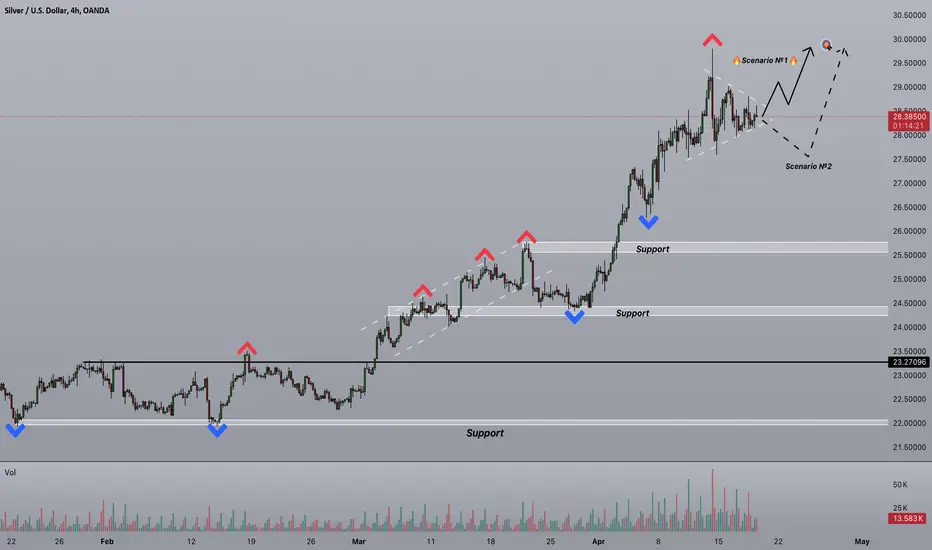
Strifor || SILVER-18/04/2024Preferred direction: BUY
Comment: Previous trade ideas for silver , where we considered selling, have been cancelled. Today, another strengthening of metals is expected. The buyers' target will, of course, be the local maximum at level 30 . It is best to set the target slightly below this level.
As you can see in the chart, we have formed a clear contracting triangle, and volatility has died down. This is a clear sign of an upcoming impulse, which, as we suppose, will be upward. We are considering two scenarios. Scenario №1 is more likely since further weakening of the US dollar (on major currency pairs), which began in the middle of this week, is expected and this should soon also be reflected in metals.
Additional comments on this trade will be provided as situation changes. Follow us!
Thank you for like and share your views!
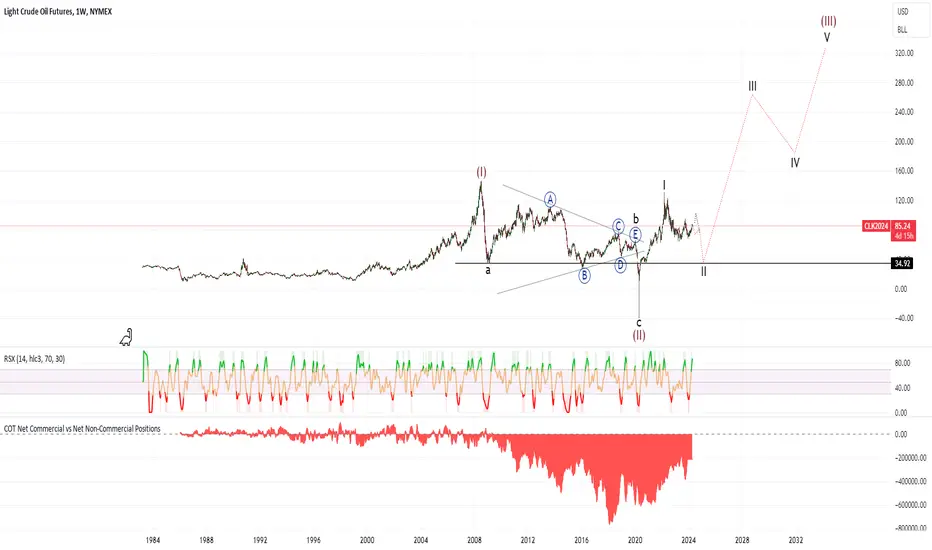
New supercycle soonI think that now there is wave 2 of the big 3rd wave of the supercycle. So in a few years oil will break its highs.
CRUDE OIL (WTI): Important Key Levels 🛢️
Here is my latest structure analysis and important key levels to watch on WTI Crude Oil.
Resistance 1: 85.20 - 85.85 area
Resistance 2: 89.10 - 89.90 area
Resistance 3: 93.75 - 95.00 area
Support 1: 82.50 - 83.10 area
Support 2: 80.00 - 80.60 area
Support 3: 76.80 - 77.80 area
Support 4: 75.50 - 76.20 area
Consider these structures for pullback/breakout trading.
❤️Please, support my work with like, thank you!❤️

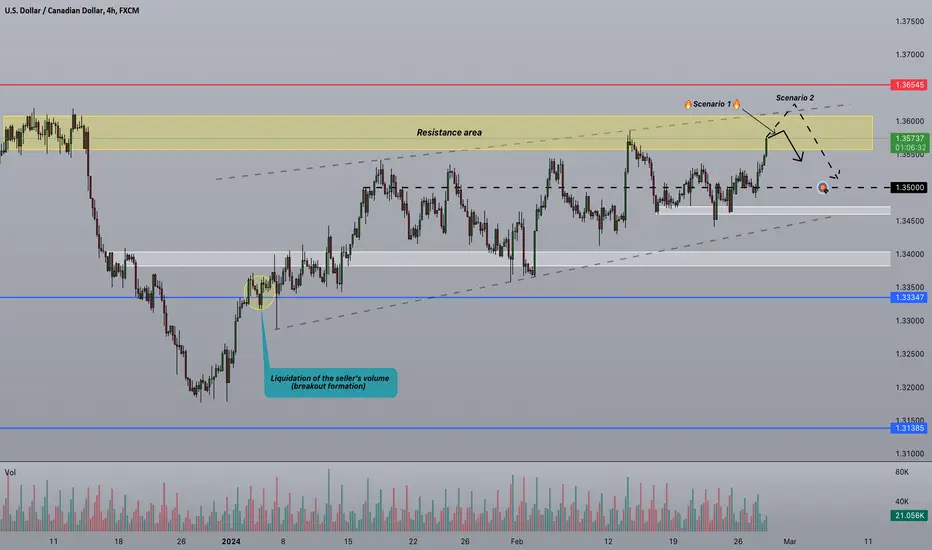
Strifor || USDCAD-28/02/2024Preferred direction: SELL
Comment: Our previous long trading idea for this currency pair has been fully worked out. Today, we are already considering more sell trades, both for the short term and for the medium term. As for the short term, it is better to stick to scenario №1 . This is an intraday trade and nothing more. Scenario №2 is a more medium-term setup, where we expect sales at the level of 1.36000 . Of course, entry is carried out only after the entry point has been formed.
Additional comments on this trade will be provided as situation changes. Follow us!
Thank you for like and share your views!
usdcadIn the one-hour timeframe, the price has reached a support range. We have to wait for the news results. If the news is positive, this level will be broken.Which is likely to be the case.

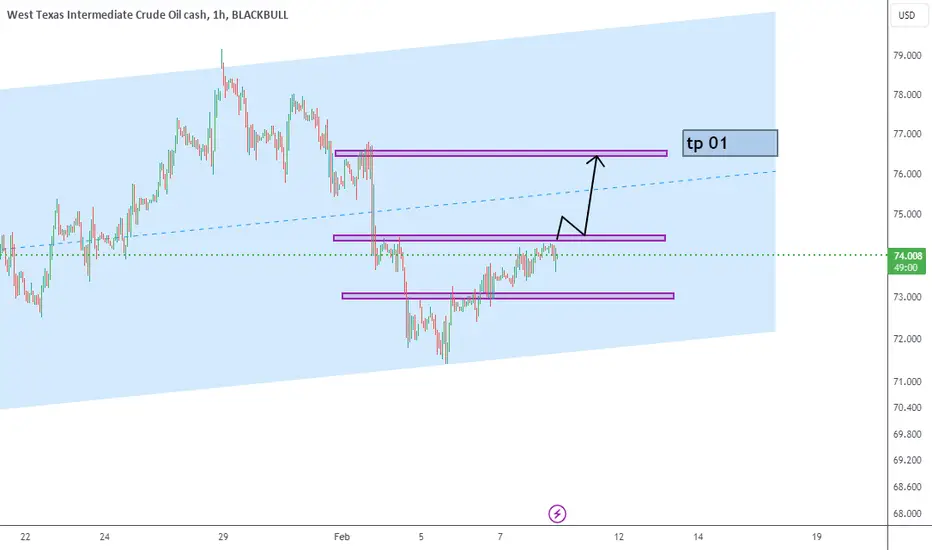
wti buy positionIn the daily time frame, the price is in the ascending channel. By examining the lower time frames, we see that the price reacted well to the bottom of the channel. Therefore, the expectation of price growth to the specified range is not unexpected.
⚡️Strifor || USDCAD-07/02/2024Preferred direction: SELL
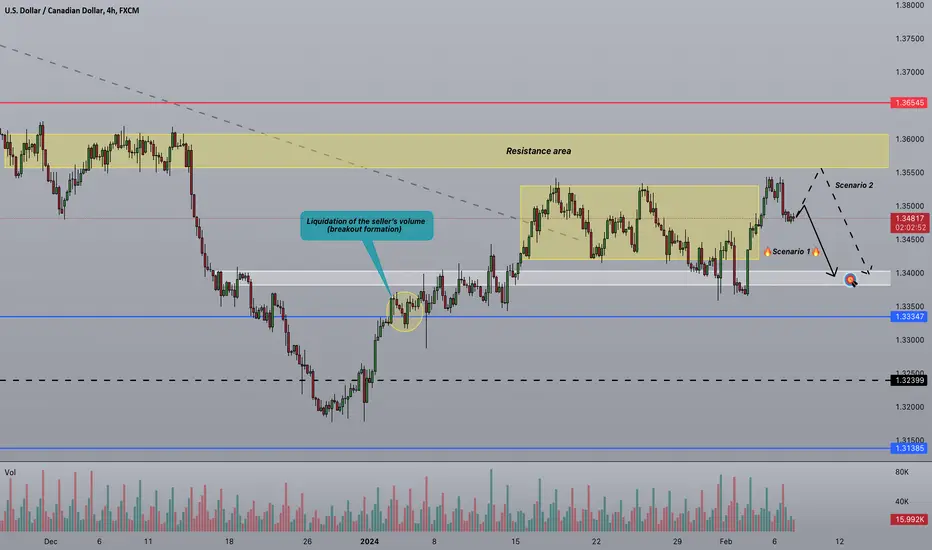
Comment: In addition to the euro and pound , the priority for selling the US dollar also applies to other majors . In this case, we will analyze USDCAD . In the medium and short term, the instrument is looking down quite confidently; we do not rule out a potential small rollback upward, but the main mood is, of course, bearish. In this regard, we highlight two main scenarios. Level 1.34000 acts as a target here for both scenarios. Scenario №1 is more about a short-term login attempt, and scenario №2 is more medium-term. Of course, scenario №2 will be more conservative than scenario №1 . One may also consider two scenarios simultaneously using the method of gradually gaining a position.
Thank you for like and share your views!
⚡️Strifor || USDCAD-23/01/2024Preferred direction: BUY
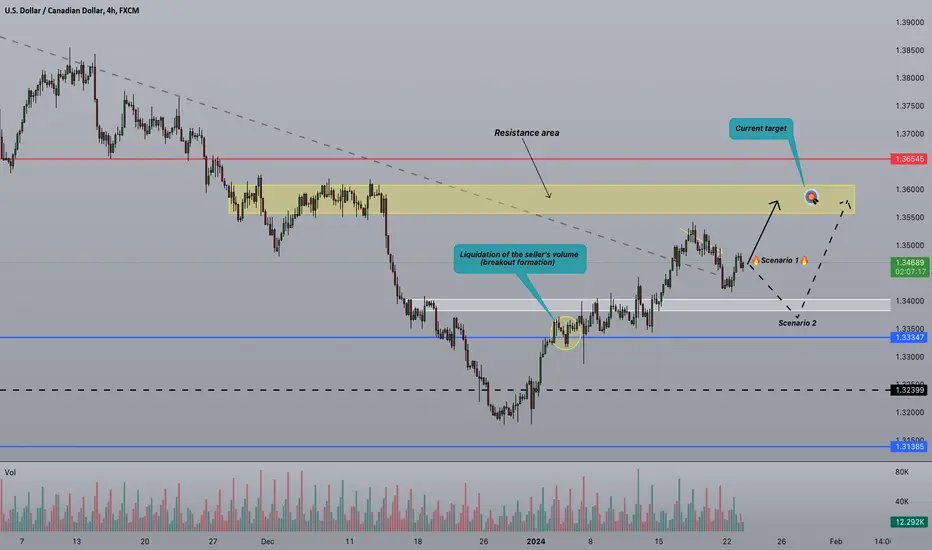
Comment: The shorter-term view for the USDCAD currency pair is directed upward. The US dollar is still strong, and further strengthening is expected this week. The most likely scenario is growth from current levels. Less likely is a retest of the support area at the 1.34000 level. The long target is located at the level of 1.36000 ; considering a target above this level is still risky.
Thank you for like and share your views!
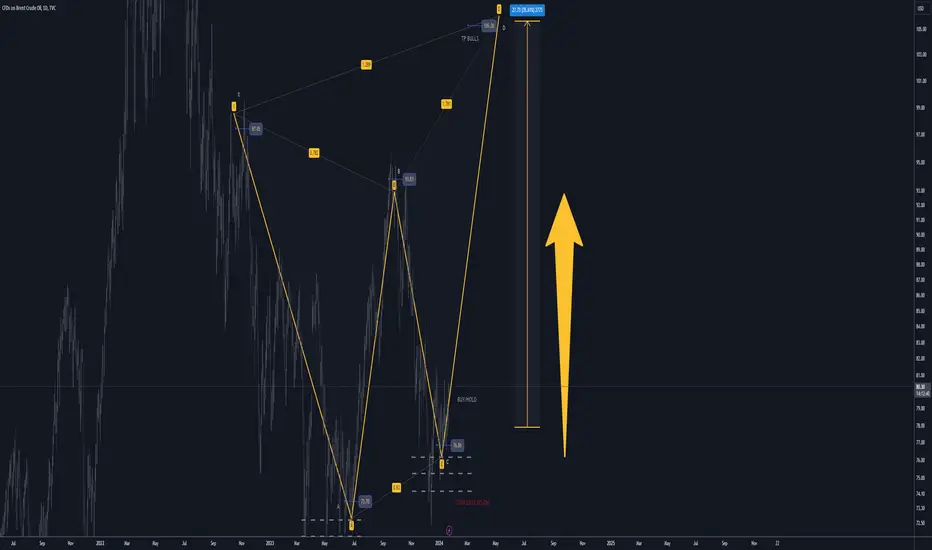
Brent D1 swing trade bulls 35% buy/hold setup🔸Today let's review the daily chart for brent oil . Noteworthy bounce in progress
after accumulation near lows, speculative XABCD setup in progress.
🔸XABCD is defined by point X at 97.45, point A at 73.70, point B at 93.85,
point C (confirmed) at 76.85, point D in progress at 105.30. speculative
trade setup with advanced entry reversal at point C.
🔸Recommended strategy for BULLS: buy/hold near market, or buy dips near point
C, TP bulls is point D at 105.30, 35% gains potential (unleveraged). swing trade setup,
patience required. good luck, traders!
🎁Please hit the like button and
🎁Leave a comment to support our team!
RISK DISCLAIMER:
Trading Futures , Forex, CFDs and Stocks involves a risk of loss.
Please consider carefully if such trading is appropriate for you.
Past performance is not indicative of future results.
Always limit your leverage and use tight stop loss.
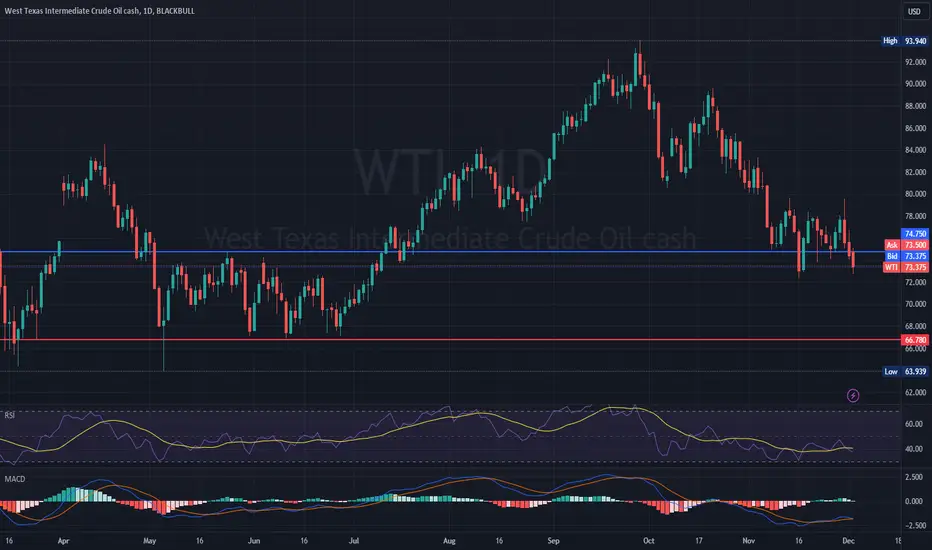
WTI BEARISH OUTLOOKOil prices saw a decline due to skepticism about OPEC+'s output cuts and concerns over growing supply overshadowing potential disruptions in the Middle East. U.S. crude settled 1.4% lower at $73.04 a barrel, and Brent dropped 1.1% to $78.03 a barrel. Despite announcements of output cuts, the lack of confidence in compliance and doubts about measurement methods have cast shadows on the effectiveness of these measures. Geopolitical events, such as attacks in the Red Sea, have revived concerns about potential disruptions to Middle Eastern oil supplies, amplifying market anxieties. Additionally, fears of decreased demand and weak global manufacturing activity in November added pressure on prices. Technical indicators signaled bearish sentiment, indicating possible support levels at $66.78 and a potential rebound around $74.75.
Risk Disclosure: Trading Foreign Exchange (Forex) and Contracts of Difference (CFD's) carries a high level of risk. By registering and signing up, any client affirms their understanding of their own personal accountability for all transactions performed within their account and recognizes the risks associated with trading on such markets and on such sites. Furthermore, one understands that the company carries zero influence over transactions, markets, and trading signals, therefore, cannot be held liable nor guarantee any profits or losses.
CRUDE OIL (WTI): Consolidation & Complete Indecision 🛢️
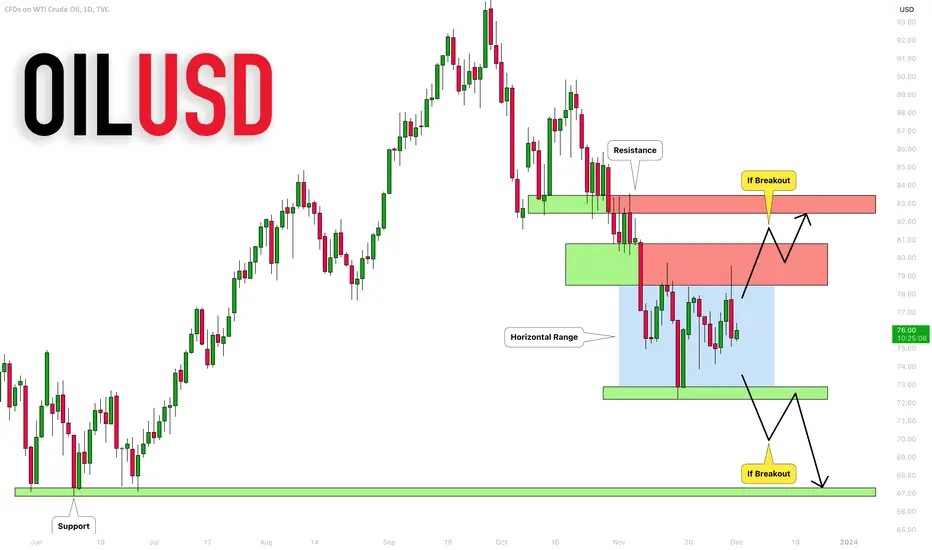
WTI Crude Oil is consolidating within a range on a daily since the beginning of November.
Depending on the reaction of the price to its boundaries, I see 2 potential scenarios.
Bullish Scenario
If the price breaks and closes above 80.85 - the upper boundary of the range,
I will anticipate a growth to 82.50.
Bearish Scenario
In case of a breakout of 72.20 support, we may anticipate a bearish movement
to 87.35 level.
Wait for a breakout, that will give you a strong bullish or bearish confirmation.
❤️Please, support my work with like, thank you!❤️
TradePlus-Fx|BRENT: intraday idea💬 Description: Today, the instrument is at the level of 87.45 and is most likely to prepare for a fall in the more medium term. But here it is necessary to take into account the geopolitical background, which greatly influences oil. Today, an idea is proposed, the time frames of which are within the day. Namely, long for the purpose of local updating of the maximum. The approximate target is the level of 90 . After which, as was said, the price will most likely rush down again, if there are no sharp geopolitical surges on the world stage.
🔔 FX CALENDAR TODAY 🔔
🇺🇸PCE Price index
🇺🇸CPI
🛢US Baker Hughes Total Rig Count
➖➖➖➖➖➖➖
🚀Thank for your BOOSTS 🚀
👇Share your views and FOLLOW US 👇
