Oil Price Falls Below $69Oil Price Falls Below Pre-Escalation Levels of Middle East Conflict
According to the XBR/USD chart:
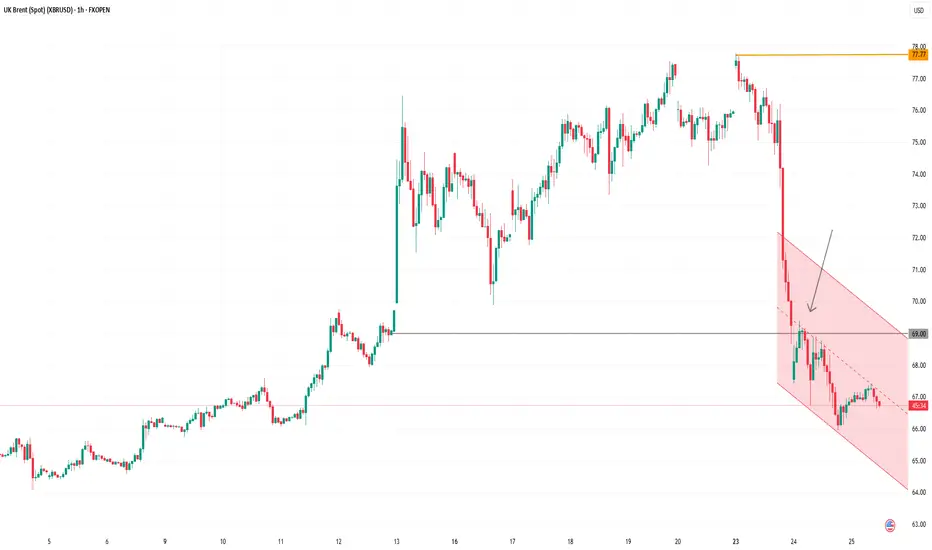
→ Prior to Israel’s airstrikes on Iran on 13 June, the price of Brent crude was hovering around the $69.00 mark;
→ Following US bombings in Iran, the price spiked at the Monday market open, reaching a high of approximately $77.77 (as we reported on 23 June).
However, after President Trump announced a ceasefire between Iran and Israel — later confirmed by statements from both sides — oil prices dropped sharply. This morning, Brent is trading around $68, which is even lower than the level seen before the initial strikes.
Media outlets report that analysts broadly agree that fears have eased, even if the ceasefire appears fragile. Market participants seem to view the likelihood of the conflict escalating into a full-scale ground war — involving US troops and the closure of the Strait of Hormuz — as low. Shipping through the strait is reportedly returning to normal.
Technical Analysis of the XBR/USD Chart
Interestingly, the $69 level — from which prices surged on 13 June — acted as resistance yesterday (as indicated by the arrow on the chart).
It can be assumed that the longer the ceasefire holds, the less relevant the fears that have served as bullish drivers. In that case, Brent crude prices may continue fluctuating within a downward channel, outlined in red, with the possibility of a short-term rise toward its upper boundary.
Nevertheless, the key drivers for oil prices will remain the fundamental backdrop and official statements regarding the situation in the Middle East and other geopolitical factors.
This article represents the opinion of the Companies operating under the FXOpen brand only. It is not to be construed as an offer, solicitation, or recommendation with respect to products and services provided by the Companies operating under the FXOpen brand, nor is it to be considered financial advice.
Brentanalysis
XBR/USD Analysis: Price Near Resistance ZoneXBR/USD Analysis: Price Near Resistance Zone
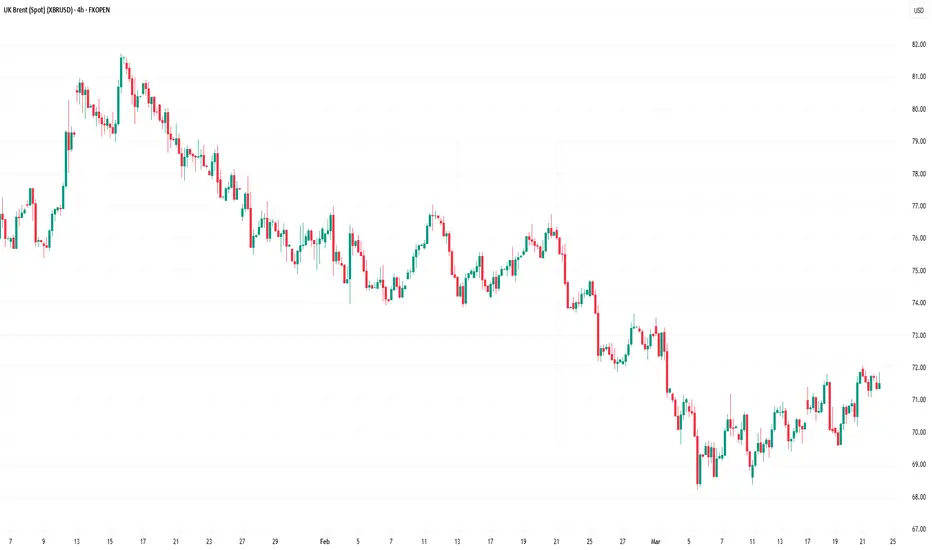
As seen on the XBR/USD chart, Brent crude oil prices are hovering near last week’s highs this morning as market participants assess various influencing factors, including:
→ New U.S. sanctions on Iran, which are limiting its export capacity and tightening global supply, particularly to China.
→ Ongoing negotiations between the U.S., Ukraine, and Russia in Saudi Arabia, which could potentially lead to increased Russian oil exports.
→ OPEC+ plans to raise oil production starting in April.
Technical Analysis of XBR/USD
From a technical perspective, Brent crude oil is trading near a key resistance zone, which consists of:
→ A bearish Fair Value Gap (highlighted in purple).
→ The upper boundary of the descending channel.
→ The upper boundary of a narrowing triangle (shown in black), which can be interpreted as a Rising Wedge pattern.
The Rising Wedge may represent a corrective rebound within a broader bearish trend. If buyers fail to break through this resistance zone, Brent crude prices could resume their downtrend within the red channel.
This article represents the opinion of the Companies operating under the FXOpen brand only. It is not to be construed as an offer, solicitation, or recommendation with respect to products and services provided by the Companies operating under the FXOpen brand, nor is it to be considered financial advice.
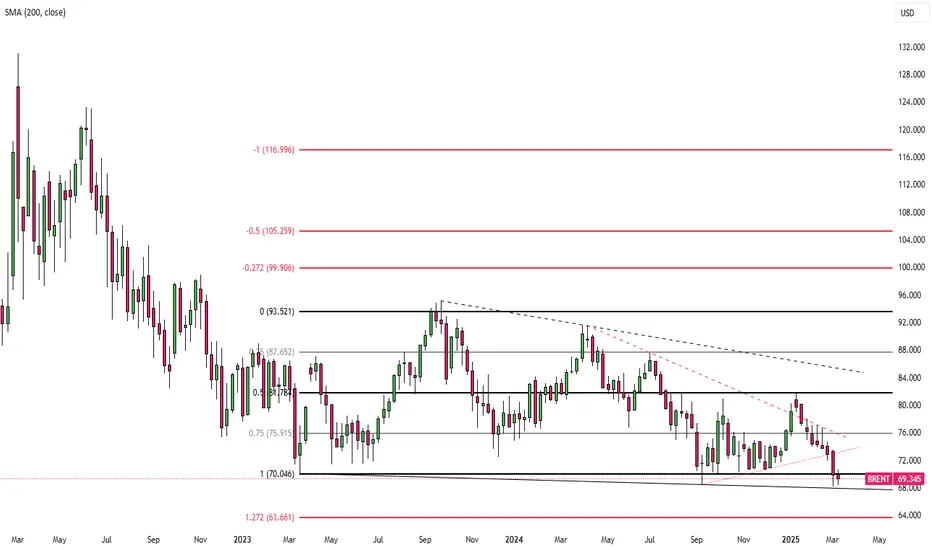
Brent Crude Struggles at $69 as Global Demand Risks MountBrent crude hovered around $69 per barrel on Tuesday as concerns grew that U.S. tariffs could slow economic growth and weaken oil demand. Tariffs imposed by President Trump on major suppliers like Canada and Mexico, along with China’s retaliatory measures, heightened fears of a global slowdown.
China’s deepening deflationary pressures further weighed on crude prices despite stimulus efforts. On the supply side, Russia’s Deputy PM Alexander Novak confirmed OPEC+ plans to boost production in April but noted the decision could be reassessed if market conditions shift.
Technically, the first support is at $68.1, with subsequent levels at $65 and $63.6. On the upside, the initial resistance is at $70.2, followed by $73.3 and $75.80.