Brent UKOil - Neutral Slightly Bearish • Daily: Price is sitting above long-term trendline support, but momentum is waning.
• 4H: Structure looks indecisive with constant failures near 71.00.
• 1H: Recent break of the upward channel. Now retesting that zone from below.
⚠️ Watch For:
• Retest of 69.60–70.00 as resistance.
• Break and close below 69.20 could signal deeper downside.
• If it holds above 70.20 again, bullish bias resumes.
Brentoil
Crude oil $ukoil - Final falling oil has been a barometer of the financial market for the last decades.
I look at the formations and I see that we will see a renewal of the bottom in the coming months, I will not say the reasons, you just need to wait a little.
I've been talking about the fall for a long time, but it's not over yet.
After the final fall, I expect a renewal of the highs, due to the worsening situation in the Middle East, this will be after September
Best Regards EXCAVO
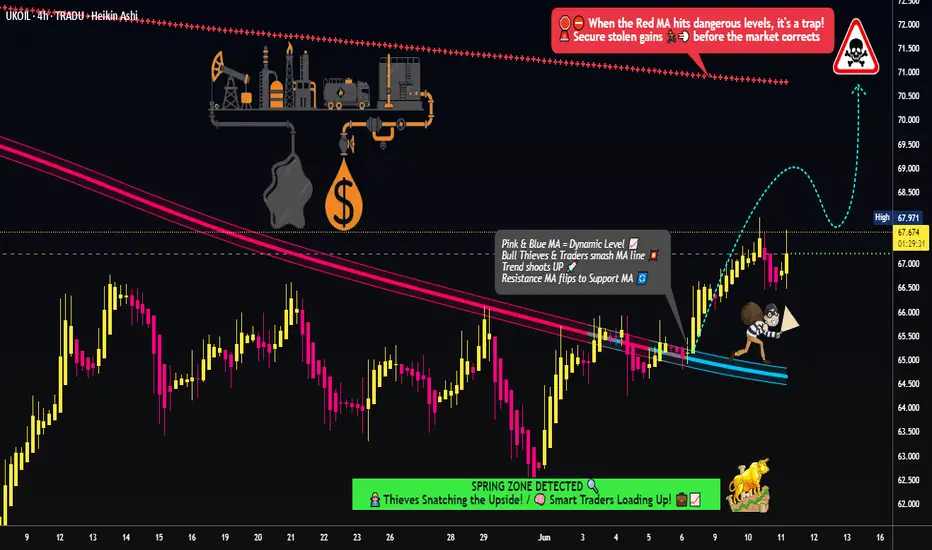
Brent Oil Robbery: The Thief’s Guide to Energy Market Profits! 🚨💰 THE OIL VAULT HEIST: UK OIL SPOT/BRENT TRADING STRATEGY 💸🔫
🌟Hi! Hola! Ola! Bonjour! Hallo! Marhaba!🌟
Dear Money Makers & Robbers 🤑💰💸✈️
Based on our 🔥Thief Trading style analysis🔥 (both technical and fundamental), here’s the master plan to heist the UK Oil Spot/Brent Energy Market. Follow the blueprint carefully—this strategy focuses on long entries, with a daring escape planned near the high-risk RED MA Zone where bearish robbers and consolidation traps await. 🏆💸 Take your profit and treat yourself, fellow traders—you earned it! 💪🏆🎉
🕵️♂️ Entry 📈
💥 The vault is wide open! Time to swipe that bullish loot—heist is on!
Place buy limit orders within the 15 or 30-minute timeframe, near swing lows/highs for pullback entries.
🛑 Stop Loss 🛑
📍 Thief’s SL—recent swing low and below the moving average (4H timeframe) for day/swing trades.
📍 Adjust SL based on risk, lot size, and number of orders.
🎯 Target
🏴☠️💥 70.800 (Aim for the big loot!) OR escape before the target
🔥 Market Heist Overview
The UK Oil Spot/Brent market is currently showing bullishness 🐂, driven by key factors—perfect for a day/scalping trade robbery! ☝☝☝
📰 Additional Tools & Analysis
📊 Get the Fundamental, Macro, COT Report, Quantitative Analysis, Sentiment Outlook, Intermarket Analysis, Future Targets—check our bi0 liinks 👉👉👉🔗🔗
⚠️ Trading Alert: News Releases & Position Management
📰 News can rattle the vault! 💥
✅ Avoid new trades during news releases.
✅ Use trailing stop-loss orders to protect profits.
💖 Supporting our heist plan?
💥 Smash the Boost Button 💥 to empower the robbery team.
Let’s make money every day in this market with the Thief Trading Style! 🏆💪🤝❤️🎉🚀
👀 Stay tuned for the next robbery plan, thieves! 🤑🐱👤🤗🤩
Brent Oil Breakout Heist – Bullish Robbery in Progress!🕶️ Brent Oil Job in Motion – Market Robbery Blueprint by The Chart Bandits 💼💸
What’s up, gang? 👋 Hola, Ola, Bonjour, Hallo, Marhaba! 🌍
Calling all market robbers, trend thieves, and slick profit snatchers! 🤑💰💥
We’ve got eyes on the UK Oil Spot / Brent Energy Market – and this time, it’s a clean breakout job. According to our Thief Trading Code (yeah, that’s the street manual we use), the setup’s lit and the vault’s wide open. Here’s the drill:
📈 Entry Plan – The Break-In Point:
The score begins above MA level 65.400. When that line cracks, it’s time to move.
You can either:
🔹 Set buy stop orders just above the breakout zone
🔹 Or wait for a pullback to a 15m or 30m swing low/high and enter with style
🚨 Pro tip: Set your alerts. Real thieves don’t sleep on breakouts.
🛑 Stop Loss – Safety First, Bandits:
Let the breakout breathe. Don’t slam the SL too early.
Once it confirms, tuck your SL near the 4H swing low – around 64.000.
Lot size, risk appetite, number of positions – all play into where you hide your exit door.
Just don’t blame the crew if you jump in blind. ⚠️
🎯 Take Profit – The Escape Route:
Target set at 70.000 – hit it, grab the bags, and disappear before the bears sniff us out. 🏃♂️💨
📊 Why This Heist Works:
The market’s lookin’ bullish – real heat from fundamentals like:
Macro setups
COT positioning
Intermarket analysis
Sentiment vibes
Storage & inventory updates
🔍 Want the full blueprint? Fundamentals, charts, deep dives – check my profille for the linkss 🔗👀
⚠️ Heads-Up – News Drops Can Wreck the Getaway:
Don’t enter during high-impact news
Protect profits with a trailing SL
Always expect the unexpected, robbers 🚧📉
💥 Smash the Boost Button if you’re part of the Thief Crew!
We’re not just trading – we’re executing blueprints and stealing clean gains.
Stay tuned for the next setup. You know what time it is...
🕶️ Trade smart, loot fast, vanish smooth. 🐱👤💸🚀

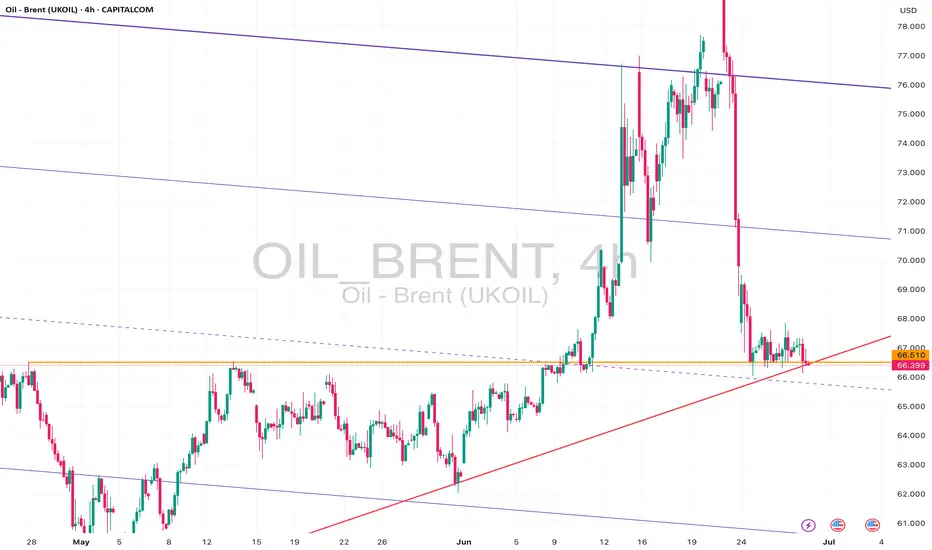
Brent Oil – Bearish Break or Bounce from Long-Term Support?Brent Oil is hovering just above critical support near 66.00, with a clear bearish structure visible across timeframes:
🔎 15m & 1h:
Price action is consolidating near the ascending support trendline drawn from early June lows. Short-term price structure shows lower highs and lower lows, suggesting continued downside pressure.
📉 4h & 1D:
The recent sell-off from above 78.00 has pushed Brent back into the lower region of the broad descending channel. Daily and 4h charts show price testing confluence between the horizontal support at ~66.00 and a long-term rising trendline. A confirmed close below this level could accelerate bearish momentum towards 64.00 or even 62.00.
⚠️ Key Levels:
• Support: 66.00, 64.00, 62.00
• Resistance: 67.00, 69.00
• Bias: Bearish – price remains in a clear downtrend unless buyers reclaim above 67.50 with strong volume.
📌 Outlook:
As long as Brent holds below 67.00 and the descending trendline caps rallies, my bias is bearish. A breakdown of 66.00 on higher timeframes would open the door for a move towards lower channel support levels. However, if buyers defend and push back above 67.50, we could see a short-term relief rally.
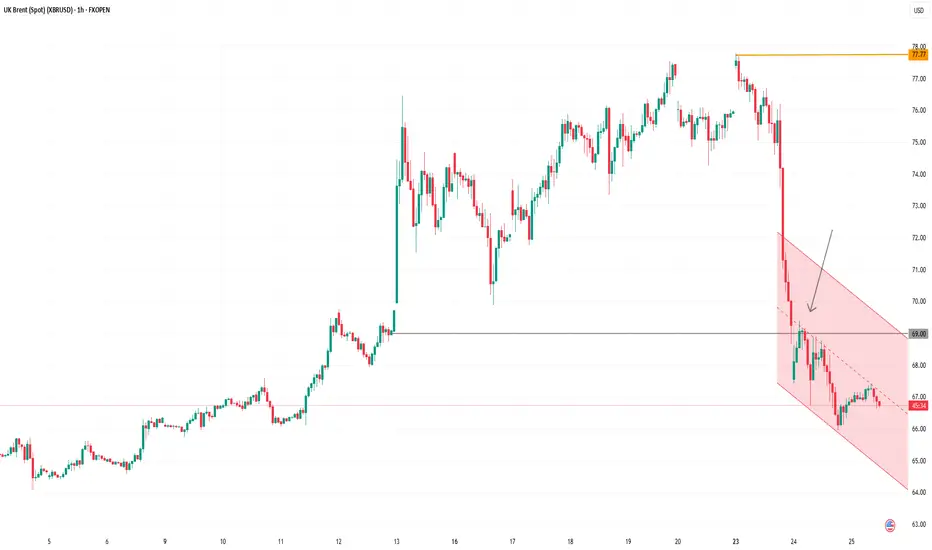
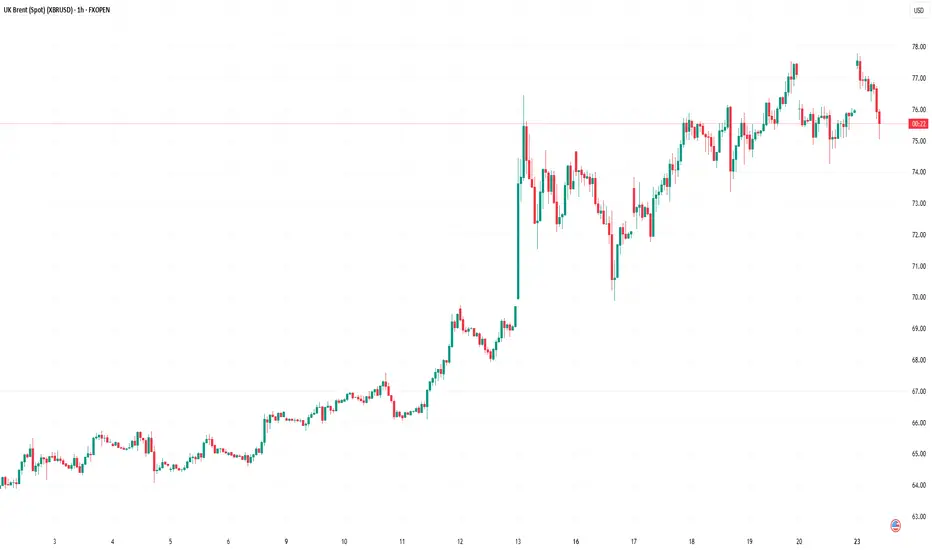
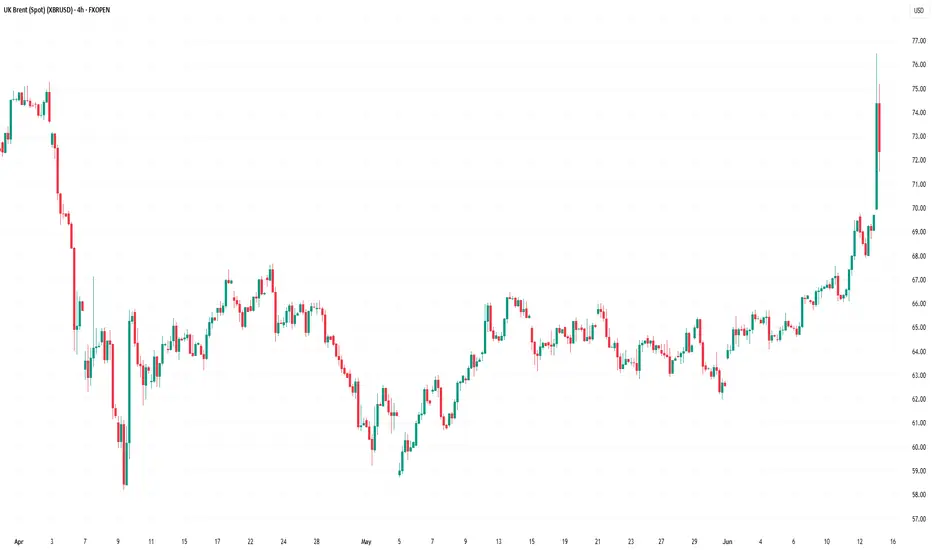
Oil Price Falls Below $69Oil Price Falls Below Pre-Escalation Levels of Middle East Conflict
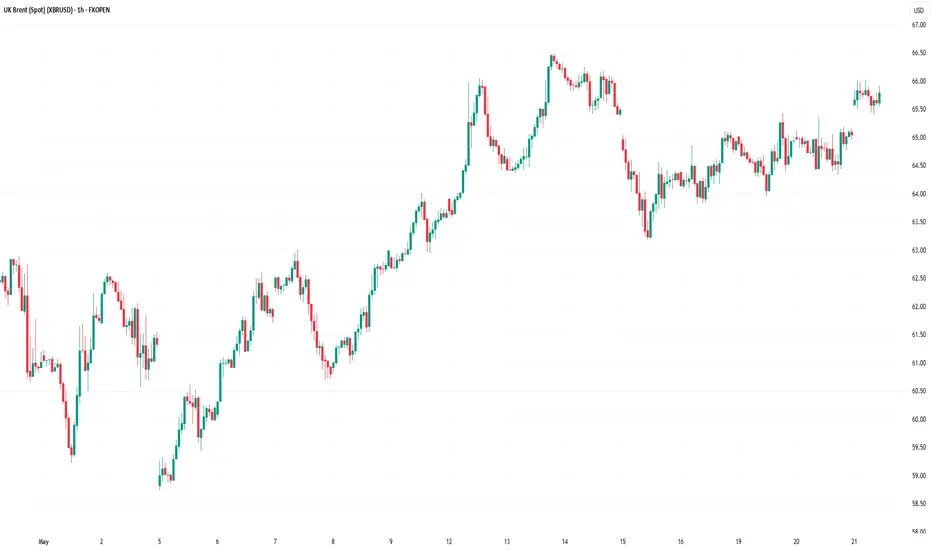
According to the XBR/USD chart:
→ Prior to Israel’s airstrikes on Iran on 13 June, the price of Brent crude was hovering around the $69.00 mark;
→ Following US bombings in Iran, the price spiked at the Monday market open, reaching a high of approximately $77.77 (as we reported on 23 June).
However, after President Trump announced a ceasefire between Iran and Israel — later confirmed by statements from both sides — oil prices dropped sharply. This morning, Brent is trading around $68, which is even lower than the level seen before the initial strikes.
Media outlets report that analysts broadly agree that fears have eased, even if the ceasefire appears fragile. Market participants seem to view the likelihood of the conflict escalating into a full-scale ground war — involving US troops and the closure of the Strait of Hormuz — as low. Shipping through the strait is reportedly returning to normal.
Technical Analysis of the XBR/USD Chart
Interestingly, the $69 level — from which prices surged on 13 June — acted as resistance yesterday (as indicated by the arrow on the chart).
It can be assumed that the longer the ceasefire holds, the less relevant the fears that have served as bullish drivers. In that case, Brent crude prices may continue fluctuating within a downward channel, outlined in red, with the possibility of a short-term rise toward its upper boundary.
Nevertheless, the key drivers for oil prices will remain the fundamental backdrop and official statements regarding the situation in the Middle East and other geopolitical factors.
This article represents the opinion of the Companies operating under the FXOpen brand only. It is not to be construed as an offer, solicitation, or recommendation with respect to products and services provided by the Companies operating under the FXOpen brand, nor is it to be considered financial advice.
Geopolitics vs. Technical: Will Oil Correct -7%?Oil ( FX_IDC:USDBRO ) rose more than +20% after the start of tensions between Iran and Israel on Friday . I hope this tension ends as soon as possible because tensions have no winners.
The behavior and price movements of oil will certainly depend on the increase or decrease of tensions in the Middle East , but for the coming hours we can have a technical view .
Oil is currently moving in the Resistance zone($78.70-$74.70) and near the Resistance lines and the Yearly Pivot Point .
In terms of Elliott Wave theory , it seems that Oil has completed the second five-impulse waves . So that wave 5 is Truncated .
I expect Oil to decline in the coming hours, this decline could be -7% .
Note: If the USA is added to the Middle East tensions, Oil prices could rise again, so pay more attention to capital management.
Note: Stop Loss: $79.00
Please respect each other's ideas and express them politely if you agree or disagree.
U.S. Dollar/ BRENT CRUDE OIL (USDBRO), 4-hour time frame.
Be sure to follow the updated ideas.
Do not forget to put a Stop loss for your positions (For every position you want to open).
Please follow your strategy and updates; this is just my Idea, and I will gladly see your ideas in this post.
Please do not forget the ✅' like '✅ button 🙏😊 & Share it with your friends; thanks, and Trade safe.

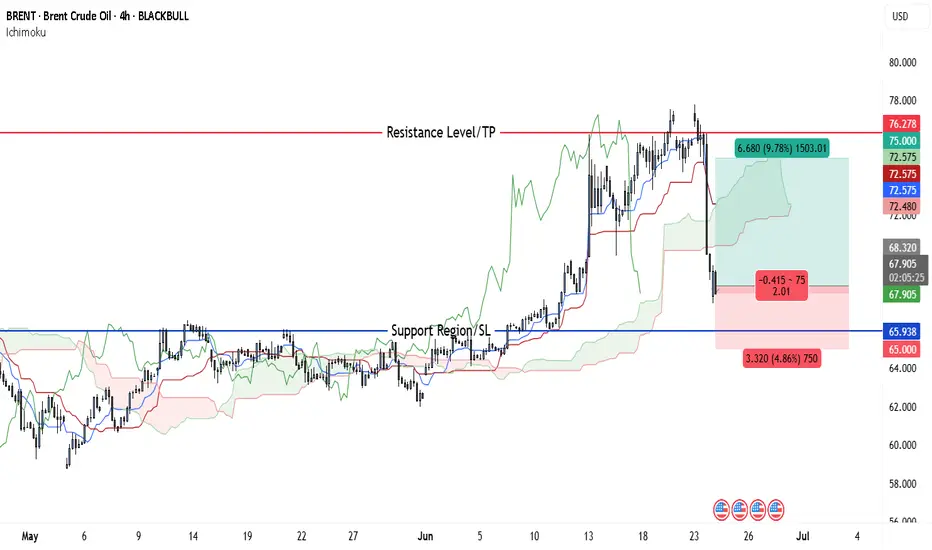
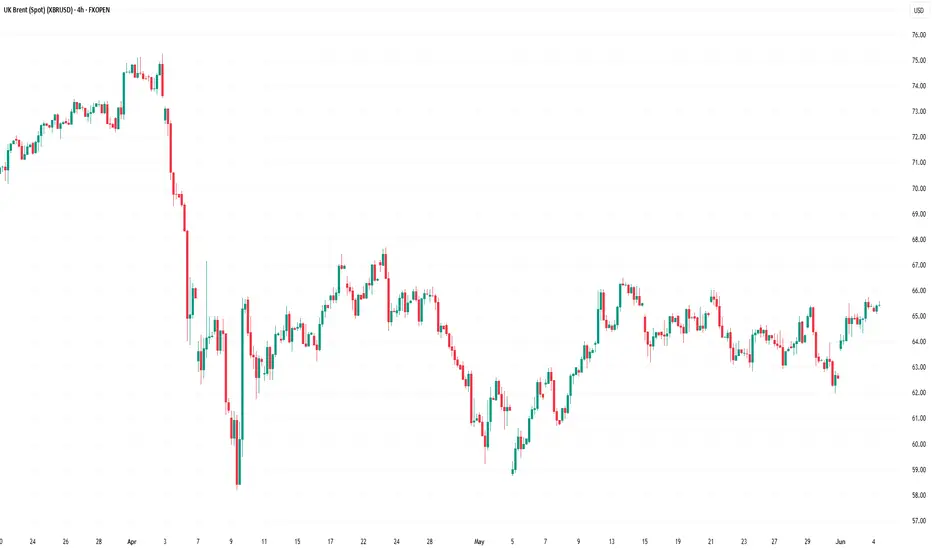
Crude Could Rally to $75 — Entry Opportunity Still Alive at $68Brent Crude Oil is setting up for a potential bullish continuation on the 4-hour timeframe. After a sharp pullback from its recent high near $76.28, price found support around the $65.93–$66 zone—an area that previously acted as strong resistance and now serves as a bullish flip level. The price is consolidating above this reclaimed support and forming a base within the Ichimoku cloud, indicating a possible accumulation phase before the next leg higher.
Ichimoku components support the bullish outlook: the cloud remains green, the Tenkan-sen is curling upward, and price is stabilizing above both the Kijun-sen and the flat Senkou Span A. These are typically early signs of a bullish continuation. The bullish thesis is further strengthened by broader geopolitical risks, particularly Iran’s increased influence over the Strait of Hormuz, which remains a critical oil transit route. Any disruption in this corridor could immediately pressure global supply and send oil prices higher.
This aligns with recent bullish projections (not exactly with the pricing but with the intent): Citi forecasts Brent could reach $75–78 if Iran related disruptions cut 1.1 mbpd, while Goldman and JPMorgan warn $100–120+ spikes if the Strait of Hormuz is threatened. The Guardian notes the shipping chokepoint transports ~20% of global oil, and even brief disruptions could add $8–30 / barrel in volatility.
Trade Setup:
• Entry: $67–$68
• Stop-Loss: $65
• Take Profit: $75
This provides a risk-reward ratio of 1:4, with nearly 12% upside potential. Given the convergence of strong technical structure and real-world catalysts, this setup offers a compelling opportunity for bullish Brent traders aiming to catch the next breakout.
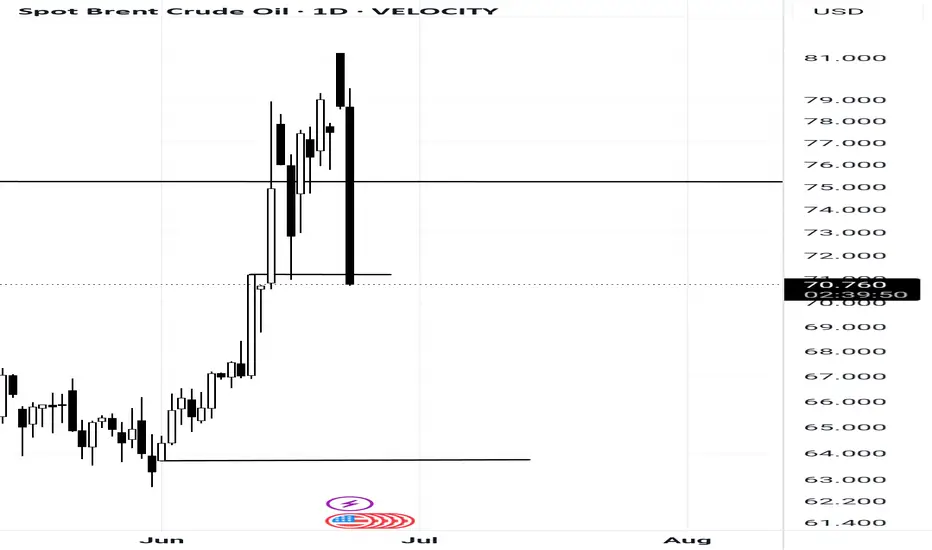
Brent Crude still in controlled yr 2025 range ~ 75 - 71 - 63 USThe Brent crude oil price today underwent a technical correction in the D1 / Day time frame as seen from a technical analysis standpoint. It has not yet broken out to indicate Panic in markets of while being within controlled thresholds .
2025 opening price level : USD 75 ;
MAY face support at USD 71 which is JUNE resistance ; can range around this price line
Next drop below June 2025 opening price : USD 63
Experience in markets also say that in order to go Up , markets need a timely Correction (preliminary down move )too !!
Time to Wait and Watch !
Brent oilOil prices fell! Trump's tweet sent oil prices lower. But the last three candles were probably because the market was expecting a stronger reaction from Iran, but it is likely that the US will not respond again.
Oil Price Surges at Monday Open Amid US Strikes on IranOil Price Surges at Monday Open Amid US Strikes on Iran
As shown on the XBR/USD chart, the Brent crude oil price formed a bullish gap at the opening of financial markets this Monday, surpassing last week’s high.
Only three days ago, we drew attention to Donald Trump’s statement that a decision regarding US involvement in the Iran-Israel conflict would be made within two weeks – yet over the weekend, US aircraft dropped bombs on Iran’s nuclear facilities.
Now oil prices are likely to be affected by Iran’s potential move to block shipping traffic through the Strait of Hormuz. According to Reuters, analysts suggest that in such a scenario, the oil price could climb to $100.
Technical Analysis of the XBR/USD Chart
The ascending channel plotted last week remains valid.
The fact that the price is pulling back (as indicated by the arrow) from the high set at the market open suggests the market had already priced in a significant risk of US involvement in the Iran-Israel military conflict.
Key points:
→ Technical support in the near term may be provided by the area where the lower boundary of the blue channel intersects with the $76 level (which acted as resistance at the end of last week).
→ Ultimately, fundamental factors and official statements will play a decisive role in oil price movements. It’s worth noting that, following the strikes on its territory, Iran is threatening retaliation against the US.
This article represents the opinion of the Companies operating under the FXOpen brand only. It is not to be construed as an offer, solicitation, or recommendation with respect to products and services provided by the Companies operating under the FXOpen brand, nor is it to be considered financial advice.
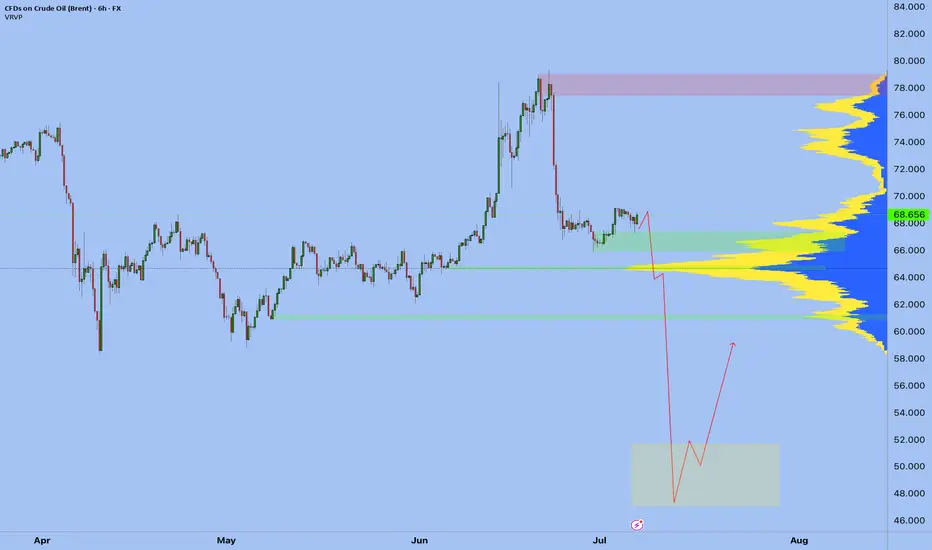
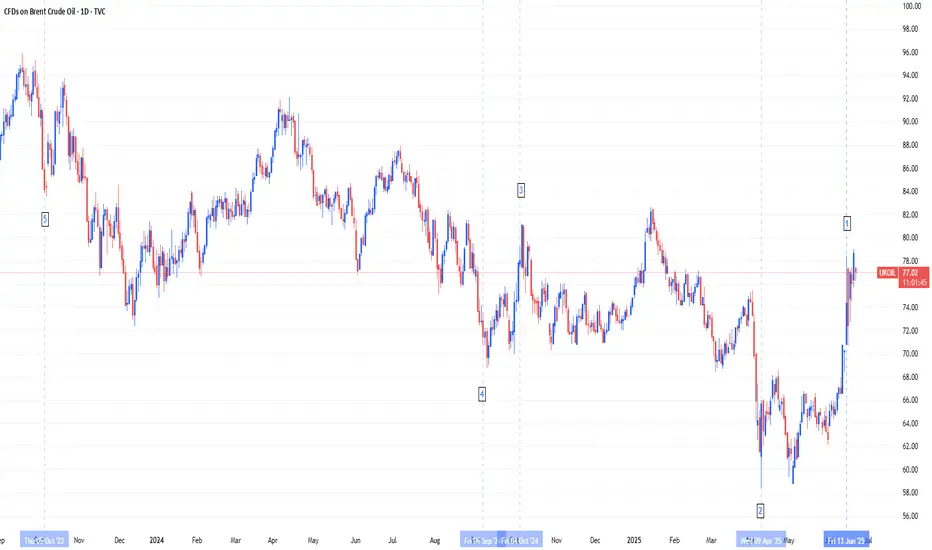
Brent Crude Oil's Defining Moments: Analyzing the Top 5 MovesThe oil market has experienced unprecedented volatility over the past two years, with five pivotal moments generating the most significant price movements in Brent crude.
The Top 5 Market Movers:
1. June 13, 2025 (+7.02%): Israeli airstrikes on Iranian nuclear and oil facilities triggered the largest single-day surge to $74.23/barrel, demonstrating how geopolitical events can instantly drive supply disruption fears.
2. April 8, 2025 (-15.67% over 5 days): Trump's tariff escalation and US-China trade war intensification caused the most severe multi-day decline, ending at $62.82/barrel as traders priced in global economic slowdown.
3. October 7, 2024 (+12.76% over 5 days): Escalating Israel-Iran tensions drove a significant rally to $80.93/barrel as markets built in geopolitical risk premiums ahead of expected retaliatory strikes.
4. September 3, 2024 (-6.41%): Libya's oil dispute resolution combined with weak global demand outlook caused a sharp drop to $73.75/barrel, showing how supply resolutions can trigger selloffs.
5. October 6, 2023 (-11% weekly crash): The end of driving season combined with demand concerns and interest rate fears triggered the biggest weekly decline since March 2023, with Brent falling to $84.07/barrel as gasoline demand hit yearly lows.
Current Fundamental Landscape and Path Forward
The EIA forecasts Brent averaging $66/barrel in 2025 and $59/barrel in 2026, below recent levels due to trade uncertainties and slower growth. Three key factors will drive future prices: US-China trade resolution, Middle East geopolitical risks, and OPEC+'s production strategy. Recent volatility shows that while fundamental supply-demand dynamics remain important, geopolitical events, trade policies, and seasonal demand patterns can generate dramatic price swings that overwhelm traditional market forces.
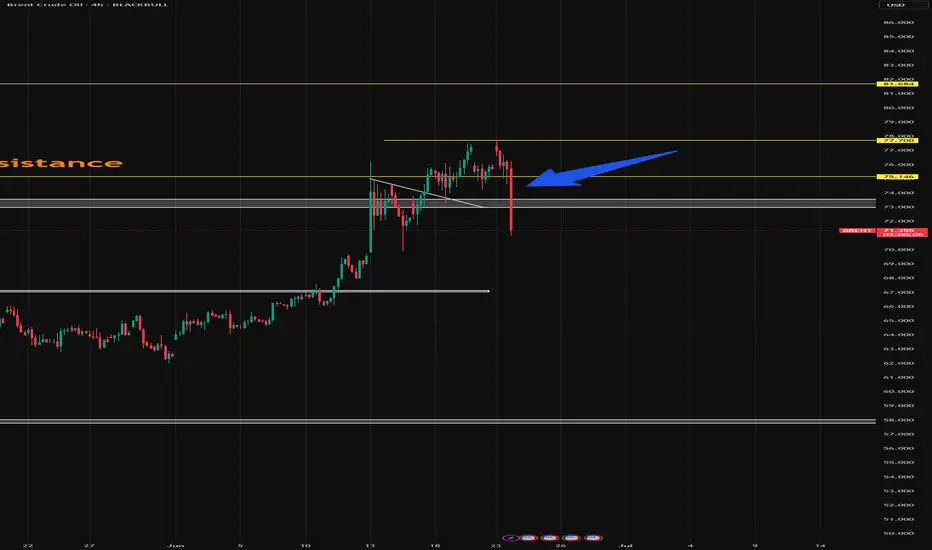
XBR/USD Chart Analysis: Oil Price Falls After Trump’s DecisionXBR/USD Chart Analysis: Oil Price Falls After Trump’s Decision
As shown on the XBR/USD chart, the price of Brent crude oil has pulled back from yesterday’s 4.5-month high following a statement from the White House that President Donald Trump will make a decision within the next two weeks on whether the United States will take part in the Israel-Iran conflict.
According to Reuters, the US President is facing backlash from some members of his team over the prospect of launching a strike against Iran, which could drag the US into yet another prolonged war.
Technical Analysis of the XBR/USD Chart
From a technical standpoint, Brent crude oil price is developing within an upward channel (marked in blue), though several bearish signals are appearing on the chart:
→ a bearish gap that formed overnight;
→ a false bullish breakout (indicated by an arrow) above the $76.50 level, drawn from the 13 June high;
→ bearish divergence on the RSI indicator;
→ a break of the recent local ascending trendline (marked in orange).
Given the steep angle of the rising blue channel, it is reasonable to assume that bears may attempt to break through its lower boundary, which is currently acting as support. Whether this scenario materialises in the oil market will largely depend on developments in the Middle East.
This article represents the opinion of the Companies operating under the FXOpen brand only. It is not to be construed as an offer, solicitation, or recommendation with respect to products and services provided by the Companies operating under the FXOpen brand, nor is it to be considered financial advice.

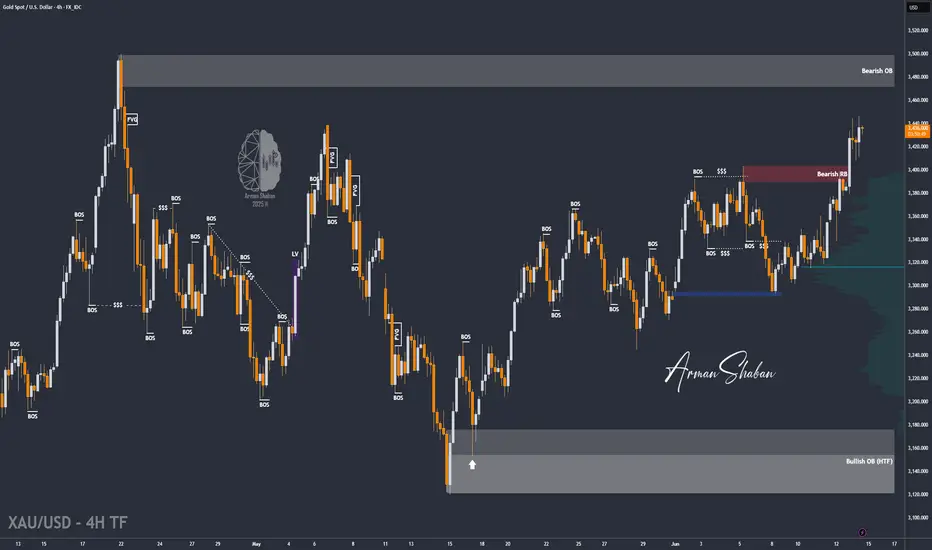
Gold Breaks $3400 – Targets $3500 Amid Tensions (READ)By analyzing the gold chart on the lower timeframe, we can see that today, following Israel's missile and airstrike attacks on Iran, gold experienced a sharp rally. As anticipated last night, gold finally managed to break through the strong $3400 resistance, surging over 600 pips to reach $3447.
Currently, gold is trading around $3438, and given the escalation in geopolitical tensions, I expect further upside movement.
The next potential targets are $3449, $3469, and possibly $3500.
⚠️ Due to ongoing conflict and extreme volatility, it's advised to avoid trading or proceed only with minimal risk exposure.
Please support me with your likes and comments to motivate me to share more analysis with you and share your opinion about the possible trend of this chart with me !
Best Regards , Arman Shaban
Israel Strikes Iran. Oil and Gold Prices SurgeIsrael Strikes Iran. Oil and Gold Prices Surge
According to media reports, Israel launched a large-scale overnight strike on Iranian territory, targeting dozens of military and strategic facilities linked to the country’s nuclear programme and missile capabilities. Israeli officials justified the action by citing an existential threat from Tehran, which, according to their intelligence, is accelerating its development of nuclear weapons and expanding its arsenal of ballistic missiles.
In response, Iran has vowed severe retaliation, stating that the United States and Israel will “pay a heavy price” for the attack. US President Donald Trump has urgently convened a meeting to assess the situation.
Commodities Market Reaction
In the wake of these developments, gold — the primary safe-haven asset — surged sharply. The XAU/USD price broke above its May high, rising past $3,440. However, the all-time high near $3,498 remains intact for now.
Oil prices also spiked due to fears of supply disruption. The military conflict threatens shipping through the Strait of Hormuz, a crucial chokepoint through which one-fifth of the world’s oil supply passes. Traders quickly priced in the risk of war, anticipating a supply shortage driven by large-scale instability in the Middle East.
Technical Analysis of the XBR/USD Chart
Brent crude oil price has risen to the upper boundary of a large-scale descending channel (shown in red), which is defined by lower highs from 2024–2025. As anticipated, this upper boundary acted as resistance, with the price forming a peak above $76 before reversing downward (as illustrated by the black arrow).
From a technical standpoint, following such a sharp rally, Brent is vulnerable to a corrective move. In this scenario, a pullback into the orange zone is possible, where support may be found at:
→ The psychologically important $70 level;
→ The 50% Fibonacci retracement level;
→ The former resistance of the purple descending trendline, now turned support.
Nevertheless, given the scale of the geopolitical threat, it is unlikely that market sentiment will allow Brent to decline significantly in the near term.
This article represents the opinion of the Companies operating under the FXOpen brand only. It is not to be construed as an offer, solicitation, or recommendation with respect to products and services provided by the Companies operating under the FXOpen brand, nor is it to be considered financial advice.
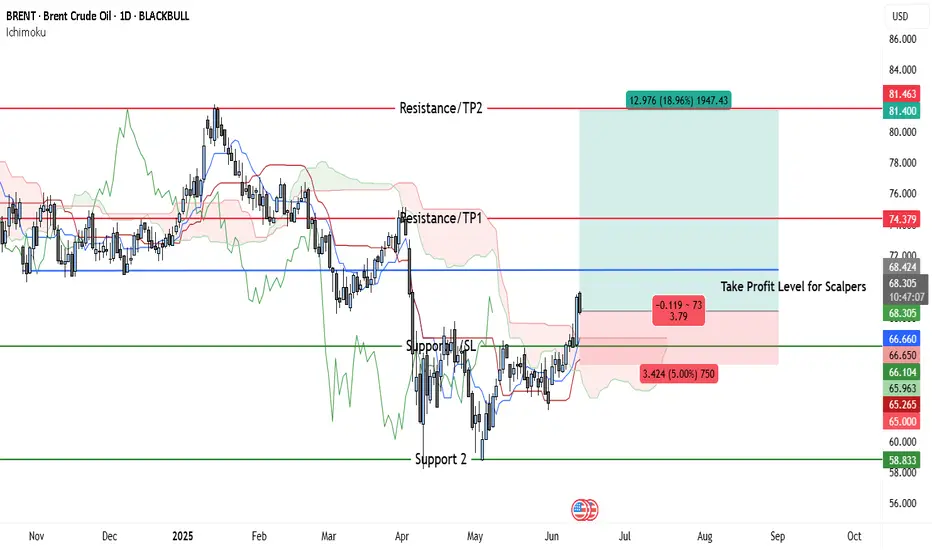
Brent Bulls Eye $74 & $81 — 2 Profit Points, 1 Tight StopBrent crude has confirmed a bullish breakout on the daily chart after closing decisively above the key horizontal resistance near $66.65. This level had acted as strong overhead pressure over the last two months but has now flipped into support, reinforcing the bullish sentiment.
Price is currently trading at $68.18, just above the newly established support zone, and showing strength after consolidating in a tight range. The Ichimoku Cloud system further validates this bullish move. The price has cleanly broken through the Kumo (cloud), and the Tenkan-sen has crossed above the Kijun-sen, forming a classic bullish crossover. The Chikou Span is also above the price, indicating momentum is firmly in the bulls’ favor.
The immediate upside target is the $74.38 resistance, which corresponds to a key prior swing high from earlier this year. This zone is expected to act as the first major take-profit level for swing traders. If the bullish momentum persists, the next target lies at $81.40, a previous supply zone and psychological resistance. The path from current levels to that area appears technically open, with relatively little congestion in between.
Risk-reward analysis supports the long setup. Entering near the current price, with a stop-loss just below $66.10, provides a downside risk of around 3%, while the potential upside to TP1 and TP2 offers gains of approximately 9% and 19%, respectively. This yields a favorable R:R of roughly 1:3 to 1:6, depending on the exit strategy.
For scalpers, the area around $68.42 marks an intraday take-profit zone. However, scalpers must adjust their stop-losses dynamically, based on individual risk tolerance. A tighter stop might sit around $66.65, while more conservative scalpers may prefer to give room down to $66.10.
The secondary support around $58.83 marks a major floor but is currently distant and would only be in play if Brent fails to hold $65—an unlikely scenario given current strength and volume.
In summary, Brent crude’s technical structure favors further upside, with bullish momentum confirmed by both price action and Ichimoku alignment. A retest of $66.65 could present a buying opportunity, but failure to hold above that would invalidate the setup. As long as the price stays above the cloud and key supports, the bullish case remains intact.
CRUDE OIL (WTI): Detailed Support & Resistance Analysis
Here is my latest structure analysis for WTI Oil.
Resistance 1: 63.6 - 65.9 area
Resistance 2: 68.2 - 69.2 area
Resistance 3: 71.4 - 75.2 area
Support 1: 61.8 - 62.8 area
Support 2: 59.0 - 60.8 area
Support 3: 55.1 - 57.2 area
Consider these structures for pullback/breakout trading.
❤️Please, support my work with like, thank you!❤️

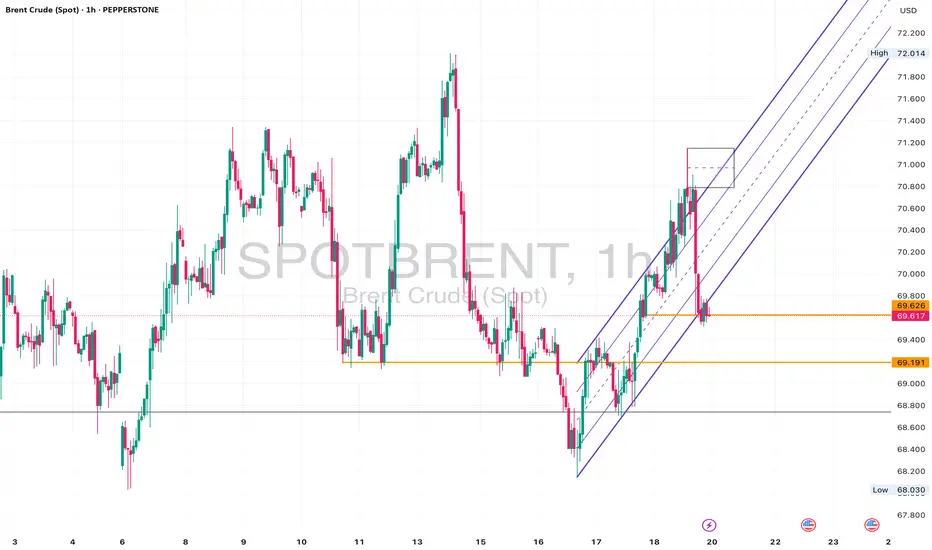
XBR/USD Chart Analysis: Brent Crude Reaches 1.5-Month HighXBR/USD Chart Analysis: Brent Crude Reaches 1.5-Month High
In our analysis of Brent crude oil six days ago, we identified a large contracting triangle and a local ascending channel. We also outlined a potential scenario involving a bullish breakout above the upper boundary of the triangle.
Although this was not the base-case scenario, the XBR/USD chart now suggests it has played out: yesterday, the price climbed to nearly $67 per barrel — its highest level since the end of April.
The main bullish catalyst appears to be ongoing trade talks between the United States and China, which have raised hopes of a resolution to tariff-related tensions between the world’s two largest economies.
At the same time, rising oil prices may exacerbate geopolitical tensions, particularly amid Israeli threats to strike ports in Yemen — a risk that could disrupt supply chains across the Middle East.
Technical Analysis of the XBR/USD Chart
From a technical perspective:
→ Brent crude continues to move within an ascending channel (marked in blue);
→ the upper boundary may now act as a support level.
The fact that the price is holding in the upper half of the channel indicates strong demand-side pressure. Based on this, it is reasonable to assume that as long as Brent remains above the $65.75 level (the retest zone of the breakout), the technical outlook will remain predominantly bullish.
This article represents the opinion of the Companies operating under the FXOpen brand only. It is not to be construed as an offer, solicitation, or recommendation with respect to products and services provided by the Companies operating under the FXOpen brand, nor is it to be considered financial advice.

XBR/USD Chart Analysis: Oil Price Rises to Key ResistanceXBR/USD Chart Analysis: Oil Price Rises to Key Resistance
Yesterday, the price of Brent crude climbed above $65.60 — the highest level in over a week.
According to media reports, several bullish factors are driving this move:
→ Stalled negotiations between the US and Iran over abandoning Iran’s nuclear programme in exchange for lifting oil export sanctions;
→ Wildfires in Canada, which have significantly reduced oil output;
→ Market reaction to the OPEC+ meeting held over the weekend;
→ A weakening US dollar.
Technical Analysis of the XBR/USD Chart
From a technical standpoint, Brent crude oil:
→ Has been forming a short-term ascending channel (marked in blue) since the beginning of the week;
→ Has approached a major resistance level.
This resistance is defined by the upper boundary of a narrowing triangle, with its central axis around the $63.70 level — a price that could be considered a fair value based on trading over the past one and a half months.
This situation points to two possible scenarios:
→ A downward reversal from the key resistance, with expectations that the price will return to the triangle’s central axis. A break below the lower boundary of the local blue channel would support this scenario.
→ An attempt at a bullish breakout of the triangle. While this scenario cannot be ruled out, it appears less likely due to the global economic slowdown risks posed by tariff-related trade barriers.
This article represents the opinion of the Companies operating under the FXOpen brand only. It is not to be construed as an offer, solicitation, or recommendation with respect to products and services provided by the Companies operating under the FXOpen brand, nor is it to be considered financial advice.
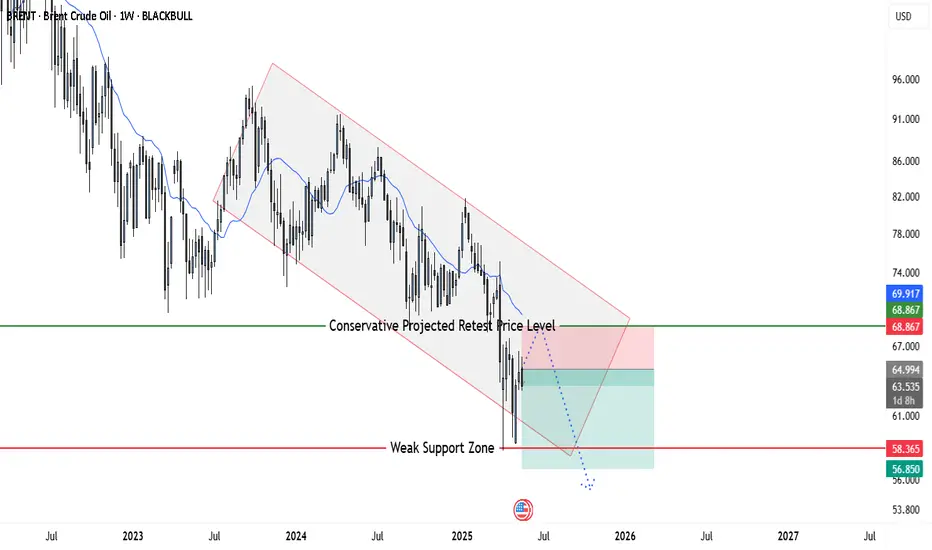
Brent Crude Oil Weekly Short Trade SetupBrent Crude Oil Weekly Short Trade Setup (as of May 22, 2025)
This chart reflects a prolonged downtrend within a clearly defined descending channel. Brent Crude Oil continues to respect the dynamic resistance of the upper boundary and has failed to sustain bullish momentum in recent months. The current price action presents a low-risk, high-reward short opportunity based on technical structure and projected price movement.
Entry Price: 64.994
The entry level at 64.994 is tactically chosen near the midpoint of the descending channel and slightly below the recent consolidation area. This level marks a rejection zone where price previously attempted to break higher but failed to gain traction.
The reason for this entry is:
• Price is reacting to the 20-period moving average (blue line), which has consistently acted as dynamic resistance.
• The last bullish push failed to close above the mid-channel zone and reversed near the projected retest line, indicating sellers are still in control.
• Entering here means you're entering after confirmation of a failed breakout rather than preemptively.
This is a conservative but smart entry point, favoring a continuation move in the direction of the dominant trend.
Stop Loss: 68.867
The stop loss is placed at 68.867, which aligns with the chart’s "Conservative Projected Retest Price Level" marked in green.
Here’s why this stop makes technical sense:
• This area corresponds to prior horizontal resistance and is very close to the descending channel’s upper boundary.
• A move above this zone would invalidate the bearish structure, suggesting a potential shift in momentum.
• Setting the stop here protects the trade against a deeper bullish retracement while still giving it enough room to breathe around minor fluctuations.
The risk is controlled, and you're only exiting if the market structure genuinely breaks.
Take Profit: 56.850
The take profit level is projected at 56.850, slightly above the "Weak Support Zone" marked in red.
The reasoning:
• This zone has acted as prior psychological support, but the label “weak” implies limited buyer strength here, increasing the chance of a breakdown.
• Price has tested this level before and rebounded only modestly, suggesting vulnerability.
• It also aligns closely with the lower boundary of the descending channel, which provides technical confluence as a realistic downside target.
• Setting TP just above support allows for safer profit booking without being too greedy, avoiding the risk of reversal right at a major support.
This exit point balances profit potential and probability, giving the trade a favorable risk-to-reward ratio.
Trade Structure Summary
• Trend: Bearish (confirmed by lower highs/lower lows and downward-sloping channel)
• Technical Confluence: Dynamic resistance, channel boundaries, horizontal zones, moving average rejection
• Market Sentiment: Weak upside follow-through despite occasional rallies, suggesting bearish control
Risk-Reward Outlook
• Entry: 64.994
• Stop Loss: 68.867
• Take Profit: 56.850
• Risk (SL - Entry): 3.873
• Reward (Entry - TP): 8.144
• Risk-Reward Ratio: Approximately 1:2.1
This setup offers more than twice the reward for the risk taken, making it an attractive candidate for traders seeking asymmetrical returns.
Oil Prices Surge Amid Threat of Strike on IranOil Prices Surge Amid Threat of Strike on Iran
As shown on today’s XBR/USD chart, Brent crude oil prices have jumped (as indicated by the arrow) to a one-week high. This surge follows U.S. intelligence reports suggesting that Israel may be preparing to strike Iran’s nuclear facilities.
Although CNN, citing officials, noted that it remains unclear whether Israeli leaders have made a final decision, oil prices are rising as markets price in the risk of escalation disrupting Middle Eastern oil supply chains:
→ Iran is the third-largest oil producer within OPEC.
→ There is concern that Iran could retaliate by blocking the Strait of Hormuz in the Persian Gulf — a key shipping route used by Saudi Arabia, Kuwait, and others to export oil products.
Technical Analysis of XBR/USD
Brent crude oil price has climbed towards the descending trendline (marked in black), drawn through key highs from April and mid-May. From a bearish perspective, this key resistance could trigger a downward pullback.
On the other hand, recent price action in Brent suggests upward momentum (indicated by blue lines), with the $65.20 level — previously a cap — potentially turning into support after a breakout.
Whether the black resistance line is broken will largely depend on geopolitical developments. It is possible that reports of an imminent missile strike on Iran may later be refuted.
This article represents the opinion of the Companies operating under the FXOpen brand only. It is not to be construed as an offer, solicitation, or recommendation with respect to products and services provided by the Companies operating under the FXOpen brand, nor is it to be considered financial advice.
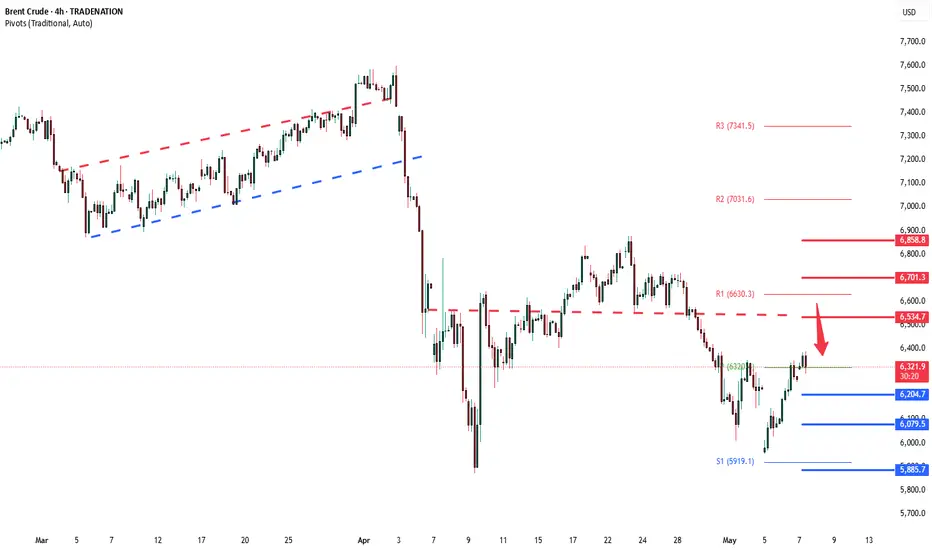
BRENT Crude INTRADAY oversold bounce capped at 6533The price sentiment for Brent Crude Oil remains bearish, in line with the prevailing downtrend. Recent price action shows an oversold rally, which has stalled near a previous consolidation zone around 6533 — a key resistance level.
Key Resistance Level: 6533
This level marks a previous intraday consolidation area and could act as a ceiling for the current rally.
Bearish Scenario:
If WTI fails to break above 6533, it may resume its decline toward:
6207 (near-term support)
6080
5885 (longer-term support)
Bullish Scenario:
A confirmed breakout and daily close above 6533 would shift momentum and open upside targets at:
6707
6860
7040
Conclusion:
WTI Crude Oil remains under bearish pressure unless it breaks and closes above 6533. Traders should monitor this level closely for signs of rejection or breakout.
This communication is for informational purposes only and should not be viewed as any form of recommendation as to a particular course of action or as investment advice. It is not intended as an offer or solicitation for the purchase or sale of any financial instrument or as an official confirmation of any transaction. Opinions, estimates and assumptions expressed herein are made as of the date of this communication and are subject to change without notice. This communication has been prepared based upon information, including market prices, data and other information, believed to be reliable; however, Trade Nation does not warrant its completeness or accuracy. All market prices and market data contained in or attached to this communication are indicative and subject to change without notice.
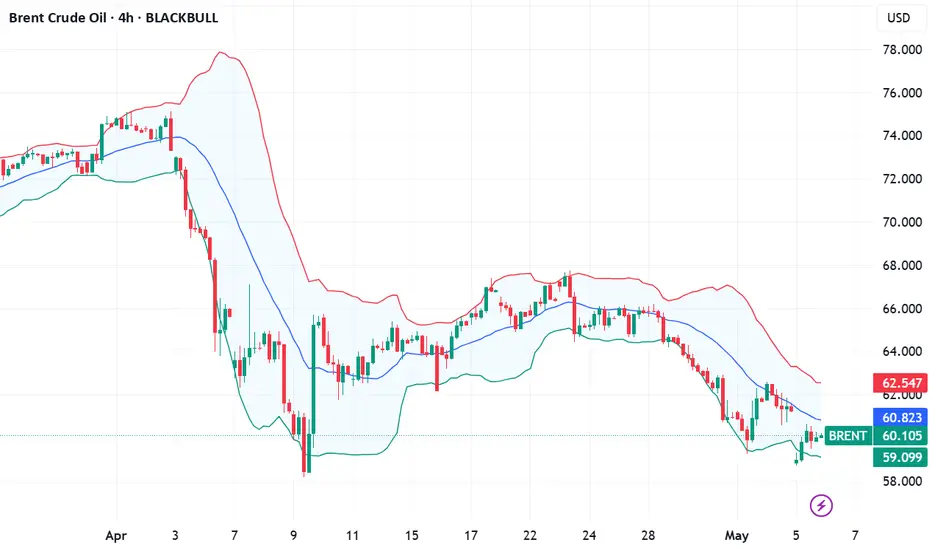
Brent under pressure: A rebound may be comingIn 2025, oil prices have come under significant pressure, falling more than 21% since the beginning of the year — from $75 to around $59 per barrel of #BRENT. This decline was driven by increased production from OPEC+ countries, weak global demand (particularly in Asia), heightened economic risks due to trade disputes, and rising output from non-OPEC producers such as the U.S. and Brazil. Together, these factors created an oversupply amid stagnant demand.
Currently, the oil market continues to be shaped by a range of influencing factors. While accurately predicting prices remains a challenge, several key drivers are likely to steer oil price movements in the near term. Here’s a look at the main bullish and bearish factors:
• Geopolitical tensions (Bullish driver): Ongoing or emerging conflicts in key oil-producing regions (such as the Middle East and Eastern Europe) raise concerns about potential supply disruptions. Even without actual disruptions, the perceived risk leads traders to factor in a “risk premium,” pushing prices higher. Any escalation could trigger sharp price spikes.
• OPEC+ policy (Bullish/neutral driver): The alliance’s production decisions remain a major influence on supply. If OPEC+ maintains or tightens its current output cuts to balance the market or target price levels, this will support price growth or at least stability. Conversely, quota breaches or output increases would weigh on prices.
• Global economic outlook (Bearish/bullish driver): The trajectory of global economic growth directly affects oil demand. Signs of GDP slowdowns in major economies (U.S., China, EU) tend to weaken demand and drag prices lower. On the other hand, if economic growth proves more resilient than expected, it would support oil demand and prices. Uncertainty over the growth path of many countries persists in 2025.
• Non-OPEC+ output growth (Bearish driver): Countries outside of the OPEC+ alliance — including the U.S. (shale), Brazil, Guyana, and Canada — continue expanding their production. Significant output increases from these nations could offset OPEC+ efforts and lead to market oversupply, applying downward pressure on prices.
• Energy transition and underinvestment (Medium-term bullish driver): ESG pressures, the global shift toward renewables, and uncertainty around long-term fossil fuel demand have led to underinvestment in new oil exploration and development. If existing capacity declines faster than new projects come online, a structural supply deficit could emerge, supporting higher prices even amid the energy transition.
FreshForex analysts believe that, given ongoing geopolitical risks, strict OPEC+ policies, and underinvestment in production, the oil market is nearing a potential upward reversal. A modest uptick in demand or increased tension could be enough to put oil back on a growth trajectory.