BTC TO 44KI predict BTC to 44k , im not very good at giving explanations but with every thing happening the crypto hype going on in the us right now with the documents recently signed and all. Plus the technical analysis who clips. It is more than likely.
Btc-analysis
ALERT, ROTATING POSITION! Check previous postBTCUSDT LONG
Entry 40800-41000
Stop 37201
Take 45000-46000
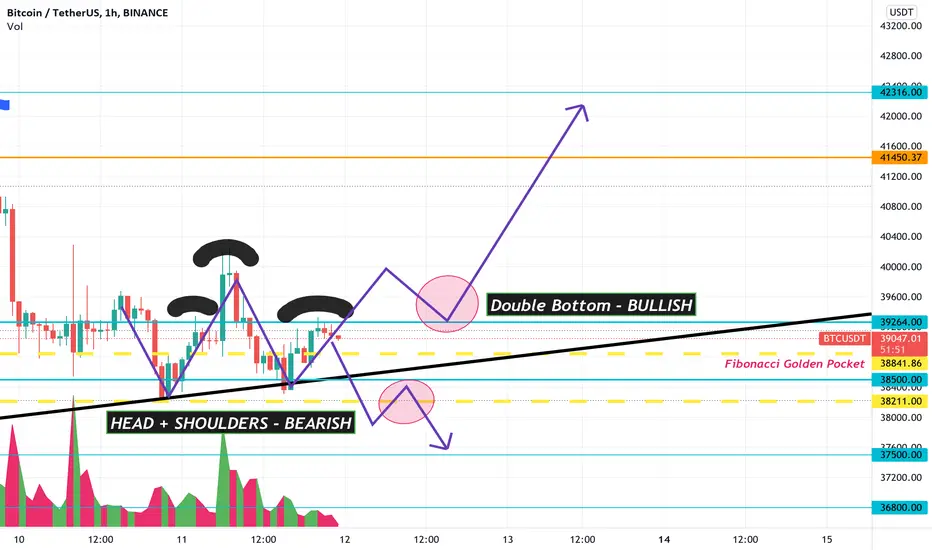
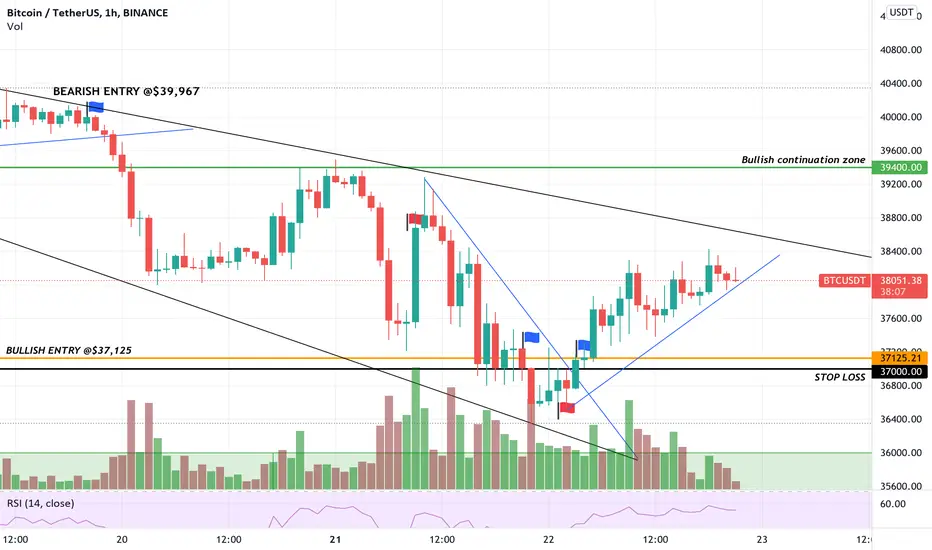
TWO POSSIBLE OUTCOMES FOR BTCDespite all the FUD and Index on Fear and Greed, many are still hopeful that Market Makers are willing to let Bitcoin start Mooning and set the stage for another possible upside fakeout. I have illustrated the two possibilities for this trend moving forward next week. Or Sooner.
The weekend is when big players like to stop loss hunt retail investors….it can be argued that we are in a NO TRADE zone….In my opinion BTC can break up through resistance due to the double bottoms pattern and touching rising support line. Other scenario BTC will reject current resistance and confirm the head and shoulders pattern, leading us to collect the MASSIVE amounts of liquidity in the lower price levels.
Based on the research and knowledge on-chain data suggests best time to buy BTC is anywhere below $38K…..Whales buy there and you bet they are gonna want to buy in cheap one last time….Will we see wyckoff distribution pattern play out as we are in the Shakeout phase? Will the news and war turn positive anytime soon?
Best advice, dollar cost averaging and HODL was the #1 proven strategy backtested by AI trading bots that beat every other strategy. When BTC dips, we have more opportunity.
Godspeed Traders - Remember taking no position is sometimes the most profitable at times.
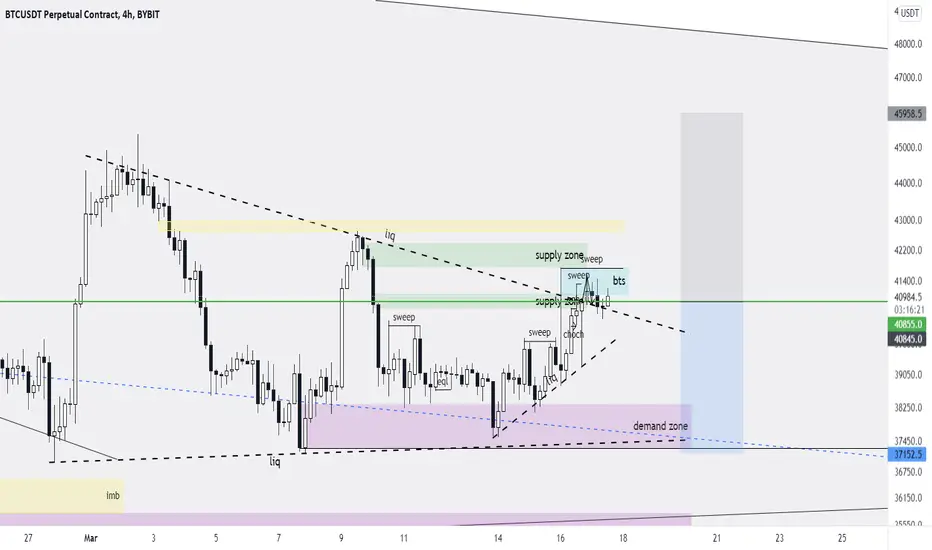
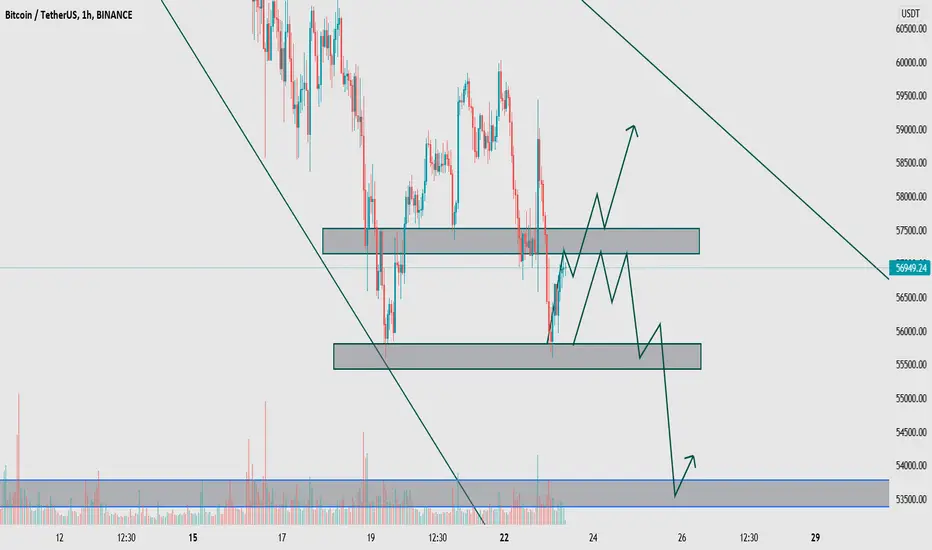
H4 BTC AnalysisIt could reach one or the other rectangle at that point. Let's wait to see if there's clearer buying signals, or if it will keep going down.
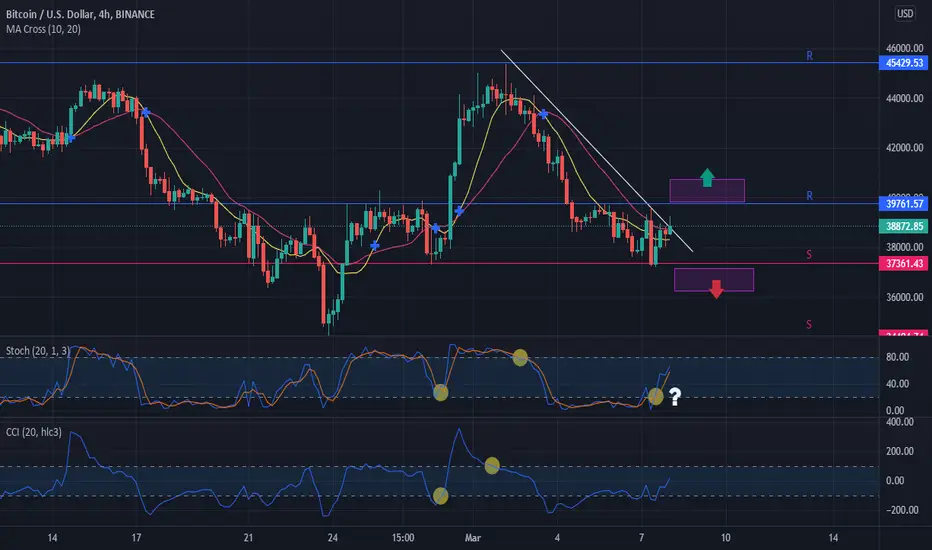
Chart Analysis W/C 07 March 2022W/C = Week Commencing.
This analysis is for personal development with the aim to look back to this chart Sunday 13th March 2022 and see how price action has reacted to these levels.
Please feel free to copy the shared chart tradingview.sweetlogin.com
The chart analysis started with:
1 - Technical Time Analysis - Look back at past price action
Pertinent times where price has moved:
a. 0200 UTC
b. 1015 UTC
c. 1400 UTC
d. 1830 UTC
This is just as reminders that past large price movements have occurred during these times and have seemed to have repeated again and again.
2 - Sessions High and Lows - Look back a Tokyo and New York Sessions Highs and Lows for past confluence areas
a. Several areas have been marked out, the low that occurred today at 11:15 was within a area of 6 previous Session Hs/Ls.
3 - High Volume Recovery Areas - Look back at what areas of high recovery are left behind and their percentage (strength)
4 - Other Key Levels for note - Pivots / VWAPs / Opens / Highs / Lows

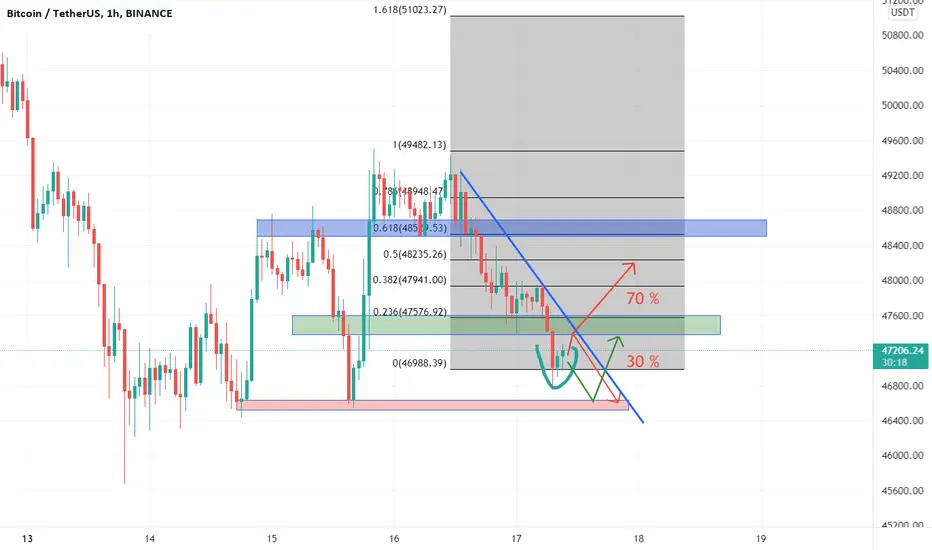
Golden Pocket Confirmed - BTC - Time to go UP?We have entered the Fibonacci support levels and are in. Downtrend. Incredibly, that last divergence before the dip did a perfect mock up of the previous LOW point. Although this time she decided to go down. Best of luck traders!
What do you think will be the next target for Bitcoin?

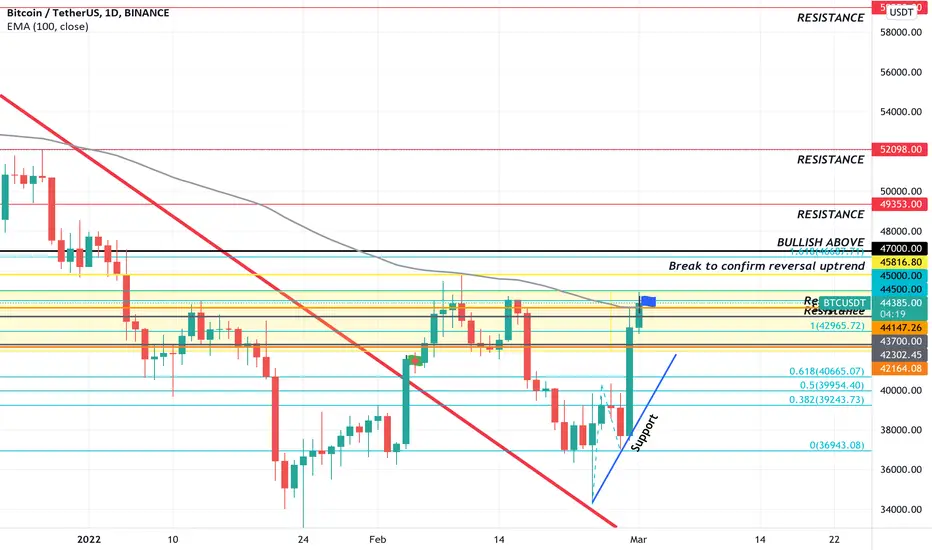
BTC Closing above 100 EMA on Daily Chart!!! This is BULLISH AFHere we go. Buckle your seatbelts. I’m bullish position.
Target $46K take profit…..stop loss @ $43,700
Next level: $52K-$56K
New Support: $42K
LIVE - BTC analysis All information in the Service is provided "as is", with no guarantee of completeness, accuracy, timeliness or of the results obtained from the use of this information, and without warranty of any kind, express or implied, including, but not limited to warranties of performance, merchantability and fitness for a particular purpose.
URGENT: GRAB YOUR CHIPS!!Still holding the bullish position, cautiously eating chips…..waiting for my dips….LFG
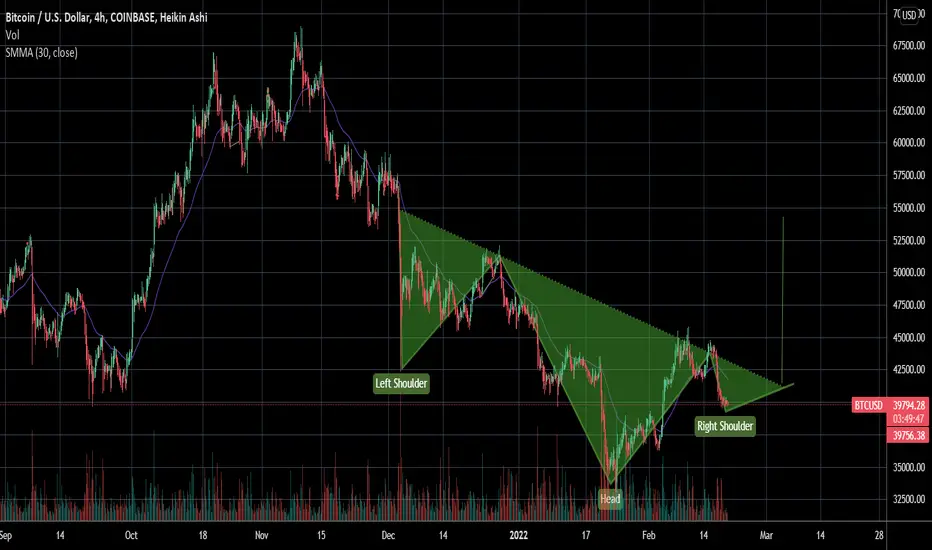
Ugliest inverse Head and Shoulders ever on BTC 4hrLet's see if this ends up playing out against all odds and the extreme Bearish sentiment and fear currently laser focused around both the upcoming March FOMC meeting as well as extremely heightened tensions between the Ukraine and Russia.
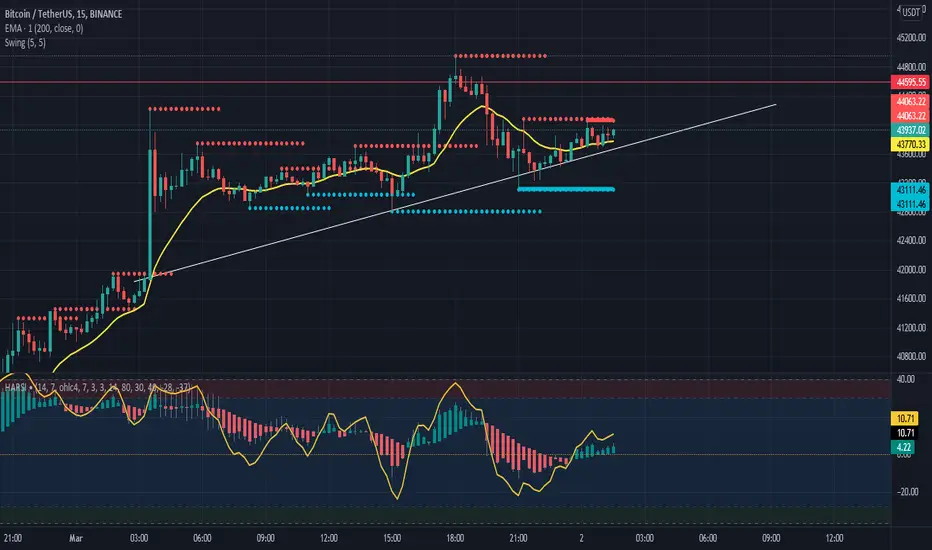
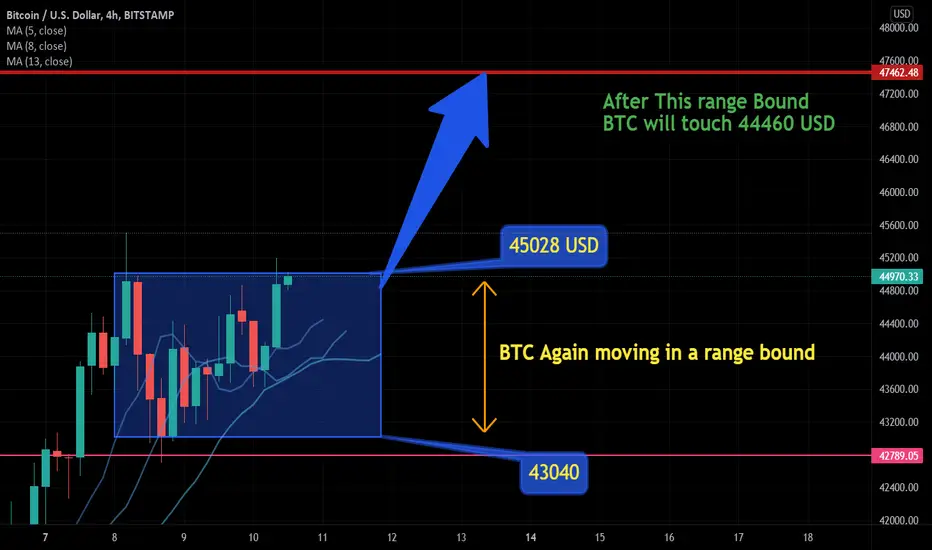
Bullish Signals II BTC Bull Market starting soon Bitcoin is now moving in a range bound zone which between 43040 $ to 45028 $ . After this range bound bitcoin will start moving towards 47460 $ . market is slowing in a bullish zone.
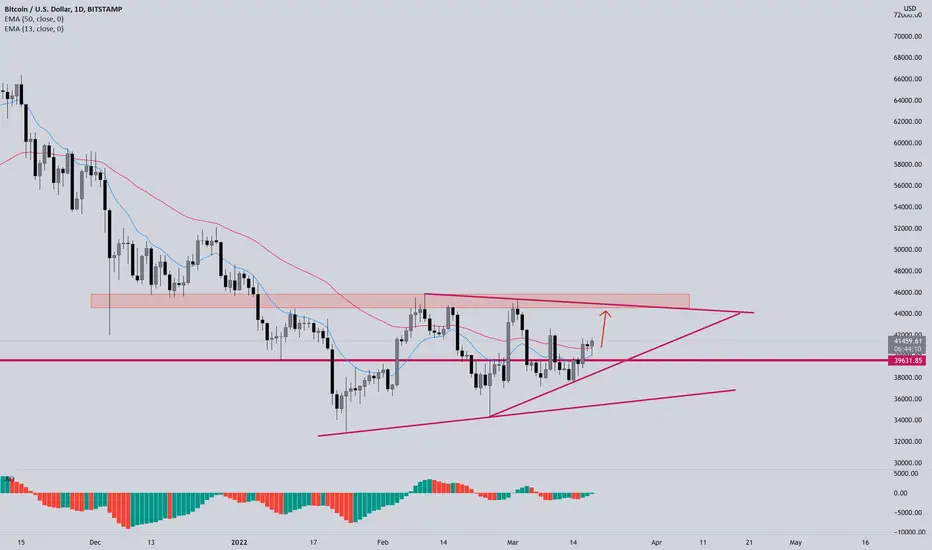
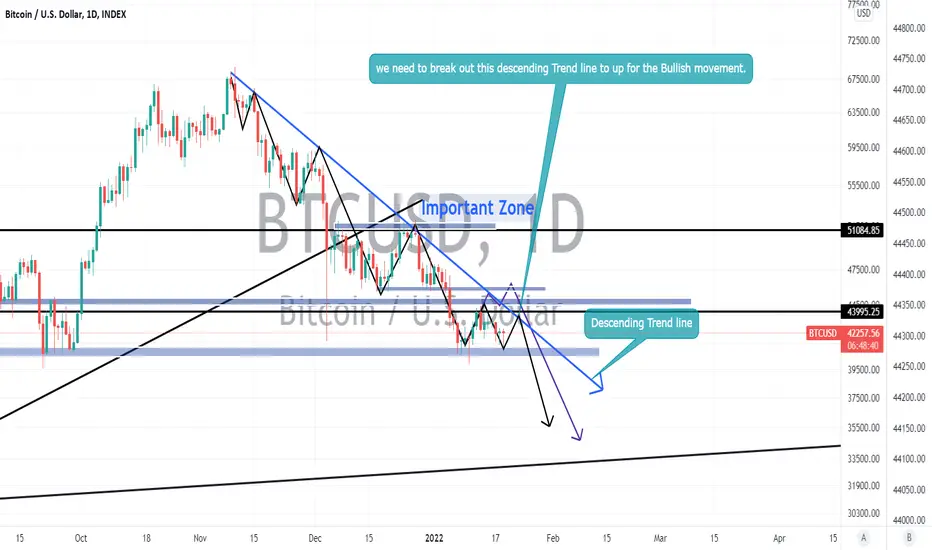
BTC - #BTC &BTC (New Update in Daily Timeframe)Dear Friends
This is a new update in the daily timeframe.
If it can break out this descending trend line then we could expect to go up.
If the volume will be low and not enough to bullish movement then must expect back to support to lowest targets at least 39500 zones.
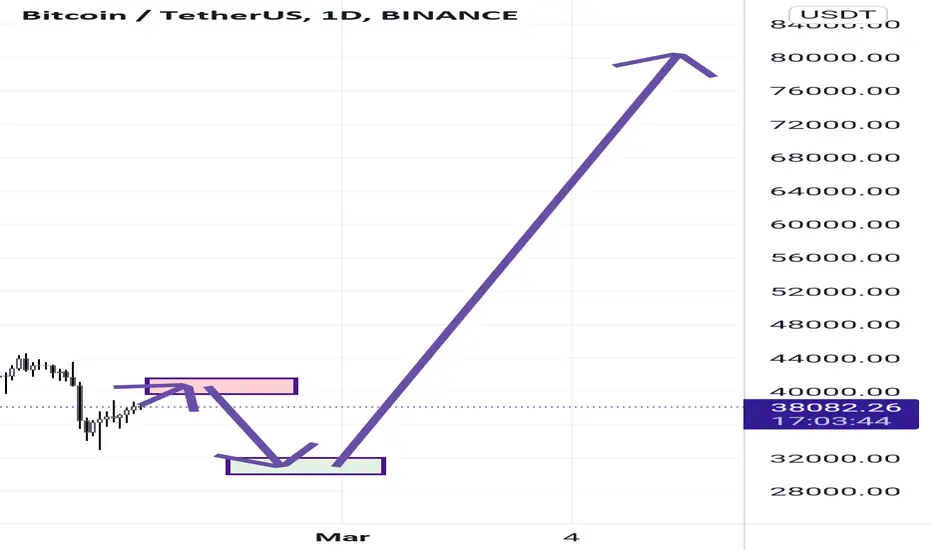
BTC/USDTThe bitcoin is completing the correction and the price will drop again from the range of 40k to 41,800$, and then the upward movement will start from the range of 30k to 32k for the new ATH purpose.
Fortescue Metals: as long as 18.17 is support look for 21.54Alternative scenario: the downside breakout of 18.17 would call for 17.2 and 16.29.
My pivot point stands at 18.17.
My preference: as long as 18.17 is support look for 21.54.
Comment:
The RSI is above its neutrality area at 50.
The MACD is positive and below its signal line.
The stock could retrace in the short term.
Moreover, the stock is trading above both its 20 and 50 day moving average (respectively at 18.88 and 16.89).
Trade Safe -
Jimster45

Bitcoin Analysis | Bitcoin Prediction | Latest Updates#bitcoin #crypto #btcusd #bitcoinprediction #bitcoinnews
Hello guys, this video is only for educational purposes only do your own analysis before you take trades.
in the video, I explain deeply bitcoin analysis and you can learn also how I find this prediction.
if you guys like the video then comment below and share it with your fellow traders and in the future, we make more videos for you.
Good Luck with your trading and Happy New Year.
BTC/USDTBtc is standing on daily strong support if he breaks this support high probibility that Btc will come to 40k to 39k and after seller stophunt complete and Btc will go up
Because we actually see the very huge Tp of sellers so if Btc will trigger it Btc will goup without any tension so wait please for a reversal on D1 support
Happy trading
BTC REPLICATING 2019 MOVE?BTC seems to be following the same exact moves as 2019 if it plays out then the support is at 20k which also indicates that this bull run is over

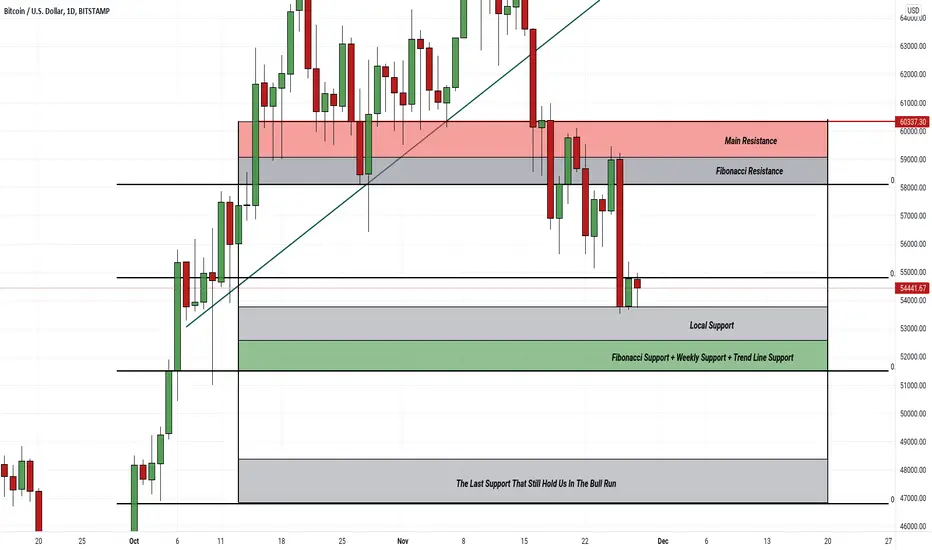
BTC ANALYSISThis is a simple BTC chart that everyone should be able to understand, even if you are new to the crypto world, to sum it up in short we are still in the bull run until we break the 48k support, if a weekly candle close below 48k then I am bearish about BTC
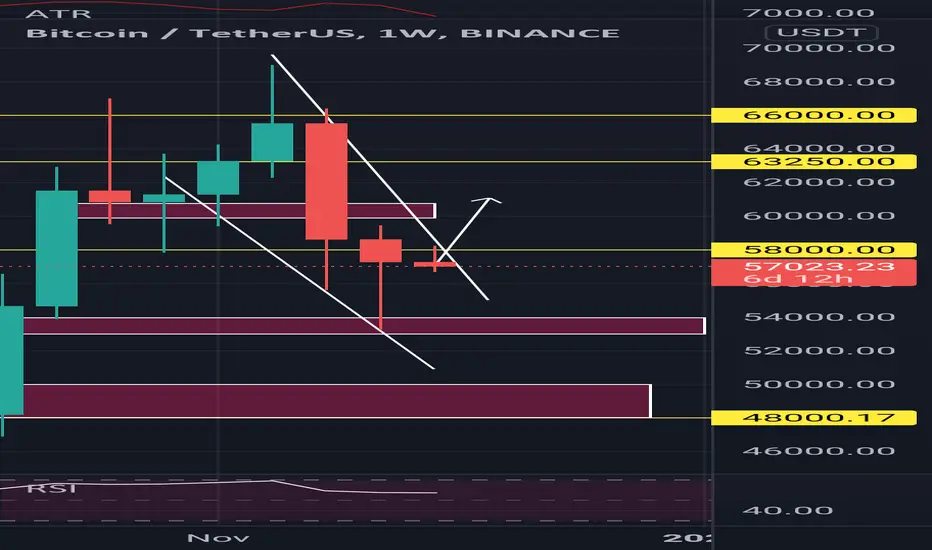
BTC ANALYSISBTC again dumped below 57.5k support and now trying to reclaim it, i have two possible scenarios in my mind
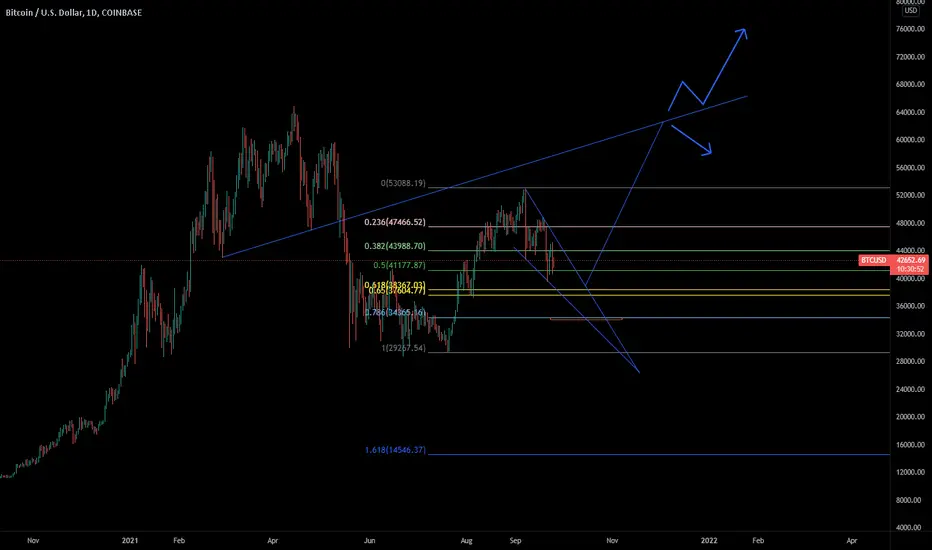
BTC price prediction BTC might get a breakout from the FALLING WEDGE near the GOLDEN POCKET and go for a retest of the neckline of the HEAD AND SHOULDER that we broke previously.
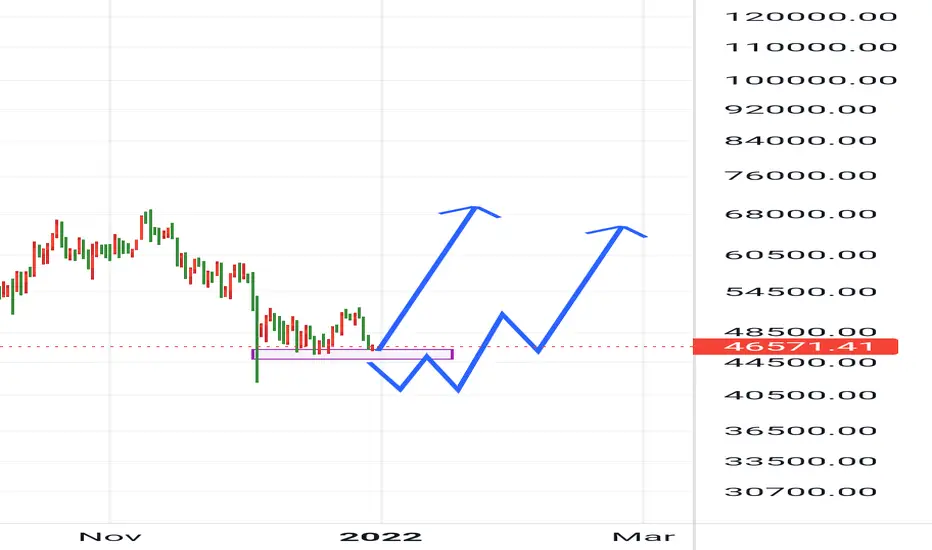
#BitcoinTwo way for #BTC
See on the chart. Which one happen?
sup=40/000-45/000 for 30days
Tp=120/000-135/000 for 100days
@100trillionUSD @cz_binance @elonmusk
