Bitcoin Hits $40,000, It Will Recover —Name Your AltcoinSorry, there is a typo there on the title, I meant to say: Bitcoin hits $114,000, soon to recover.
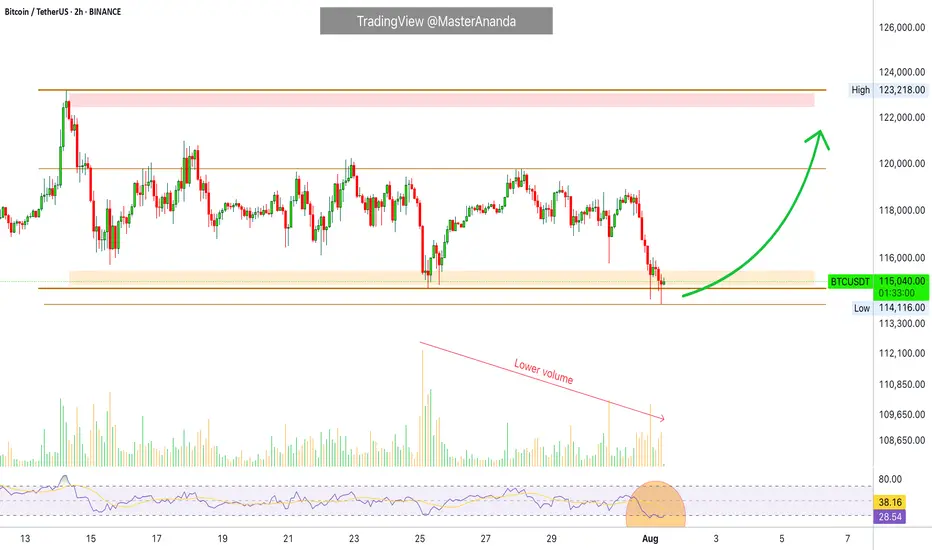
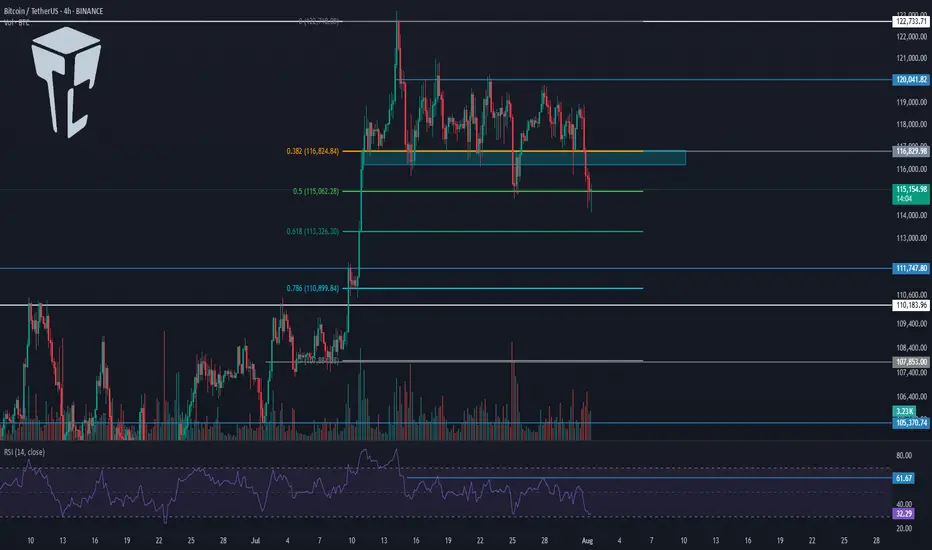
As you can see from our trading range, Bitcoin just went beyond the lower boundary and hit a new low, the lowest since 10-July but there is good news. There isn't room for prices to move much lower, this is part of the consolidation phase.
The first low happened 25-July and notice the high (bear) volume. The second low happens today and we have lower volume compared to 25-July, but Bitcoin hit a lower low. This reveals that the bearish move is already weak and losing force. It also reveals the fact that Bitcoin is about to recover.
Also notice the RSI, 2H. It hit oversold recently and went the lowest in a long while. Reversals tend to happen when the RSI becomes oversold.
Bitcoin is testing the lower boundary of the trading range, when this happens, the action reverses and moves back up. Prepare to see Bitcoin back above $120,000. It is normal and it will happen... But it is wise to give the market a few days. 5-August was bad last year. It gets bad but it also marks the bottom. Once the bottom is hit, growth long-term.
— Name Your Altcoin
Leave a comment with the altcoins you are holding now and I will do an analysis for you. The altcoins will also recover and we are witnessing just a small retrace. Hold strong as this is the most important part. We will have a very strong new bullish wave develop within days.
As Bitcoin moves to test support, it will reverse to test resistance next. Which one is your top altcoins choice?
Thank you for reading.
Namaste.
BTC-D
BITCOIN - Price can turn around and start to move upHi guys, this is my overview for BTCUSD, feel free to check it and write your feedback in comments👊
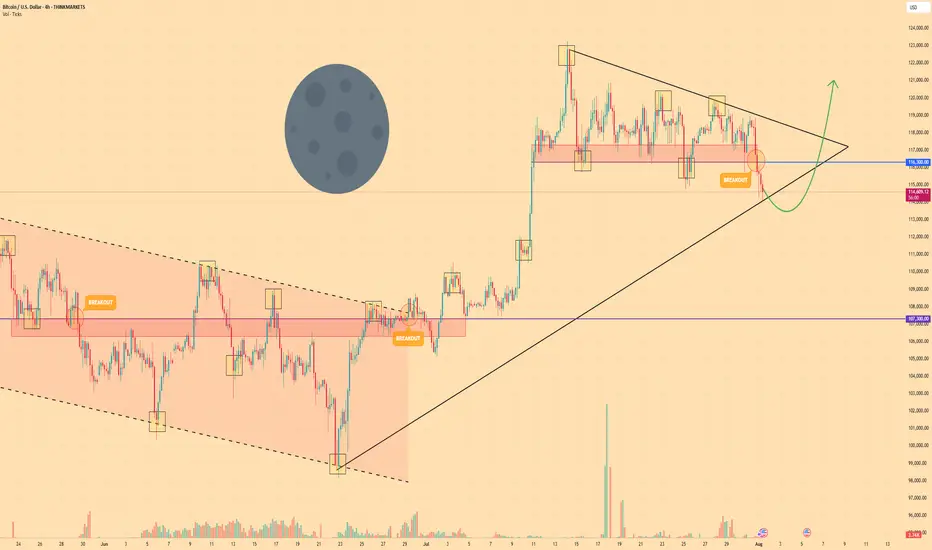
The price reversed its prior downtrend with a decisive breakout from a falling channel.
This breakout triggered a strong upward impulse, which then began to consolidate into a large symmetrical pennant.
However, the price recently failed to hold the lower support trendline of this pennant and broke to the downside.
The asset is currently trading just below this broken trendline, in what appears to be a liquidity grab.
To continue upwards, buyers must now overcome the immediate resistance located at the $116300 level.
I expect that this breakdown was a fakeout, and the price will soon reverse, break through the $116300 resistance, and continue its rally toward the $121000 target.
If this post is useful to you, you can support me with like/boost and advice in comments❤️
Disclaimer: As part of ThinkMarkets’ Influencer Program, I am sponsored to share and publish their charts in my analysis.
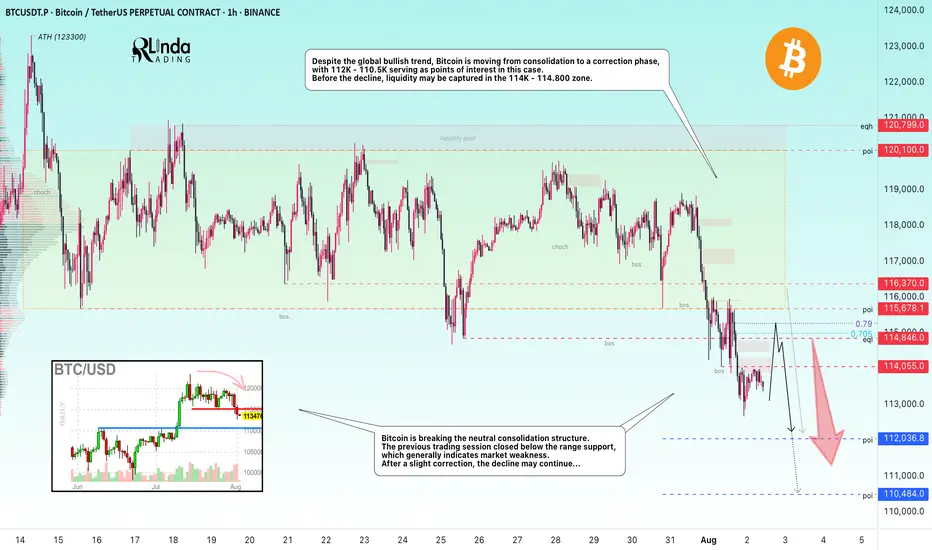
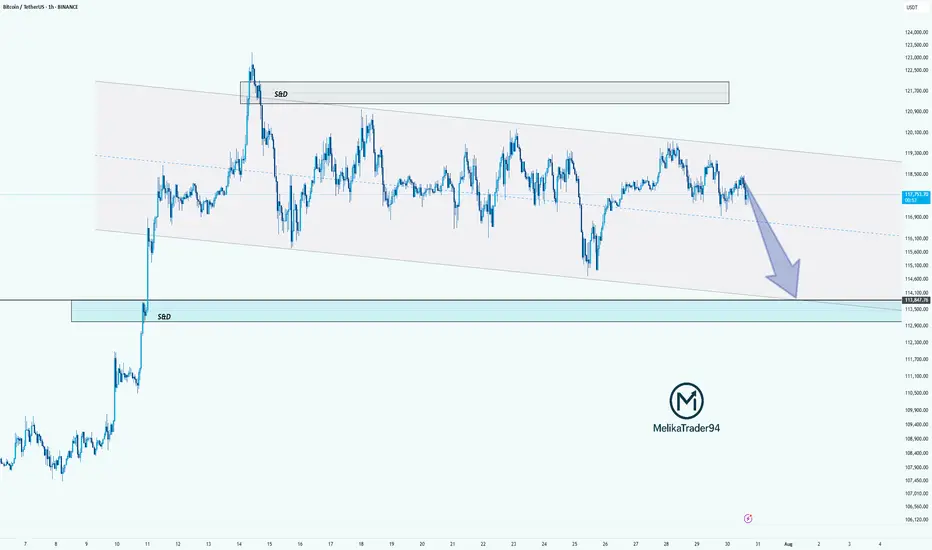
BITCOIN → From consolidation to distribution. Market weaknessBINANCE:BTCUSDT.P is moving from consolidation to a correction phase. The price broke through the support zone of 114.5–115.5, closing within the Friday trading session in the sell zone...
Previous idea from July 22: BITCOIN → Consolidation and compression to 116K. Correction?
The fundamental background is shifting to neutral, the hype has temporarily ended, and there are no bullish drivers yet. And for the health of the market, a correction is needed. Bitcoin is breaking the neutral consolidation structure. The previous trading session closed below the support range, which generally indicates market weakness. Despite the global bullish trend, Bitcoin is moving from consolidation to a correction phase, with 112K - 110.5K serving as points of interest in this case. Before the fall, liquidity may be captured in the 114K - 114.800 zone.
Resistance levels: 114.05, 114.85, 115.67
Support levels: 112.03, 110.48
After a strong movement, the market may enter a correction or local consolidation, during which it may test the specified resistance zones before continuing its downward movement to the zone of interest and liquidity at 112 - 110.5.
Best regards, R. Linda!
BTC DOMINANCE UPDATE- So, all elements are annotated throughout the graphic, like always.
- Timeline.
- Older Top Dom (2021) (red doted line).
- New Top Dom (2025) (red line).
- Some supports ( Orange Line ).
- Some Bottoms ( Green Lines ).
- Most important in chart : Fibonnacci Retracements.
- After this chart, I’ll drop links to my older BTC dominance posts.
- Not much to say, just look at the chart :
- In 2021, BTC.D formed a double top because Bitcoin spiked twice and hit two all-time highs.
- That doesn’t mean BTC.D will behave the same way in 2025. I don't expect another double top, but who knows.
- We could see a retracement down to the 45–47% range. That would likely signal the start of a new bear market.
- For now, i don’t see the end of the bull run yet. I’m mostly waiting for a strong BTC push in price, a fast dip in BTC Dominance, and the kickoff of Altseason.
— it’s going to be wild and fast! Just my personal opinion.
Stay Safe !
Happy Tr4Ding !

Bitcoin Enters Correction Mode?Bitcoin is already trading at support in the form of the previous all-time high and EMA55. Bitcoin is down more than 8% since its 14-July all-time high. We can see that a correction is already in, a retrace. This retrace we consider part of the normal workings of the market, price fluctuations which invariably always show up. The end result is a higher high, a rising wave, higher prices on the long haul.
Support is strong at current prices but even stronger is the support zone right above $100,000. As long as Bitcoin trades above $100,000, we will continue with a strong bullish outlook. If Bitcoin manages to move and close below $100,000 monthly or weekly, we will consider the short-term, the mid-term and update our map if necessary. For now, the bulls are still in control.
When Bitcoin peaked 22-May it went sideways for an entire month. From a peak of $112,000 it hit a low of $100,000. Now we have a peak around $123,000 and prices can easily swing around in this wide range.
After a few weeks, or several months, exactly as it happened last time, Bitcoin will go up. So you can expect retraces and corrections, but this is only short-term long-term we grow.
Namaste.

TradeCityPro | Bitcoin Daily Analysis #142👋 Welcome to TradeCity Pro!
Let's get into the Bitcoin analysis. Yesterday, Bitcoin continued its correction and we need to see what is going to happen in the market today.
📅 Daily Timeframe
First, let’s take a look at the higher timeframe. On the daily chart, that curved upward trendline we had was broken by yesterday's candle, and the breakout candle had high volume.
✔️ For now, I don’t consider this trendline as broken and I’m waiting to get confirmation of the break.
🔍 Currently, the price is in a correction phase, and this correction is quite natural since the price had very low volatility for a long time and was stuck below the 120000 zone.
💥 But no trend reversal has occurred yet. In my opinion, as long as the price is above the 110000 zone, the trend is bullish, and I will consider the trend reversal confirmed only if a lower high and a lower low below 110000 are formed.
⏳ 4-Hour Timeframe
Yesterday, the corrective movement of the price continued, and after a pause at the 0.5 Fibonacci level, another bearish leg formed down to the 0.618 zone.
🔔 The RSI oscillator also entered the oversold area and then exited it again. I believe there’s a high possibility that until the end of the week, Bitcoin will range in these areas and the probability of a bullish or bearish move is much lower.
🔽 However, if the 0.618 Fibonacci level breaks, the price can move to lower areas like the 111000 zone. I think the likelihood of this happening in the future is high because that zone is a strong PRZ, and at the same time, it counts as a pullback to the 110000 zone.
📈 In the bullish scenario, if the price is supported from this area and starts to move upward, since we currently have no highs below the 116000 zone, we need to wait until the first bullish leg is formed and then enter on the second leg after the new high is broken.
⚡️ For now, I’m not opening any short or long positions. I prefer the price to form more structure so I can make a more comfortable decision.
❌ Disclaimer ❌
Trading futures is highly risky and dangerous. If you're not an expert, these triggers may not be suitable for you. You should first learn risk and capital management. You can also use the educational content from this channel.
Finally, these triggers reflect my personal opinions on price action, and the market may move completely against this analysis. So, do your own research before opening any position.

Simple Psychology Tips Using Volume for Better TradingMany newer traders assume that when someone says "psychology" in trading, they are referring to mindset.
It is also widely believed that trading is about the BEST entries.
Now, think of it this way. It is not about winning trades, it is actually about managing losses well to allow you to take the winners over and over again. You might think that a 3 to 1 risk-to-reward strategy is boring, you might have gone all in on your favourite crypto project. But what makes the difference between gambling and trading is actually very, very simple. So simple, in fact, many overlook it or simply ignore it.
Most seek a silver bullet - high win rates and perfectly timed entries, then they overleverage and move stops on the one "good trade" they are seeking to make.
Whilst doing this, they tend to overload the 6 monitors they have purchased to trade with a thousand indicators, which they don't really need.
The candlesticks tell a story, volume supports that story. When you learn any technique from Elliott Waves to Wyckoff, they all have a dependence on volume - even if the correlation is not apparent.
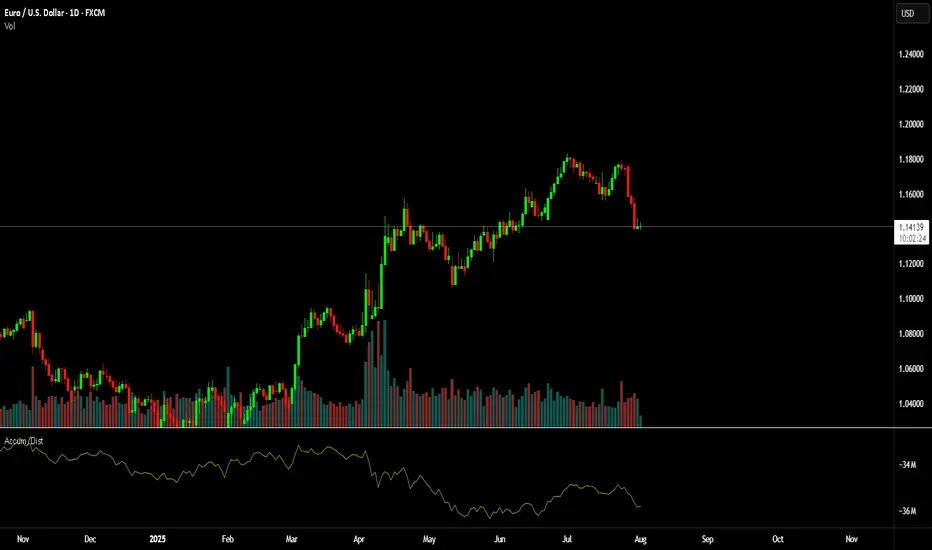
Look at this first image.
Price had moved down since the vertical line, the AD line also moved down - sell-off, in full swing. But then volume starts to shift before the AD line starts to increase.
Now, look at what happens next...
As we move forward and the new vertical line shows where volume spiked, the AD line starts to decrease as the price continues to rise.
This is enough of a story to start your analysis.
We then get a move with a lower high formed.
As this plays out, the sell-side volume rises, creating momentum for the short position.
Look a little closer and you will see, that the volume on the move up just before the drop was also decreasing. Making a divergence to price.
You might feel that the market is against you, or that the big players are single-handedly seeking your stops. But the truth is, the psychology in moves such as this one shown is where most retail traders either have greed that markets will only go up for ever or the fear that they are missing out on a market that only goes up forever.
It is that herd mentality that generates the liquidity for the professionals.
Losing 1% on a trade, is part of the process, risking 80%> on a single move will make you paper rich for about 10 minutes before the real losses set in.
This is where the psychology and the basic techniques such as risk management and understanding what candlesticks and volume bars are telling you, will make a world of difference to your results.
A/D line and volume are free on @TradingView and to be fair you don't need to overcomplicate it more than that!
Stay safe, have a great weekend all!!!
Disclaimer
This idea does not constitute as financial advice. It is for educational purposes only, our principal trader has over 25 years' experience in stocks, ETF's, and Forex. Hence each trade setup might have different hold times, entry or exit conditions, and will vary from the post/idea shared here. You can use the information from this post to make your own trading plan for the instrument discussed. Trading carries a risk; a high percentage of retail traders lose money. Please keep this in mind when entering any trade. Stay safe.
BTC/USDT | Bitcoin Eyes Rebound from $110K Support Zone! (READ)By analyzing the Bitcoin chart on the 4-hour timeframe, we can see that after reaching a new high at $123,218, the price began to pull back and has now corrected down to around $112,500. I expect the current volatility to ease soon. The next critical support zone lies between $110,500–$112,000 — watch price action closely here, as BTC could bounce from this area and push back toward $116,000+. Other key demand zones are located at $109,000, $107,900, and the $105,000–$106,000 range.
Please support me with your likes and comments to motivate me to share more analysis with you and share your opinion about the possible trend of this chart with me !
Best Regards , Arman Shaban

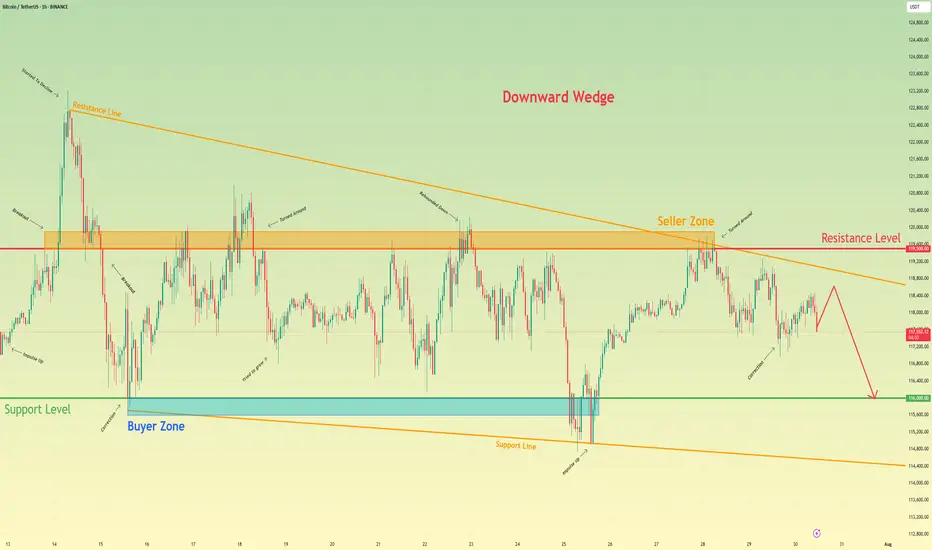
Bitcoin will continue to decline to support levelHello traders, I want share with you my opinion about Bitcoin. Following a period of a broad downward trend, bitcoin's price action has been channeled into a large downward wedge, a pattern that signifies converging volatility and a period of consolidation before an eventual decisive move. This market action is taking place between two critical, well-established zones: a major seller zone capping rallies around the 119500 resistance level and a significant buyer zone providing support near 116000. Recently, an upward rebound attempted to test the upper boundary of this wedge but was met with strong selling pressure from the seller zone, confirming its validity as a formidable barrier. The price is now correcting downwards after this rejection. The primary working hypothesis is a short scenario, anticipating that the bearish momentum from this recent failure will continue to drive the price lower. While a minor bounce or retest of local resistance is possible, the path of least resistance within the pattern's structure is now towards its lower boundary. Therefore, the TP is strategically set at the 116000 level. Please share this idea with your friends and click Boost 🚀
Disclaimer: As part of ThinkMarkets’ Influencer Program, I am sponsored to share and publish their charts in my analysis.
BITCOIN CRASH PREDICTED! HERE’S WHAT HAPPENS NEXT! (scary)Yello Paradisers, Bitcoin crashed exactly as we predicted in the previous videos that it will happen with the highest probability.
In this video I am explaining to you what's gonna happen next.
Head and shoulders, neckline, is be breaking to the downside, we need a clear confirmation of a reclaim Our channel on high timeframe is getting breakout to the downside and confirmation was that a reclaim was already successful.
In this video I'm sharing with you Elliott Way theory on low timeframe and what needs to be done for confirmation perspective in order for us to continue to go to the downside or have a reversal to the upside.
Don't be a gambler. Don't try to get rich quick. Make sure that your trading is professionally based on proper strategies and trade tactics.

#BITCOIN - Short-Term Options [EXPLAINED]As expected, the price dumped below the descending channel , currently consolidating right below one's support level.
As expected, the price dumped below the descending channel , currently consolidating right below one's support level. On the chart I've described two possible options for the price movement: strictly positive and hmm.. okey.
Strictly positive: some consolidation below the support with, then quick retrace back inside the channel and new upward rally on the next working week. Entering LONG position will make sense after the breakout of the $116,500 resistance, not earlier.
Hmm.. okey: Bitcoin is not strong enough to come back inside the channel and dumps to $111,000 support level. Near this level we must see some consolidation to gather more power. Possible fakes down to $108,000. In some time (1 week+) we will have chances of going back up.
👉 Overall, the support of $111,000 is crucial right now. If we lose it, Bitcoin goes towards $100,000 and the current bullish phase might be considered as finished. For now we still have chances.

BTC: in a new drop?!Hello guys!
btc is running in a descending channel!
However, the upper level is broken up, but it could reach the upper level after a drop here!
I am not sure about this analysis!
What do you think about it?
Bitcoin is at KEY zone - time for LONGBitcoin is at KEY zone - time for LONG
price hit key zone
if we furtunite - pric will go up to take range high

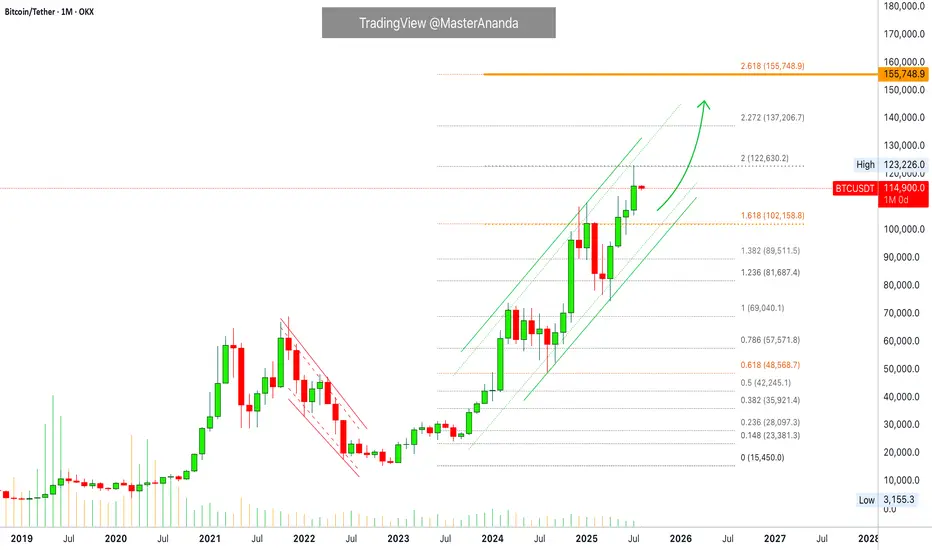
Bitcoin Monthly · Parabolic Rise ContinuesLast month Bitcoin produced its best numbers ever. The highest wick and close, a new all-time high at $123,226.
Bitcoin is not exhausted on the monthly timeframe but there is room for a retrace before the month ends. Think of the first part of the month being mixed, neutral or even bearish while the second half becomes full time bullish.
The levels that are relevant are $122,000 on the bullish side and $102,000 on the low. Right now the action is happening close to the middle so anything goes.
In 2020 Bitcoin produced 7 monthly candles growing and this was repeated again in 2023. In 2025 we have so far four green candles which means that Bitcoin can easily continue to grow. It has been known to produce more than four months green many times but there can be exhaustion at some point.
Bitcoin has been moving within a strong uptrend and is likely to continue rising. Bullish until the chart says otherwise. We are going up. Short-, mid- and long-term.
As Bitcoin consolidates near resistance, the altcoins will continue to build strength in order to grow. Remember, we are still looking at bottom prices across thousands of altcoins. Only a few moved ahead and are trading at all-time highs, the rest will catch up. The time is now, late 2025. The best is yet to come.
Namaste.
$BTC DO NOT BE REKT!bitcoin can create an accumulation process in the mini timeframe after the major rally, which will serve as fuel before another parabolic run
TradeCityPro | Bitcoin Daily Analysis #141👋 Welcome to TradeCity Pro!
Let’s dive into Bitcoin analysis. Yesterday, the exact bearish scenario I told you about happened. Let’s see what opportunities the market is offering us today.
⏳ 4-Hour Timeframe
Yesterday, I mentioned that the price had tested the 116829 zone too many times and that this area had become very weak. I also said that if the price made a lower high than 120041, deeper corrections would be likely.
✔️ Another perspective I have on the market is that sometimes certain support and resistance levels simply aren’t strong enough to continue the trend.
🔑 For example, in this case — despite Bitcoin being in an uptrend across all cycles — the 116829 support couldn’t hold, and the price broke it to reach a stronger support zone, one that might be capable of continuing the trend.
📊 Right now, this is what might be happening again. Support levels like 0.5, 0.618, and 0.786 Fibonacci retracement zones could be where the next bullish leg begins.
✅ At the moment, price has reached the 0.5 Fibonacci level, and the previous strong bearish momentum has slightly weakened. If you look at the volume, momentum is still in favor of sellers, but based on the long lower wicks on the candles, we can say the bearish trend is showing signs of weakness.
💥 On the other hand, RSI is approaching 30, and in an uptrend, when RSI nears the Oversold zone, it can often be a good entry point for a long. However, we’re not acting on this yet — we’ll wait for more confirmations before opening any positions.
⭐ For now, there’s no trigger for a long position on this timeframe. A break below 115000 could act as a short trigger, but given the trend Bitcoin is in, I’m not opening any short positions at the moment.
⏳ 1-Hour Timeframe
The price has dropped down to 114560, and I believe today we might enter a corrective phase. However, if the price stabilizes below 114560, the correction could continue. The next targets would be the Fibonacci levels from the 4-hour timeframe.
🔽 I won’t open a short position with the break of 114560, and I suggest you don’t take that short either.
📈 If this move turns out to be a fakeout, the first trigger we have now is at 118736, which is quite far from the current price. For this trigger to activate, we’d need to see a V-pattern form.
🔍 There are no other triggers right now. But if more range structure forms, we might consider opening a risky long on the breakout of the range top.
❌ Disclaimer ❌
Trading futures is highly risky and dangerous. If you're not an expert, these triggers may not be suitable for you. You should first learn risk and capital management. You can also use the educational content from this channel.
Finally, these triggers reflect my personal opinions on price action, and the market may move completely against this analysis. So, do your own research before opening any position.
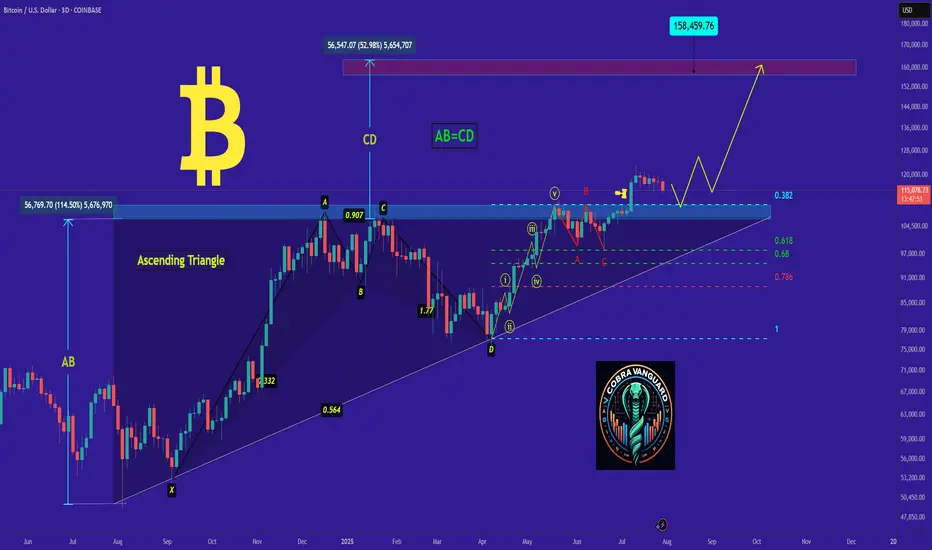
Do you think I'm joking ???As I said, Bitcoin broke the triangle, and now with a slight price correction(109k), it could surge to $150k , and you still think I'm joking!!
Previous analysis
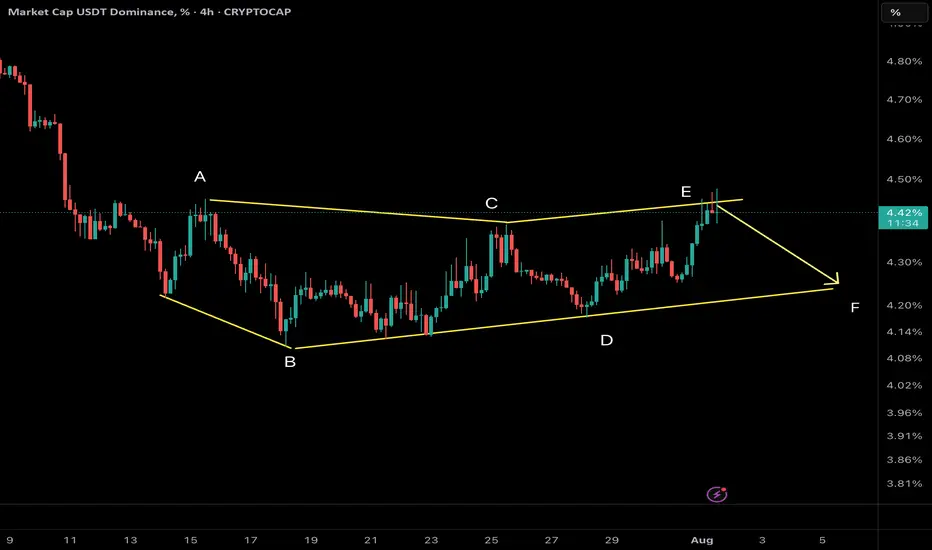
USDT Dominance – Potential Wave F Reversal?
We are tracking a NeoWave Diametric formation (7-leg corrective structure: A–B–C–D–E–F–G) on the USDT Dominance chart. Recently, price reached the projected resistance zone of wave E, and early signs of reversal are emerging.
⸻
🧠 Structural Analysis:
• The structure has developed with alternating legs in price and time, consistent with the symmetrical diametric rules.
• Wave E has likely completed, reacting from prior supply and resistance.
• A pullback from here can mark the beginning of Wave F, which in diametrics tends to retrace significantly toward the internal balance of the structure.
⸻
🔍 What to Watch:
• Confirmation of bearish intent via a break of internal supports or lower-timeframe BOS.
• Possible retracement targets: 4.2% → 3.95%, depending on momentum.
• A decisive break below 4.00% would reinforce the wave F scenario.
⸻
⚠️ Implications for the Crypto Market:
A drop in USDT Dominance typically indicates rotation into risk assets (alts/BTC/ETH). However, context matters — if the drop happens during a general market sell-off, it may reflect risk-off unwinding into fiat, not risk-on rotation.
⸻
🔄 Strategy Note:
• Avoid premature shorts or longs; wait for structure to confirm.
• Watch for smart money traps (e.g., false breakouts or liquidity grabs) around the recent highs.
⸻
📌 This is a high-risk zone for entering long USDT.D — be cautious with stablecoin bias.
📊 Analysis by CryptoPilot – Precision through structure.
Bitcoin: New All-Time High — What’s Next?Bitcoin had an incredible run, breaking the old all-time high ($111,980) with strong bullish momentum and setting a fresh ATH at $123,218 (Binance). We just witnessed the first major corrective move of ~6% and a decent bounce so far — but the big question is:
What’s next? Will Bitcoin break higher over the summer or form a trading range here?
Let’s dive into the technicals.
🧩 Higher Timeframe Structure
May–June Range:
BTC was stuck between $110K–$100K, forming an ABC corrective pattern. Using trend-based Fib extension (TBFE) from A–B–C:
✅ C wave completed at $98,922 (1.0 TBFE)
✅ Upside target hit at $122,137 (-1 TBFE)
Full Bull Market TBFE:
➡️ 1.0 → $107,301 → previously rejected
➡️ 1.272 → $123,158 → recent rejection zone
Pitchfork (log scale):
➡️ Tapped the upper resistance edge before rejecting.
Previous Bear Market Fib Extension:
➡️ 2.0 extension at $122,524 hit.
2018–2022 Cycle TBFE:
➡️ 1.618 at $122,011 tapped.
Macro Fibonacci Channel:
➡️ Connecting 2018 low ($3,782), 2021 ATH ($69K), 2022 low ($15,476) →
1.618–1.666 resistance band: $121K–$123.5K.
✅ Conclusion: Multiple fib confluences mark the $122K–$123K zone as critical resistance.
Daily Timeframe
➡️ FVG / Imbalance:
Big daily Fair Value Gap between the prior ATH and $115,222 swing low.
BTC broke the prior ATH (pATH) without retest → a pullback to this zone is likely.
Lower Timeframe / Short-Term Outlook
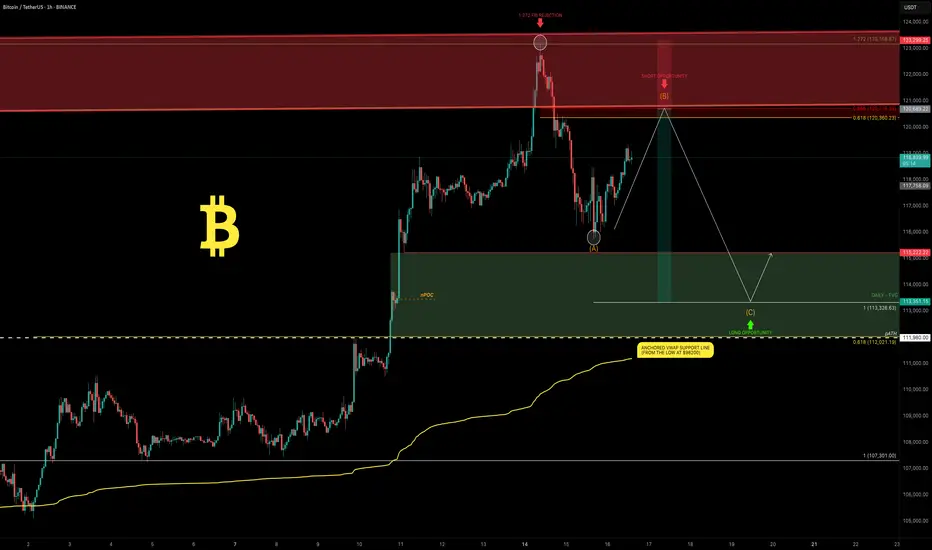
We likely saw a completed 5-wave impulse up → now correcting.
The -6% move was probably wave A, current bounce = wave B, next leg = wave C.
➡ Wave B short zone: $120K–$121K
➡ Wave C target (1.0 TBFE projection): ~$113,326
➡ Confluence at mid-FVG + nPOC
Trade Setups
🔴 Short Setup:
Entry: $120,300–$121,000
Stop: Above current ATH (~$123,300)
Target: $113,500
R:R ≈ 1:2.3
🟢 Long Setup:
Entry: Between Prior ATH and $113,000
Stop: Below anchored VWAP (~$110,500)
Target: Higher, depending on bounce confirmation.
🧠 Educational Insight: Why Fibs Matter at Market Extremes
When markets push into new all-time highs, most classic support/resistance levels disappear — there’s simply no historical price action to lean on. That’s where Fibonacci extensions, channels, and projections become powerful tools.
Here’s why:
➡ Fibonacci extensions (like the 1.272, 1.618, 2.0) help estimate where trend exhaustion or profit-taking zones may appear. They are based on the psychology of crowd behavior, as traders anchor expectations to proportional moves from previous swings.
➡ Trend-Based Fib Extensions (TBFE) project potential reversal or continuation zones using not just price levels, but also the symmetry of prior wave moves.
➡ Fibonacci channels align trend angles across multiple market cycles, giving macro context — like how the 2018 low, 2021 ATH, and 2022 low project the current 1.618–1.666 resistance zone.
In short:
When you don’t have left-hand price history, you lean on right-hand geometry.
That’s why the $122K–123K zone wasn’t just random — it’s a convergence of multiple fib levels, cycle projections, and technical structures across timeframes.
⚡ Final Thoughts
Bitcoin faces major resistance around $122K–$123K backed by multiple fib and structural levels. A retest of the prior ATH zone (~$112K–$113K) looks probable before the next big directional move. Watch lower timeframe structure for signs of completion in this corrective phase.
_________________________________
💬 If you found this helpful, drop a like and comment!
Want breakdowns of other charts? Leave your requests below.
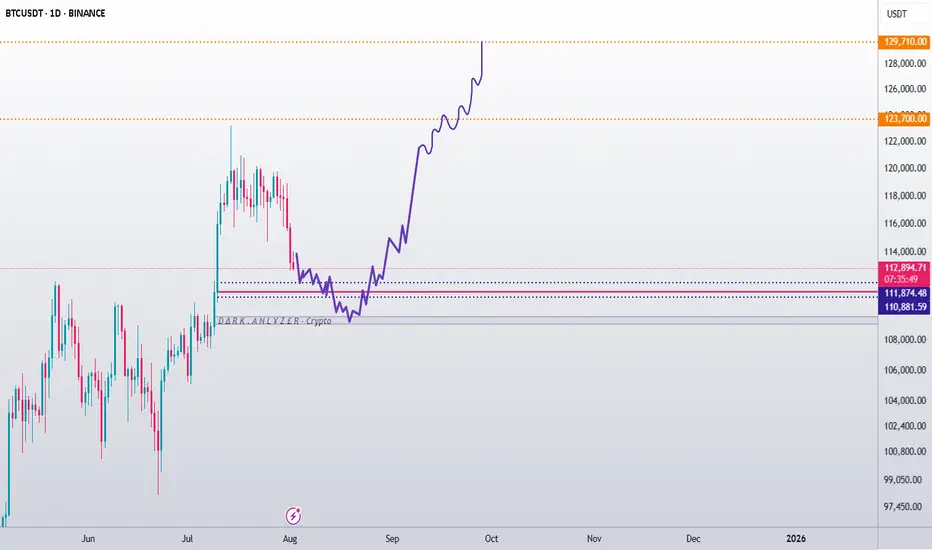
Could this be the end of Bitcoin’s trend?The Current State of Bitcoin’s Trend: Has the Uptrend Come to an End...?
Based on recent analyses, Bitcoin has exited its 4-hour channel over the past few days, and there is still a possibility for further correction. However, this does not mean that the uptrend for Bitcoin is over.
My targets for Bitcoin remain the same as before: 123,700 and 129,710. It’s even possible that we might see a wick above these prices.
For those with more capital who are looking to buy Bitcoin, there are two good entry levels:
110,880
109,770
Everything else is clearly shown on the chart. Please be cautious, as there will likely be high volatility once the market opens.
Be sure to open the analysis link and boost the analysis with your likes.
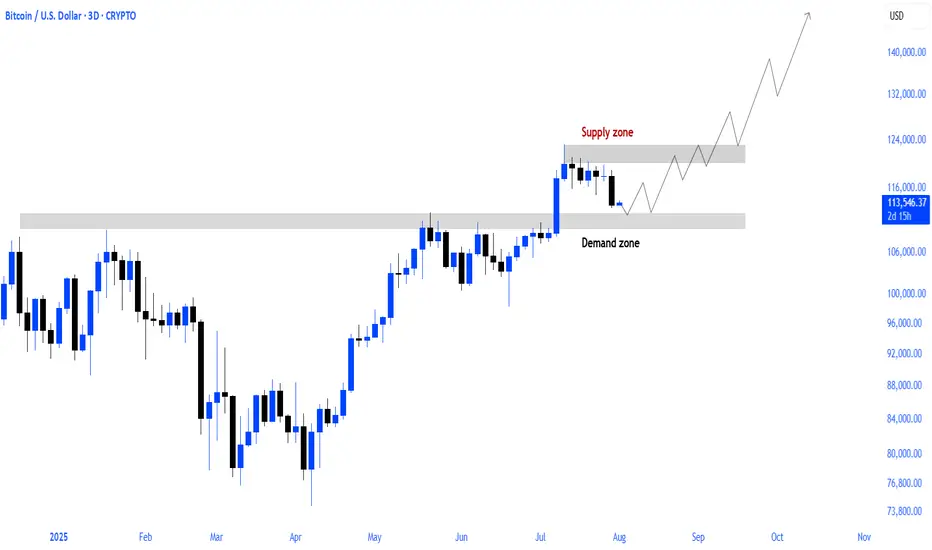
BTCUSDT 1D – Retesting Key Support, Will Bulls Hold the Line?Bitcoin is retesting a crucial structural support level around $112K after its recent local top near $120K. This zone previously acted as resistance and is now being tested as support — a textbook bullish continuation signal if it holds.
Historically, these flips (from resistance to support) have triggered strong upside momentum, as seen after the $78K breakout earlier this cycle. However, failure to hold this level could open the door for a deeper correction toward $100K or even the $90K region.
This chart outlines the major structural zones:
Long-term accumulation base near $70–78K
Resistance flip zone at $110–112K
Local resistance near $120K
📌 If bulls defend this zone and reclaim momentum, we could see another push toward cycle highs. If not, patience is key — the next high-conviction entry may come lower.
How are you positioning around this zone? Let me know in the comments 👇

Bitcoin’s Game Has Changed: Fresh Support Zone, Targets Sky-HighHey Dear Friends,
Until recently, Bitcoin had been stuck in a range between 112,331 and 105,344 for quite some time. But that range has now been clearly broken. So, what does this mean? This zone, which used to act as resistance, is now expected to flip and act as support.
According to my weekly trading model, the long-term target levels I’m tracking for Bitcoin are: 127,818 – 137,000 – 146,000.
Since this is a weekly setup, it might take a while for these targets to play out. Even if we see pullbacks to the 112K, 105K, or even 100K levels, I expect to see strong buying pressure from that zone.
I’ll keep sharing regular updates as this setup develops.
To everyone who’s been supporting and appreciating my work—thank you, truly. Your encouragement means the world to me and keeps me motivated to keep showing up. Much love to all of you—I’m grateful we’re in this journey together.

#BTC Update #14 – Aug 02, 2025#BTC Update #14 – Aug 02, 2025
Unfortunately, Bitcoin has closed below its current channel and now appears to be retesting that level. If this retest confirms, I expect a pullback down to the $110,000 zone. However, if Bitcoin manages to re-enter the channel, its first target will be $118,800. Although it’s a descending channel, moving within it suggests a relatively stable market. Closing below it may not end well and could deepen the retracement. That's why I recommend caution with all coins right now.
Even though it seems like a distant possibility at the moment, don’t forget there’s also an imbalance zone around the $103,500 level. A sharp wick or a significant drop could bring Bitcoin back to revisit that area. The probability is currently low, but it can’t be ruled out completely. I don’t recommend rushing into any long or short positions at this stage.
