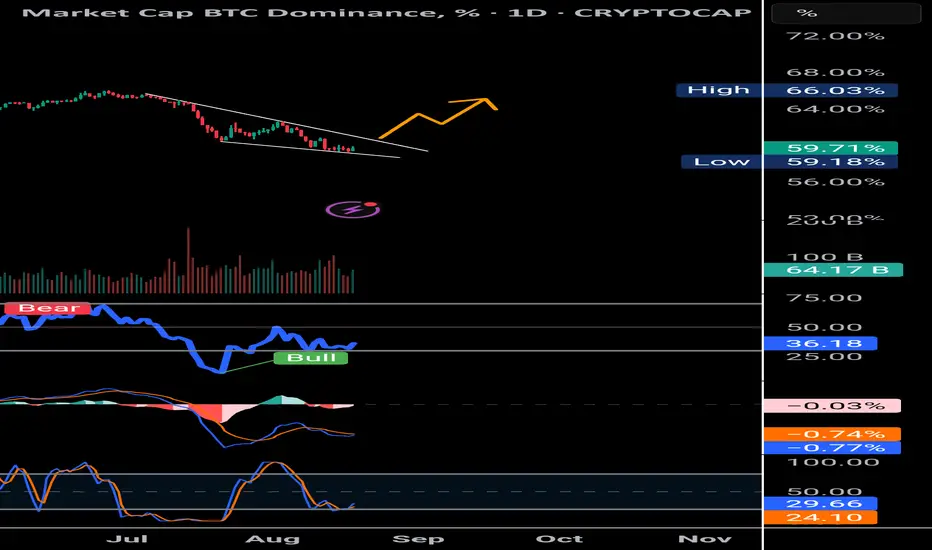
Bitcoin dominance forming a falling wedgeIf we look closely at Bitcoin dominance, it has been sliding from 66% to around 59%, forming a textbook falling wedge. Normally, this is a bullish reversal pattern—and when it plays out, history shows it hurts altcoins the most.
Right now, there’s also a clear bullish divergence on RSI: while the dominance has been falling, momentum is actually climbing. This divergence often signals that a reversal is coming, and when Bitcoin dominance rises, it doesn’t hurt BTC much, but it usually triggers heavy selling pressure in altcoins.
At the same time, USDT dominance is showing signs of heading higher. When these two align—Bitcoin dominance moving up and USDT dominance ticking higher—it sets up a tough environment for alts. Money rotates into Bitcoin, stability is prioritized, and altcoins become the exit liquidity.
In short, the setup is hinting that Bitcoin dominance is preparing to move higher, which could trigger a rotation out of altcoins and potentially cause a sharp correction in the altcoin market. Traders should be cautious—what looks calm in the charts today may flip quickly once dominance breaks out of this structure.
Btc-dominance
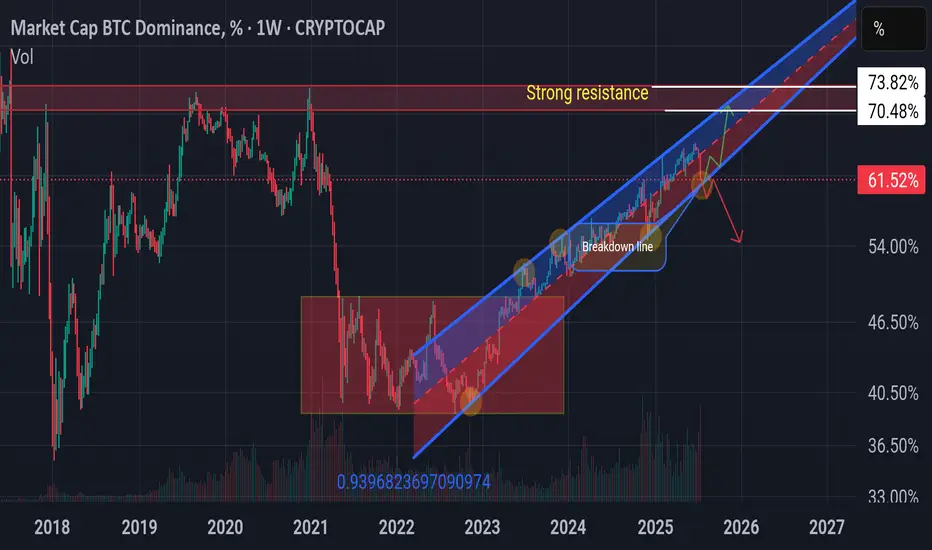
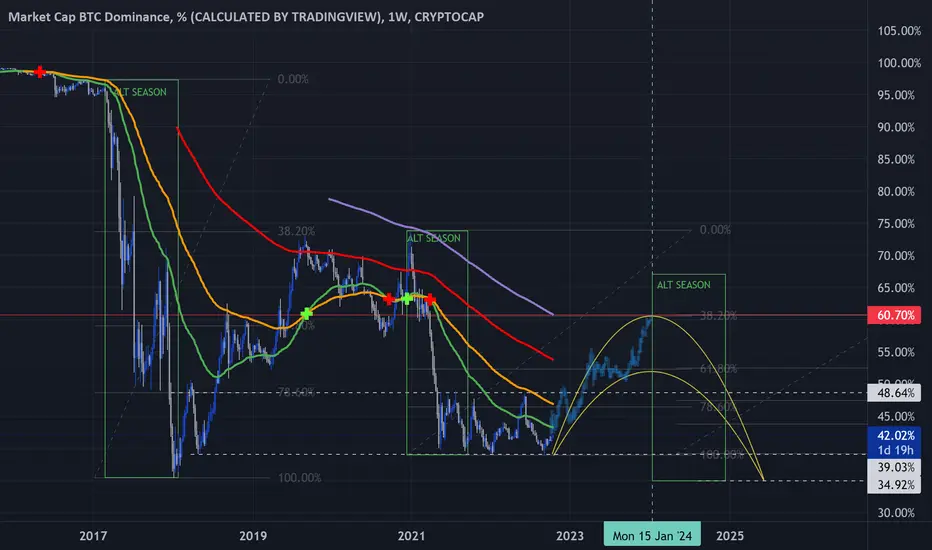
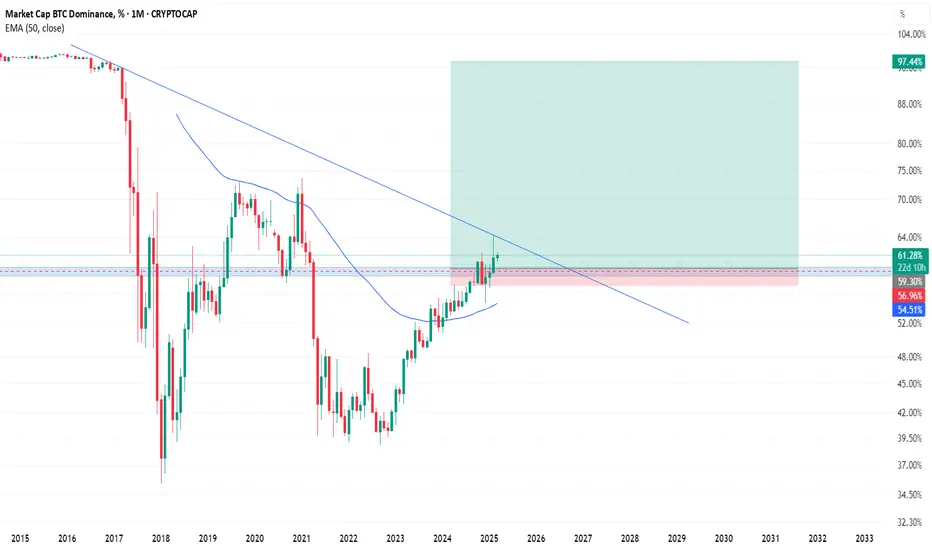
BTC.D, expected roadmap!Hi fellow traders,
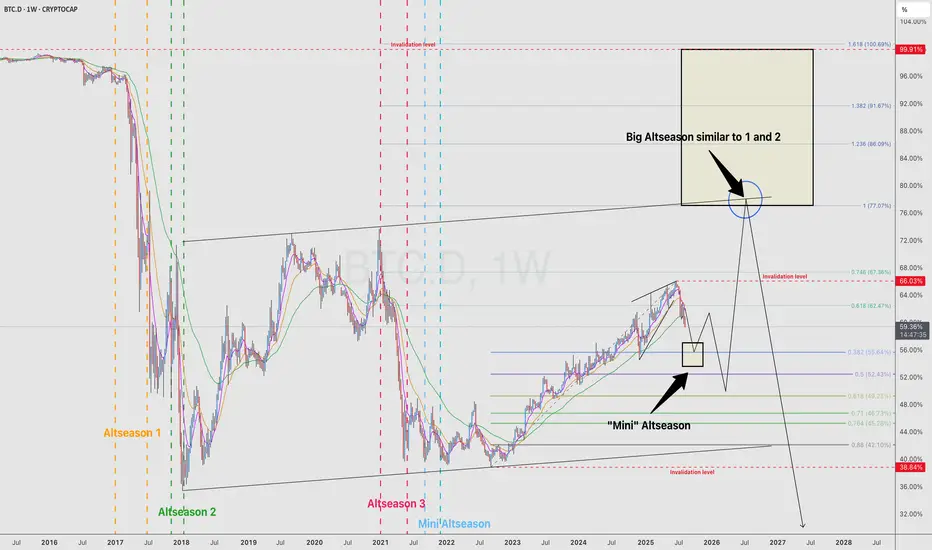
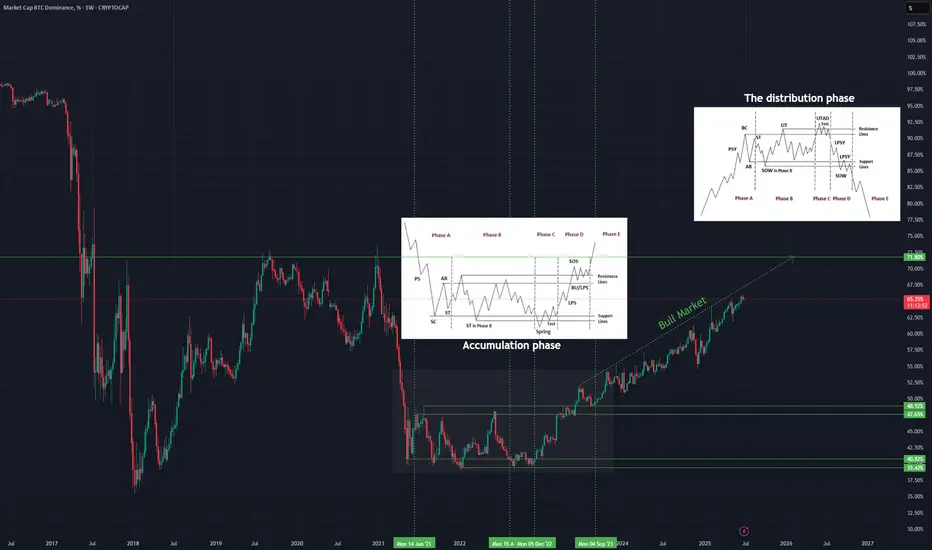
On this chart I’m analyzing the Bitcoin Dominance (BTC.D) on the weekly timeframe using Elliott Wave principles.
Looking at the structure, I expect a major corrective phase to unfold in the coming years. Historically, we have seen two big Altseasons (1 and 2), followed by smaller rallies. My projection suggests we could first experience a “Mini-Altseason” when BTC.D enters the lower golden box, before heading higher again.
This move up could then create the conditions for a much larger Altseason, similar in magnitude to the previous major ones, once BTC.D reaches the higher golden box zone.
Mini Altseason: Potential short-term relief for alts as dominance corrects lower into the first golden box.
Big Altseason: A larger, more powerful move, expected after BTC.D completes a strong retracement into the upper golden box region.
The invalidation levels are clearly marked, and as long as the structure remains intact, I expect BTC.D to respect these Fibonacci-based zones and follow this corrective path.
This analysis indicates that while we may see a temporary bounce in BTC.D the long-term outlook still favors another significant Altseason ahead.
Good luck and trade safe!
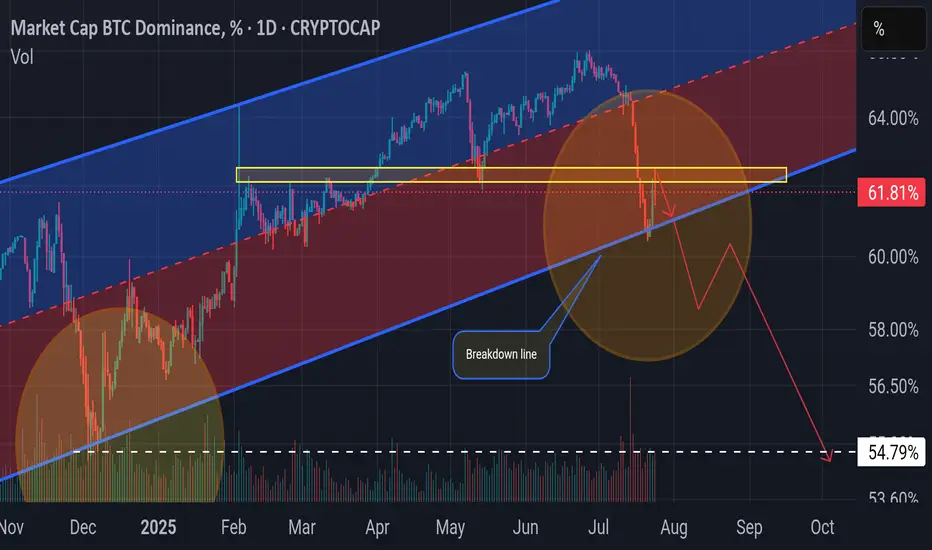
BTC.DChart Overview (1D TF – BTC Dominance):
1. Pattern in Play: Rising Wedge (Bearish Bias)
The chart shows a rising wedge pattern forming with:
Support line (PA (D)s) in blue, sloping upwards.
Resistance line (PA (D)r) in red, also sloping up, but less steep.
This pattern typically has a bearish outcome, especially when formed during a downtrend as we see post-June.
Price is nearing the apex of the wedge, meaning a breakout (likely down) could be imminent.
2. Key Horizontal Support and Resistance Levels
Support at 60.27%: Price previously bounced from this level—very significant zone.
Resistance at 61.89%: Acting as a key ceiling; price got rejected here recently.
66.03% (Top Black Line): Major macro resistance and the 2025 peak trendline intersects near that level around October.
3. Trendlines and Long-Term Context
Macro Uptrend Support in red intersects around the 61.89%–62% zone in early October. If dominance holds this zone and bounces upward from the rising wedge, this trendline becomes crucial support.
Previous Uptrend Line (purple) was broken significantly in June, which triggered the sharp drop. BTC dominance lost momentum and is now in recovery/decision zone.
Interpretation:
Short-Term Bias: Neutral to Bearish
As price is within a rising wedge post-downtrend, the probability of breakdown is higher.
Failure to break above 61.89% again and maintain momentum suggests downside towards 60.27% or even 58.60%.
Medium-Term Possibility:
If price breaks down from the wedge, support zones are:
60.27%
Then 58.60%
If price breaks up, it will need to reclaim 61.89% cleanly, then test toward 64%–66%.
Macro Trendline Intersection (~Oct 13): Could be a major decision point aligning with fundamental crypto market catalysts. Dominance could break sharply above or below that time depending on broader crypto cycles.

Dominance - Deep dive into Dominance chart!Did you know that dominance is on the verge of collapsing in the coming days? Let me tell you why.
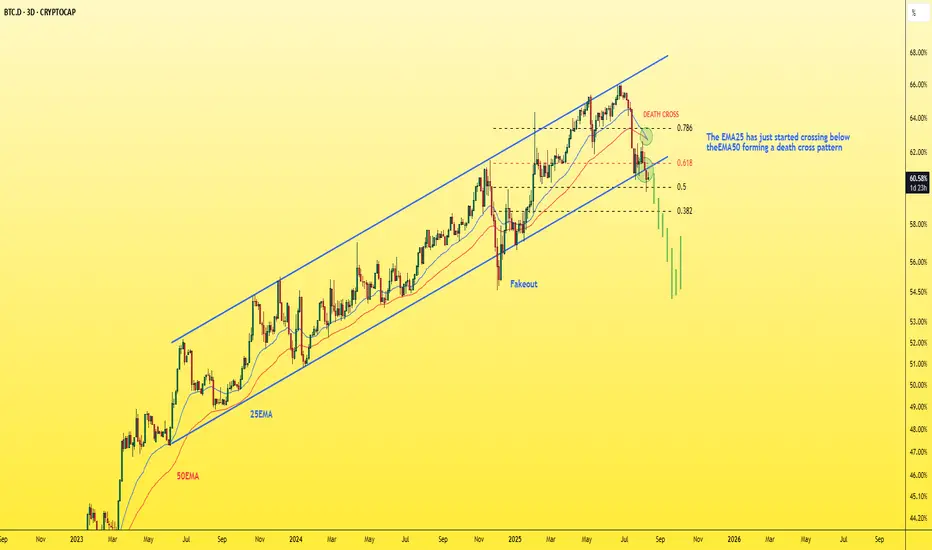
🔸On the 3-day dominance chart:
- We have the beginning of a break of the ascending channel, a close below it, and a retest.
- There’s also a break of an important support level at 0.618 Fibonacci, followed by a retest, and it’s currently trading below it.
- Plus, we have a death cross where the EMA25 crossed below the EMA50.
That’s three confirmations on one chart — can you imagine?
The coming days will likely see a strong pump in altcoins. Remember my words.
Best Regards:
Ceciliones🎯
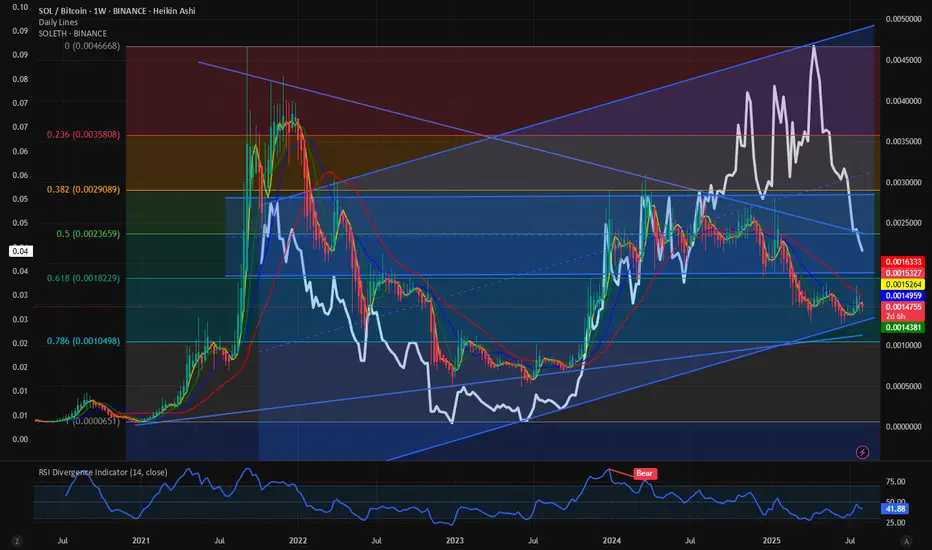
$SOLBTC Broke down. Same with $SOLETH. Will it rebound? We peaked in CRYPTOCAP:BTC.D chart as we predicted here.
CRYPTOCAP:BTC weathering the storm: CRYPTOCAP:BTC.D close to 66%. CRYPTOCAP:BTC to 160K. for BITSTAMP:BTCUSD by RabishankarBiswal — TradingView
Since then, Altcoins have shown signs of strength and CRYPTOCAP:ETH.D is bouncing back with BITSTAMP:ETHUSD at 4000 $. Please check my CRYPTOCAP:ETH.D blog here.
CRYPTOCAP:BTC.D : Cycle tops are in. CRYPTOCAP:ETH.D : Bounce form the all-time lows for CRYPTOCAP:BTC.D by RabishankarBiswal — TradingView
CRYPTOCAP:SOL being one of the large caps within the Altcoin must participate for the Altcoin summer to happen. But when we plot the BINANCE:SOLBTC and BINANCE:SOLETH then we see a broken chart with a fall from the cliff. On July 6th I wrote theta §SOLBTC looks bearish and we might find it difficult to break out of the range 0.0025 to 0.00125.
BINANCE:SOLBTC : Little strength to show for. for BINANCE:SOLBTC by RabishankarBiswal — TradingView
I put the BINANCE:SOLETH on the same chart and I was surprised how perfectly fit between the Fib retracement level. 😊 Now we would like to see where this chart goes and where does it bounce back. We see that the favorite range where BINANCE:SOLETH spends most of the time is between 0.053 to 0.04. Currently the ratio is at 0.044. My estimate is that the ratio will bounce back from the psychological level of 0.04 and then bounce atleast to 0.06 which is the mid-point of the upward slopping channel on $SOLETH.
Verdict: Altcoin summer is on. BINANCE:SOLETH is short term bearish but medium term bullish with 0.06 as target.
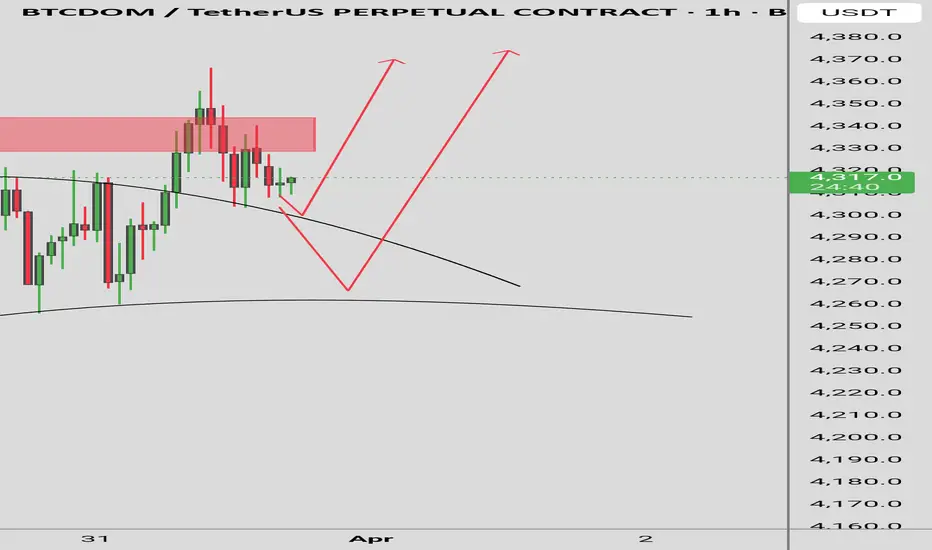
BTC.D The party begins 🚀 Altseason has kicked off. BTC.D's candle body already broke below the breakdown line briefly and is now bouncing slightly off the trendline — just a retest before another leg down. Once it breaks again, that’s when the real party starts 📈🎉.
BTC Dominance Rebound???🧭 Market Outlook
BTC Dominance (BTC.D) remains in an uptrend channel → investors still favoring CRYPTOCAP:BTC over alts.
📉 From Jun 28 to Jul 18, BTC.D dropped -7%, fueling a solid rally in ETH & alts.
⚠️ BTC.D may bounce back if it fails to break the key support (breakdown line/golden circle). Next resistance zone: 70.48%–73.82%. If this plays out → alts may lag during BTC pumps & dump harder on corrections.
🌊 Altseason only if BTC.D breaks down decisively.
But not all alts will fly. Be selective — don’t go all-in on a single coin. 🧠
Bitcoin Dominance BTC.D analysisCurrently, the maximum of BTC.D was 65.38% and the absolute maximum is very close, and then the capital will start flowing into altcoins.
We will have to keep a close eye on where the capital will go: only to highly liquid altcoins, or to a certain industry, or to a narrative, as it was before: “defi”, “memecoin”, and so on...
Do you have any ideas where the capital can go? Write in the comments!
❗️ Also, it is worth noting that such a popular term as "alt-season" lasts less and less, and you have to wait longer and longer for it!
It seems that this time the "alt-season" has every chance to last until the end of 2025, and then... it will be seen. Perhaps the market will gain capital and new powerful players who will set a new vector and new rules by 2028....
But first... we have to live to see it!)
_____________________
Did you like our analysis? Leave a comment, like, and follow to get more

Bitcoin DominationHistorical cycle data on the indicator points to the possible end of bitcoin's dominance growth. This may indicate the beginning of capital reallocation in favor of altcoins. At least until May 7 we will have a short-term altcoin season, but if we are lucky, even until the end of May.
⚠️ Caution Amid Geopolitical Factors
While a temporary altcoin season may be on the horizon, it's essential to consider broader economic factors. Ongoing trade tensions, particularly involving the U.S., could introduce volatility into the markets. Such geopolitical uncertainties might render the current altcoin rally a bull trap, with potential downturns in the summer months.
#BTC.D (BTC-DOMINANCE) - Cheat sheet#BTC-DOMINANCE
The asset has many strong features to achieve its goal.
This text does not contain recommendations on financial transactions or investments.
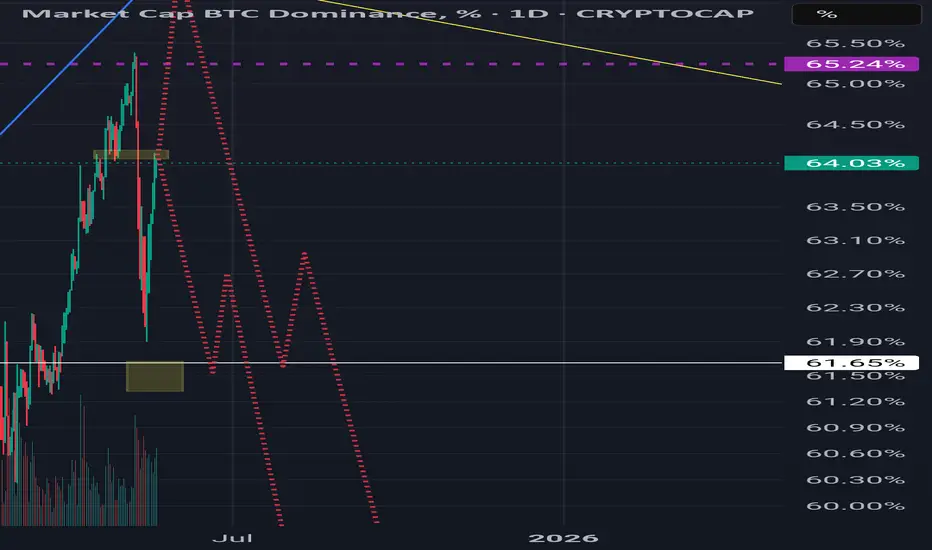
BTC Dominance New Update BTC.D
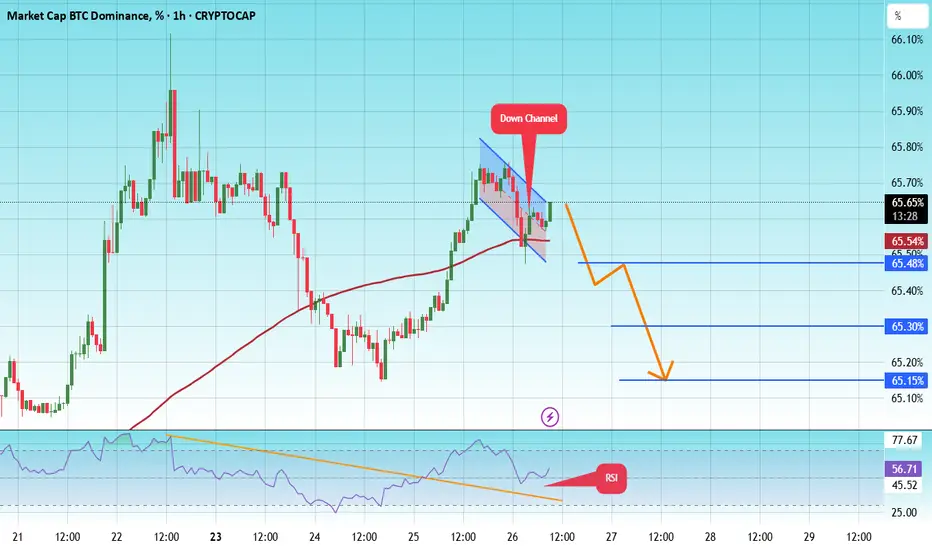
We are at a critical juncture in Bitcoin's dominance.
A major decline in Bitcoin's dominance has likely already begun. If the green zone is lost, dominance could see a sharp decline, especially since the last wave of this diagonal pattern, Wave G, touched the 0.618 Fibonacci level.
However, there is still a possibility that the green zone could push the price back close to the previous high before we see a decline in dominance. However, there are also indicators that the major decline may have already begun. Follow the chart closely and monitor it closely.
First Target: 65.50%
Second Target: 65.30%
Third Target: 65.15%
To manage risk, don't forget about stop loss and capital management.
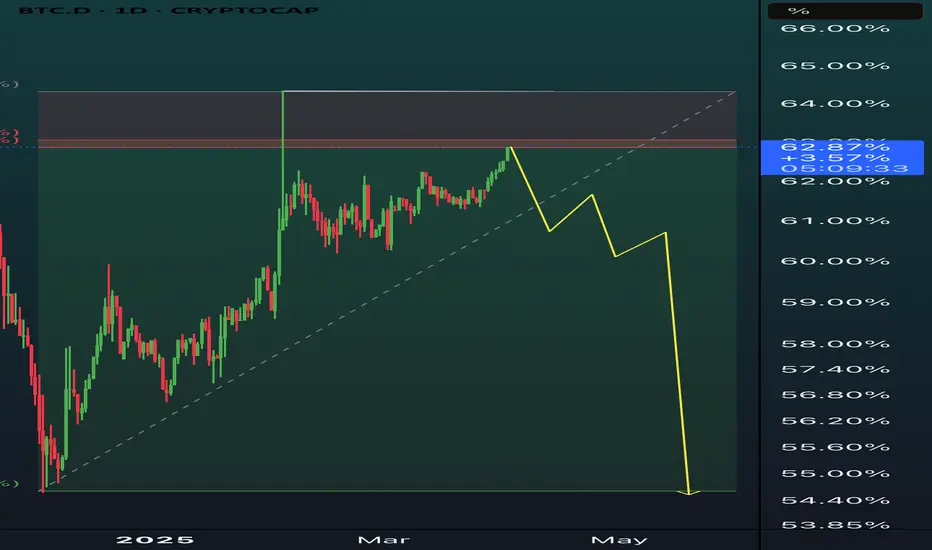
BTC.D ANALYSIS BTC.D – Daily Chart Analysis 🧠
Bitcoin dominance is forming a rising wedge pattern – a typically bearish structure.
We’re now at the upper resistance; a rejection here could trigger a strong move down, opening the path toward 56–57% levels.
If confirmed, altcoins might get temporary relief.
Watch for a break of the lower trendline for confirmation.
Not financial advice – DYOR

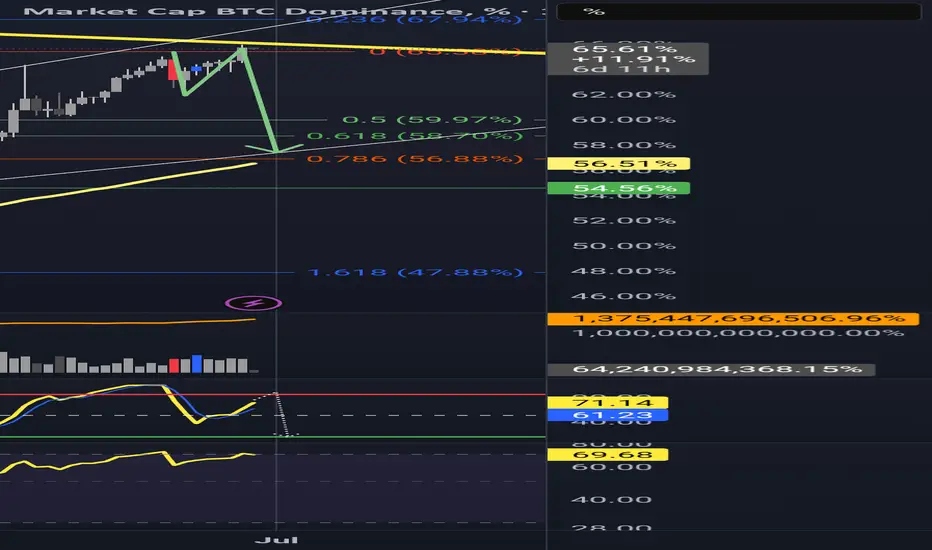
Is Altseason Around the Corner? BTC.D looks tired AF!BTC dominance just hit the top of a rising wedge that has been building for over a year. Price is stalling at 65.64 percent, sitting right against long-standing resistance.
Momentum is weakening. Stochastic RSI is at 72 and starting to roll over. RSI is sitting just under 70 and showing early signs of fading.
The structure suggests we are close to a decision. If BTC dominance starts to fall from here, the conditions for an altcoin run are in place.
Key levels to the downside are already mapped. First is 59.97 percent. Then 58.70 percent. After that, 56.88 percent. The 100-week simple moving average is also sitting at 56.51 percent. If dominance breaks below that level, it opens the door for a larger shift in market flow.
Previous retracements in BTC dominance have aligned with strong moves in altcoins. This current setup is technically clean and nearing resolution.
It is not confirmed yet, but the signals are starting to stack. This is a moment worth watching.
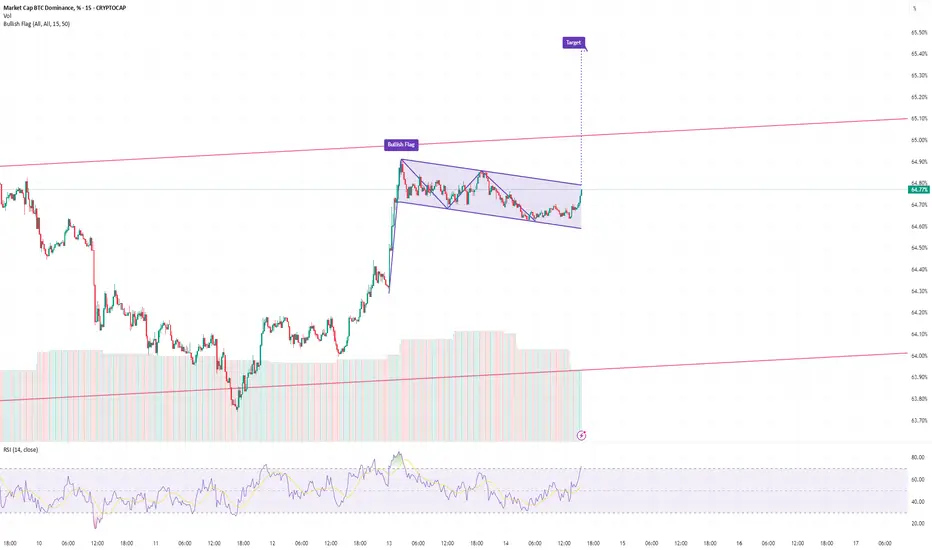
BTC Dominance Looking very bullish CRYPTOCAP:BTC.D should go up towards 66% and expect the CRYPTOCAP:OTHERS to take a hard dump. Bull flag pattern in the short term.
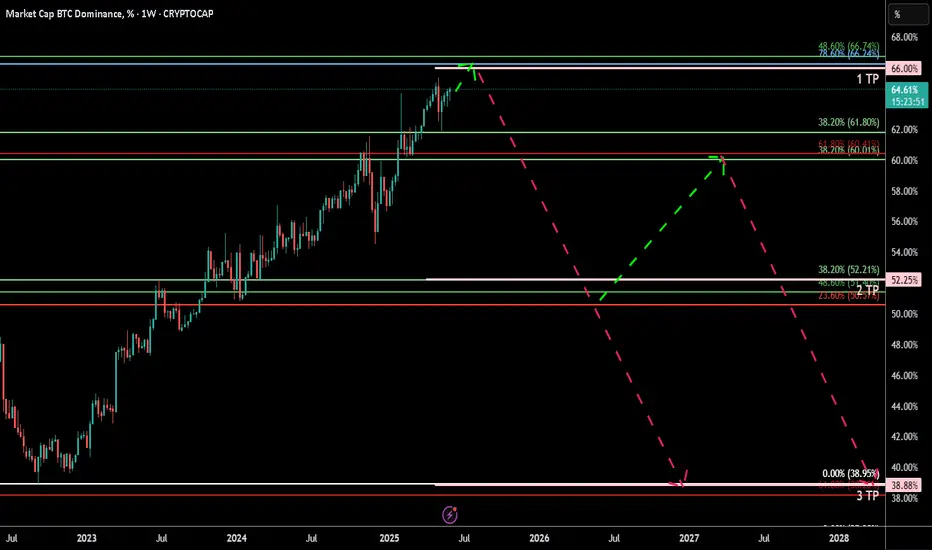
BTC.D (Dominance at Critical Fibonacci Confluence) 2025 Weekly
**Summary:**
Bitcoin Dominance (BTC.D) is testing a major Fibonacci confluence near the 66% level. This zone historically acts as a major pivot and may signal either a continued dominance rally or a potential reversal setting the stage for altseason. We use three layered Fibonacci retracements to outline dominant trend zones, key resistances, and projected targets.
**Chart Context:**
This chart uses **three distinct Fibonacci retracements** to map the historical and projected behavior of BTC dominance:
1. **Primary Fib** (100% to 0%): Captures the macro move from BTC.D \~100% down to its 0% level at \~0%, which aligns with the first altseason (2018–2019).
2. **Secondary Fib** (100% to 38.88%): Maps the first bearish wave to identify potential recovery levels. BTC.D retraced up to the 61.8% (\~73.68%) but failed to break further.
3. **Third or the Current Fib** (73.68% to 38.88%): Maps the latest bearish fall in BTC.D. As of now, BTC.D is hovering at the 78.6% retracement level of this move, indicating heavy resistance.
**Key Technical Observations:**
* **1st TP (Resistance):** 66% — Strong Fibonacci confluence zone:
* Fib2 48.6% ≈ Fib3 78.6%
* Major reversal zone historically
* **2nd TP (Support):** 52.25% — Multi-Fib confluence:
* Fib1 48.6%, Fib2 61.8%, Fib3 38.2%
* **3rd TP (Ultimate Support):** 38.88% — Historical BTC.D bottom, aligned with the first altseason.
* Intermediate Fibonacci confluences between 48%–60% serve as layered support during decline phases.
**Indicators:**
* No external indicators used; pure multi-frame Fibonacci confluence.
* Price action structure and historical patterns highlight potential market rotation zones.
**Fundamental Context:**
The current phase of the market reflects increasing speculative activity in altcoins while Bitcoin consolidates. Historically, high BTC.D correlates with Bitcoin-led rallies, while a sharp drop often triggers altseason.
* Growing inflows into ETH, SOL, and possible now XRP, and mid-cap alts suggest capital rotation.
* If BTC.D faces rejection from 66%, the market could enter a new altseason phase.
* Macro tailwinds (e.g., easing monetary policy, risk-on sentiment) support altcoin performance in the medium term.
**Philosophical or Narrative View:**
BTC.D acts as a barometer of market risk preference. As confidence expands beyond Bitcoin, money flows into altcoins—like tributaries branching off the main river. The rejection from major confluences signals this psychological shift, marking phases of creative decentralization.
**Related Reference Charts:**
* TOTAL3 Fibonacci Setup (Altcoin market excluding BTC & ETH):
* TOTAL2 Correction Probabilities:
**Bias & Strategy Implication:**
* **Primary Bias:** Bearish rejection from 66% followed by correction to 52% and potentially 38.88%.
* **Alternative Scenario:** Brief breach above 66% before reversal.
* Traders may consider rotating into altcoin exposure if BTC.D confirms reversal at the confluence zone.
**Time Horizon:**
* Mid to Long Term (1–6 months outlook)
* Weekly timeframe tracking
**Notes & Disclaimers:**
* This analysis is for educational purposes. Market conditions may evolve rapidly.
* Use proper risk management when acting on dominance signals.

Dominance the system core- for me it has always been very complicate to explain BTC.D to peoples, because it's complicate ! lol
- it's weird to understand the moves and many factors have to be compared together an alchemy have to happen to see something happening.
- So basically to explain it, i will tell you what "we want to see" or "what we don't want to see" in the future. if the story repeats again.
1/ BTC.D have to grow up, then Altcoins will struggle down trying to find a potential bottom.
- While BTC.D grow up, BTC price have to grow up also or at least stabilize ( this is a good sign )
2 / if BTC price down and BTC.D up, it's bad, it's just the normal way ( No Divergence )
- When BTC price + BTC.D both up together, it's a kind of " inversed divergence ", it means something good gonna happens. ( get it ?)
- Basically also if USDT/USDC Dom Grow and BTC price stabilize and not goes down anymore, it's a good sign.
- Normality the normal way is : BTC up / USDT/USDC.D Down OR BTC Down / USDT/USDC.D up.
- Before we had no reason to check those Stables coins because they had not much DOM in markets, but now have to count with them.
- So While BTC.D is growing, altcoins will just make some weak moves.
- When BTC will reach is next Dominance's ATH ( witch have to be lower than last years because more concurrence )
- BTC.D will crash and ALT SEASON will start.
- it took me many years to understand that, but it's pure logic ( Fibonacci is working perfectly on it )
- again it's not easy to get it.
- if you have any questions feel free to add a comment.
Happy Tr4Ding !
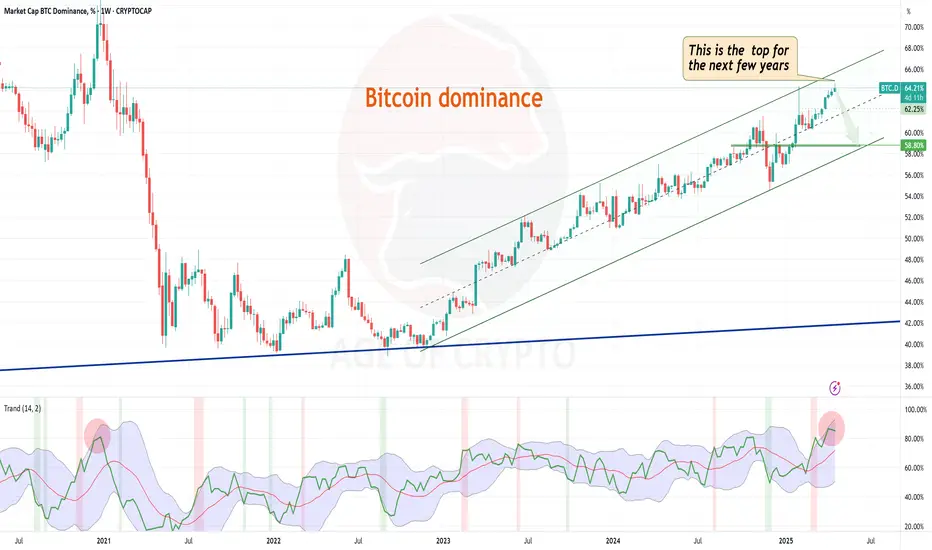
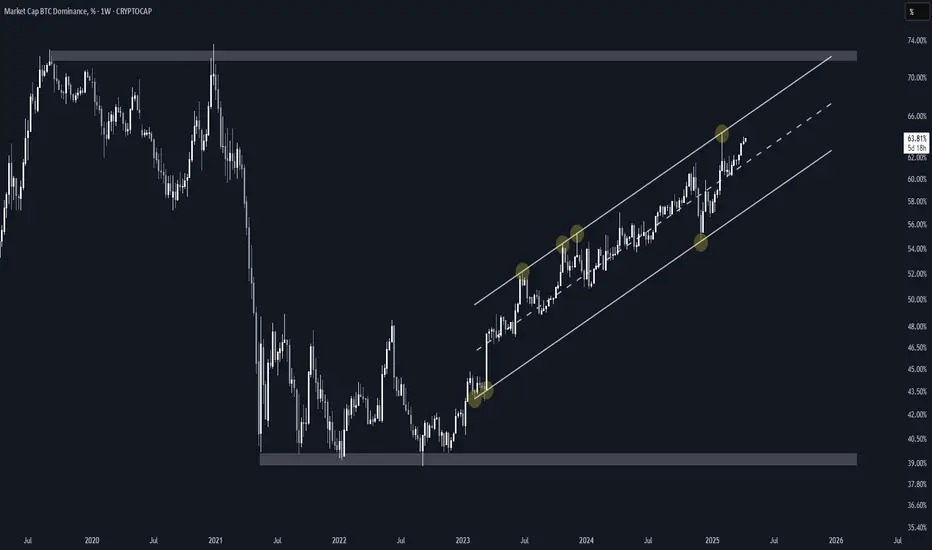
Bitcoin Dominance Ascending Channel and Altseason (1W Log)CRYPTOCAP:BTC.D has been in a clean uptrend inside an ascending channel for over 2 years.
• The midline has consistently acted as a magnet, but BTC.D has recently detached from it and might be headed for another retest of the upper boundary.
• Unless major macro catalysts intervene, I expect no notable changes until the 72-73% key area, the same zone that triggered 2021's altseason.
Regarding altseason, this cycle isn't like previous ones. With millions of tokens today, dilution is real, and a full-blown altseason where everything pumps seems unlikely.
Instead, I expect selective rotation into quality projects, and that might actually make it easier to find real outperformance.
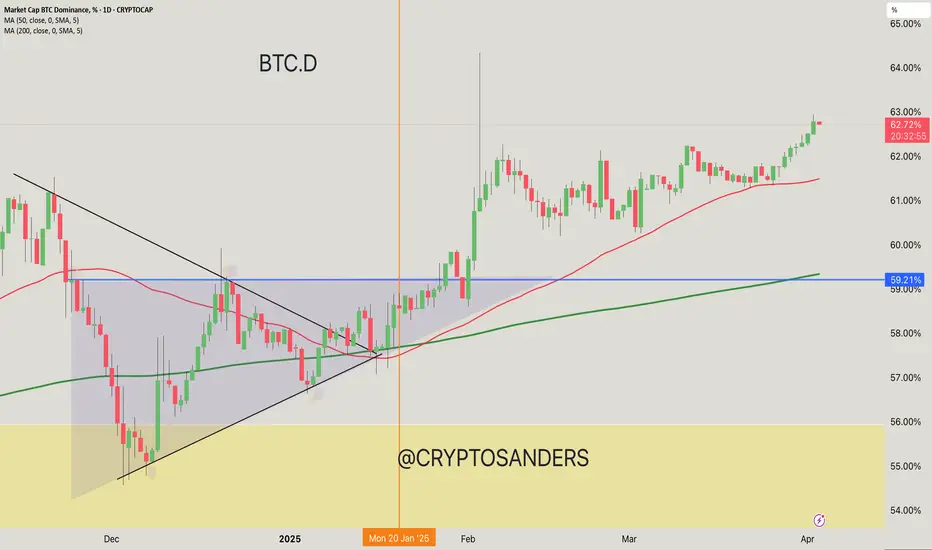
BTC Dominance Chart Analysis. 50-day MA: 61.94% (Notable Support Level)
200-day MA: 59.21% (Strong Support)
Trend: The chart shows a bullish trend in BTC dominance since the beginning of the year, with higher lows forming.
Resistance Level: A key resistance area lies around 63%, which the price is currently testing.
Support Level: The 50-day and 200-day moving averages provide solid support below current levels.
Update Points
Short-term outlook: If BTC dominance stays above 62%, it could reach 63% resistance.
Long-term indicators: Continued support at the moving averages suggests bullish sentiment if BTC can maintain its position.
Market Conditions: Monitor fluctuations in altcoin performance, which could impact BTC's dominance positively or negatively.
If you found this analysis helpful, hit the Like button and share your thoughts or questions in the comments below. Your feedback matters!
Thanks for your support!
DYOR. NFA
Altseason is coming Altseason is coming soon than your expectations. Expecting Btc.d to dump from current price areas and and alts starts gearing up.
Strong as ballistic missile Forgot green market and short position is remedy. It takes much time having bullish market.
BTC DOMINANCE
Disclaimer 👉 This is my personal analysis for educational purposes , Buy/Sell/Trade at your own risk. I am not a financial Advisor