Total 2 Analysis? more dip is coming!!!📊 Total2 marketcap
🕒 Daily Analysis
🟢 The TOTAL2 broke the important support and dumped hard from breaker block. Most altcoins see double digit loss in last 48 hours. TOTAL2 is now taking support at $780-$800 billion area. IWe might see a test of $925-$970 billion resistance now. If it goes above this resistance then we see some positive movement otherwise the dump will continue. Use proper stop in all your position because of market situation.
Btc-dominance

BTC/USDT 1D CHART UPDATE!!
Welcome community members in this post I will be going through with BTC/USDT 1D chart analysis.
If you find this post helpful hit the like button and follow.
As we can see at the above mentioned chart that BTC daily closed at $30050 and holing the support level very well.
Whenever BTC prints oversold on RSI BTC pumps from that price level almost 30%-35% on an average that can be seen from the past price action.
Here, I am expecting a bounce from current level towards $36.5k price level which is almost 23% from the current price level.
Candle close below the support level will be the invalidation of this chart analysis.
NOTE : This is not financial advice. This is for education purpose only. I am not responsible for the profits or loss you generate from your investments.
DO YOUR OWN RESEARCH BEFORE TAKING ANY TRADES.
Thank you.
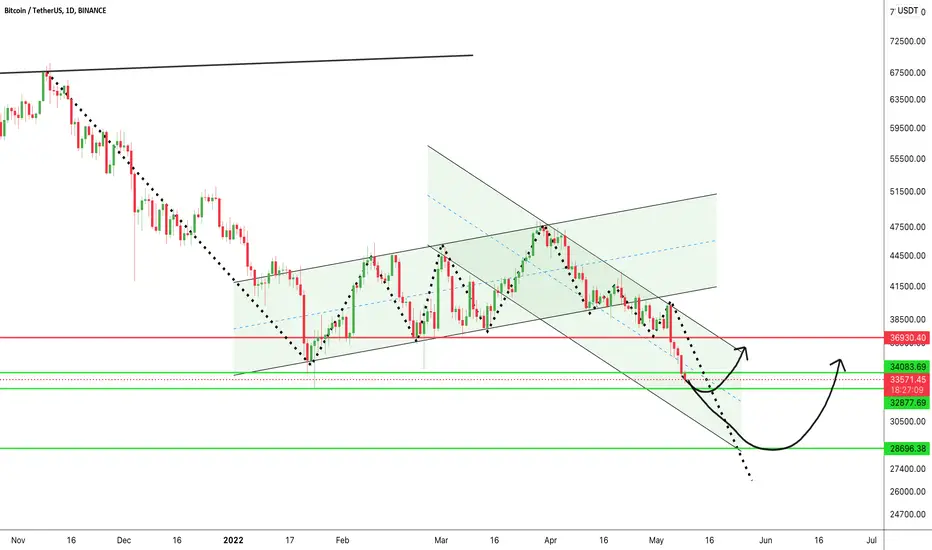
The Last Stand for Bitcoin📆🟡 BTC/USDT (BITCOIN)
📊 Time Frame: 4H
➖➖➖➖➖➖➖➖➖➖➖➖
Bitcoin is trying to hold the last local support at 3000$ and I think finally it will be break. Bitcoin needs to hold above 34000$ then we can see a movement to 39000$ (IN ORDER TO GATHERING LIQUIDITY).Lots of longs liquidated below 33000$ and many Stop Loss already hit. Now there are many sorters in the market and liquidity is around 35000$ and also CME gap is at 35000$. So I expect price to pump around 35K$ in next few days. Not even single good news affect on bitcoin price positively because of global tension in the market.

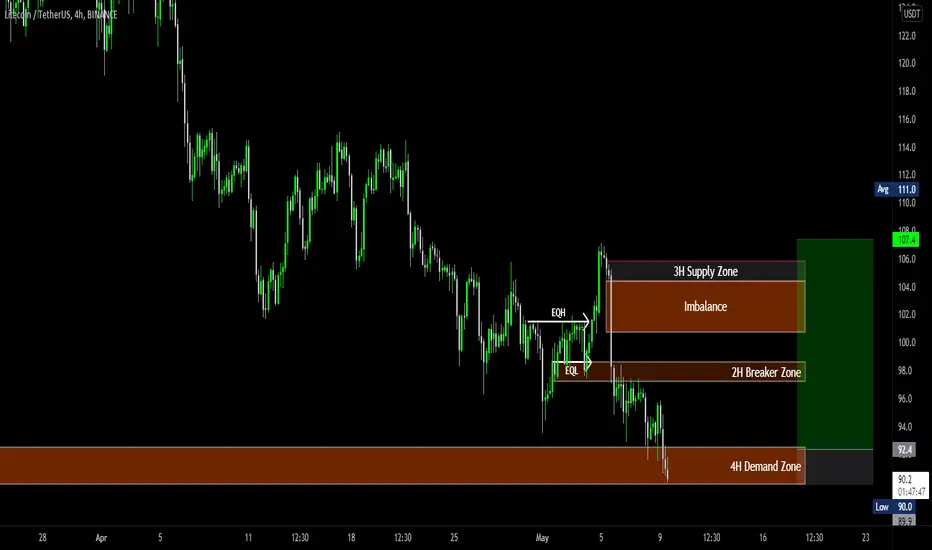
LTC 4H Buy Setup📆🟡 LTC/USDT (LITECOIN)
📊 Time Frame: 4H
➖➖➖➖➖➖➖➖➖➖➖➖➖➖
💎 Investment Opporutunity
🟢 BUY : 80$ - 88$
🟢 BUY : 90$ - 92$
🎯TP: 97$ - 107$
💹 Stop loss: 75
✍ Analysis Method : ICT+ (RSI+MACD)
📊 Analyzed By Hossein
📆05.09.2022
#BTC/USDT DAILY UPDATE BY CRYPTOSANDERS Hello, members welcome to this BTC /USDT quick chart analysis.
In the current scenario BTC moving down towards the lower support area which is $34K.
According to the current scenario if BTC holds the $33k level and $29k then we can see a bounce from that level.
Now, IMO we should sit aside from the market until any bullish divergence forms.
This is not a piece of financial advice.
Do hit the like button if you like it and share your charts in the comments section.
thank you.
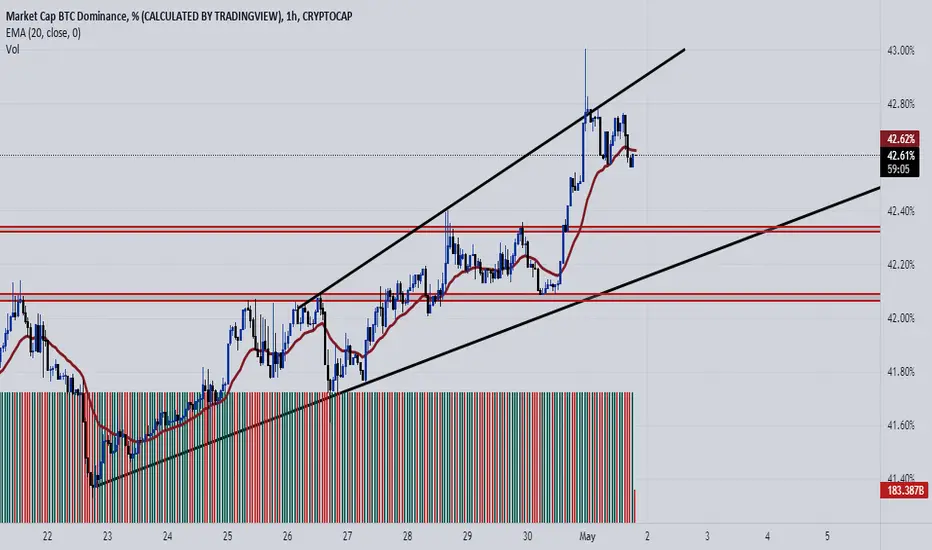
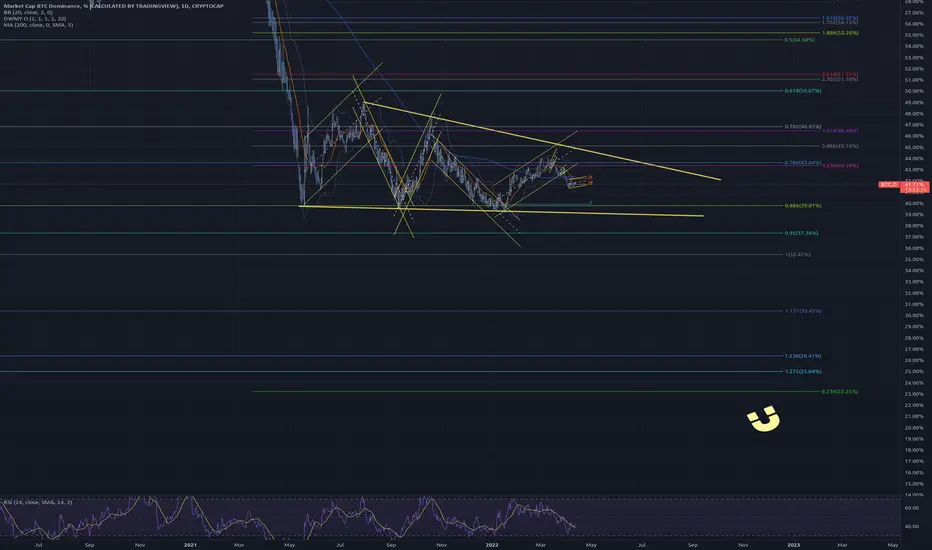
Bitcoin dominance BTC.D Analysis #TheCryptoCityAs per Dominance Chart currently, Dominance is at 41.64%
and Now BTC.D is at Resistance if it flips the 41.90% level we can expect an Upward move.
If Dominance Pump then ALT coins Dump Hard.
So be prepared with your all positions and keep an eye on the dominance chart don't Panic and if rejected from this level it is good for ALTS
in Simple you can understand:-
= If BTC Dominance moves up ALTS bleed
= If BTC Dominance moves down it is good for ALTS
This Is My Idea I Could Be Wrong

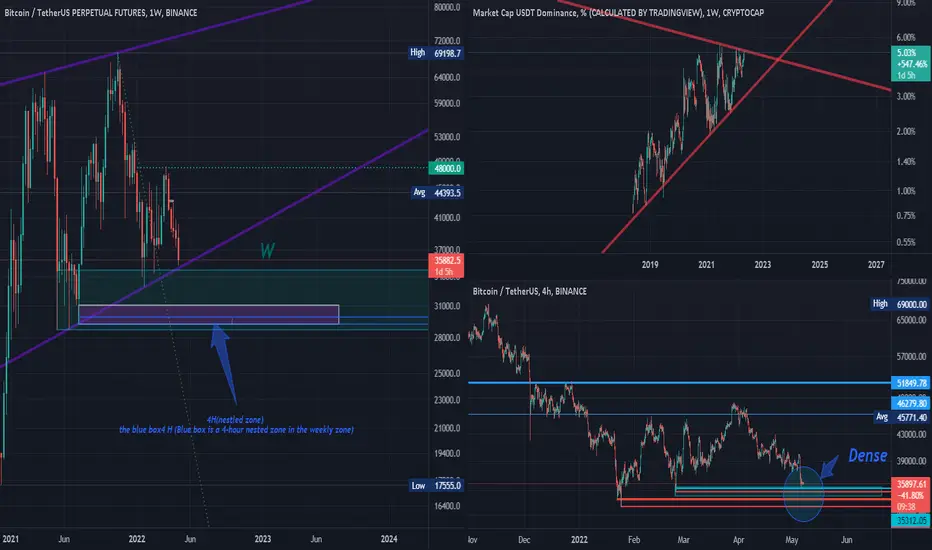
btcusdtperpHello my comrades
1. As you can see in the bigger picture (weekly time frame)
The price is currently at the end of the wedge (purple line), which in itself is a good support because it overlaps several zone of demand.
2. Below is the last support that is in the range of 29920 to 28870. If it is lost, I have to give a new analysis.
3. Most importantly, the dollar dominance chart is approaching its resistance level, and this will cause a positive market reaction.
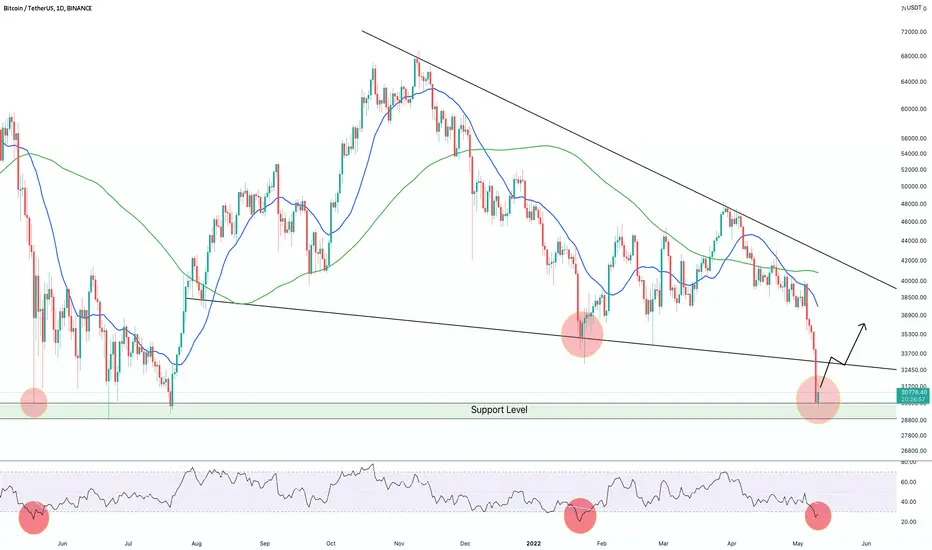
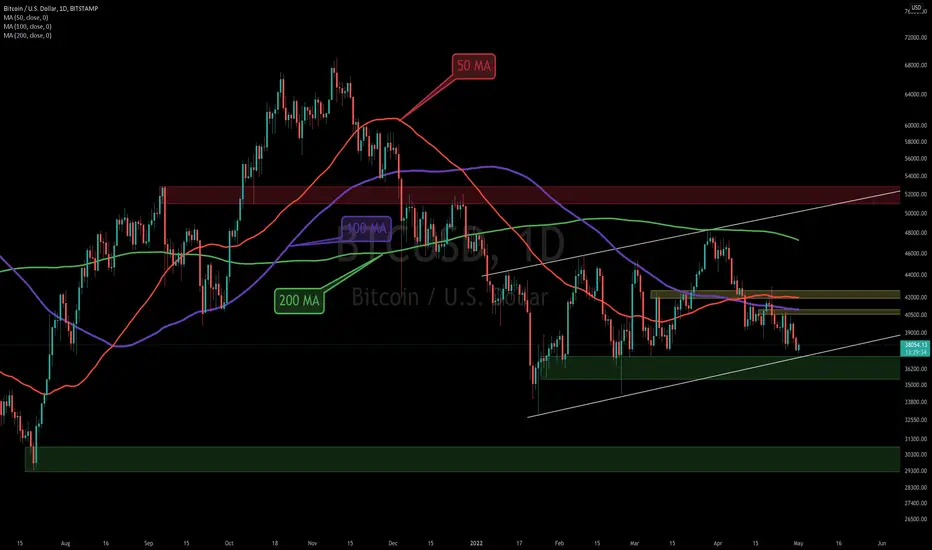
#BTC/USD DAILY UPDATE !Hello, welcome to this BTC/USD daily chart update by CRYPTOSANDERS.
I have tried my best to bring the best possible outcome to this chart.
Show some support do hit the like button, follow and comment in the comment section. this motivates me to bring this kind of chart analysis on regular basis.
CHART ANALYSIS :
The Daily Chart
The recent trajectory of lower highs and lows has been forming on the chart, indicating a continuation of the bearish trend. As it seems now, BTC’s price targets the $36K support area in the short term, which has held the price on multiple occasions over the past year. However, a break below it could result in a rapid drop towards the $30K demand zone.
This is not a piece of financial advice.
Sorry for my English it is not my native language.
Do hit the like button if you like it and share your charts in the comments section.
thank you.
Btc dom bullishExpecting btc to crab / chop down while btc/alts bleed. Should give btc.dom a nice leg up
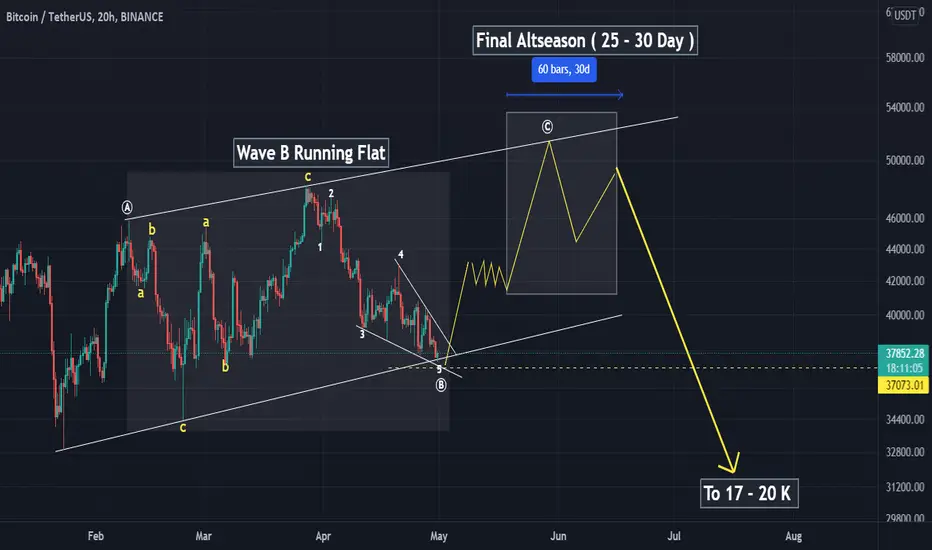
Bitcoin To ( 49 - 55 K ) Soon Wave C Bitcoin To ( 49 - 55K ) and then to 20 K
Wave A Success
Wave B ( Running Flat ) Success
Wave C Soon To ( 49 - 55K)
Altseason After ( 10 - 20 day )
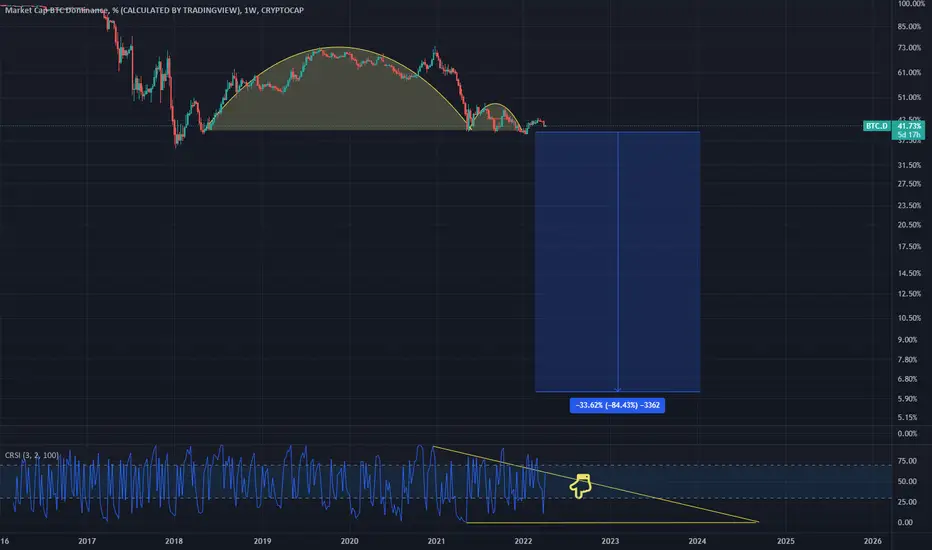
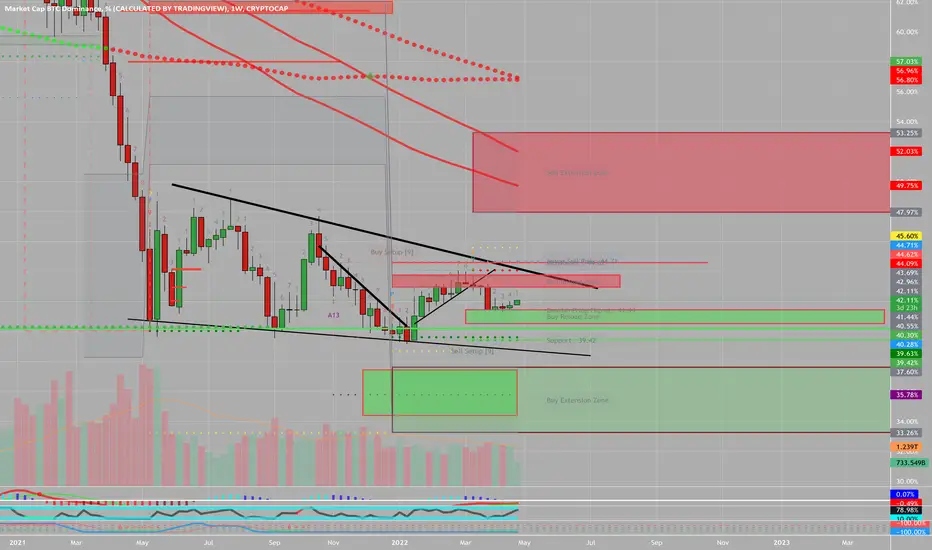
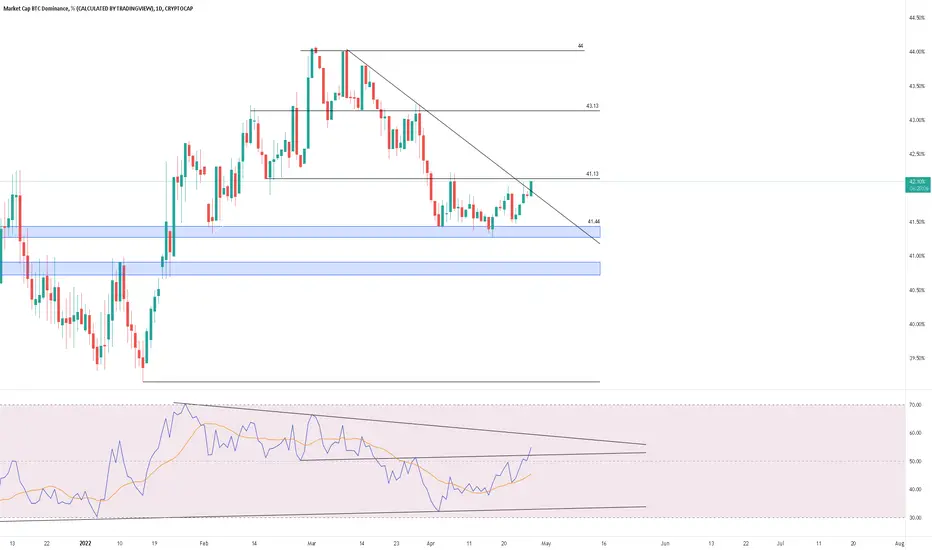
BTC Dominance - What to watch for bear/bull marketWe see a green weekly 1. If the following week closes higher, we should watch for the possibility of this falling wedge breakout.
Be mindful of the resistance line. Breaking out, getting rejected, and trading inside the pattern would indicate a pattern failure.
Breaking out of this falling wedge and closing above the resistance line will indicate a very bearish action for crypto and alts.
If this happens, look to my previous publication for the ideal time to add to your HODL position.
Happy trading!
BTC.DIf the chart goes out of the black box, the situation will be worse for the Altcoins, and given the pattern it has formed, it is likely that this will happen.
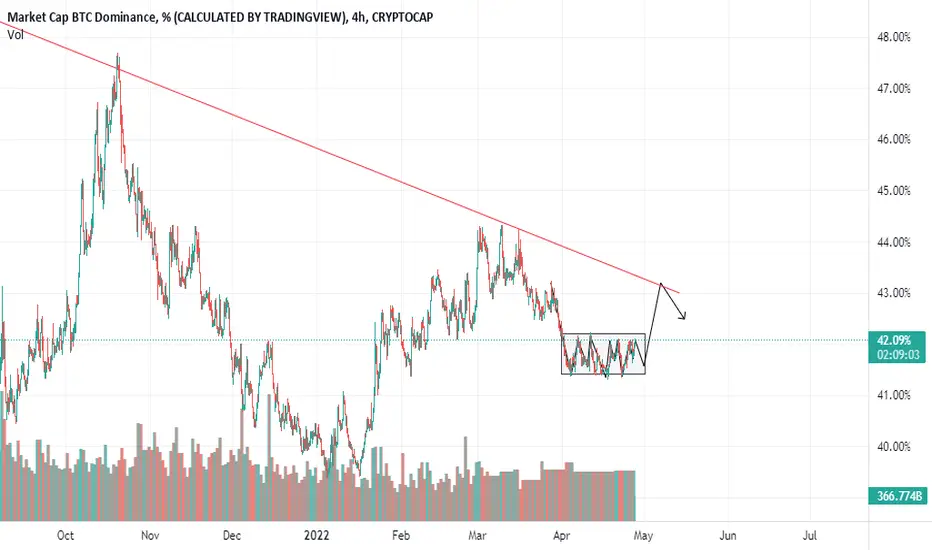
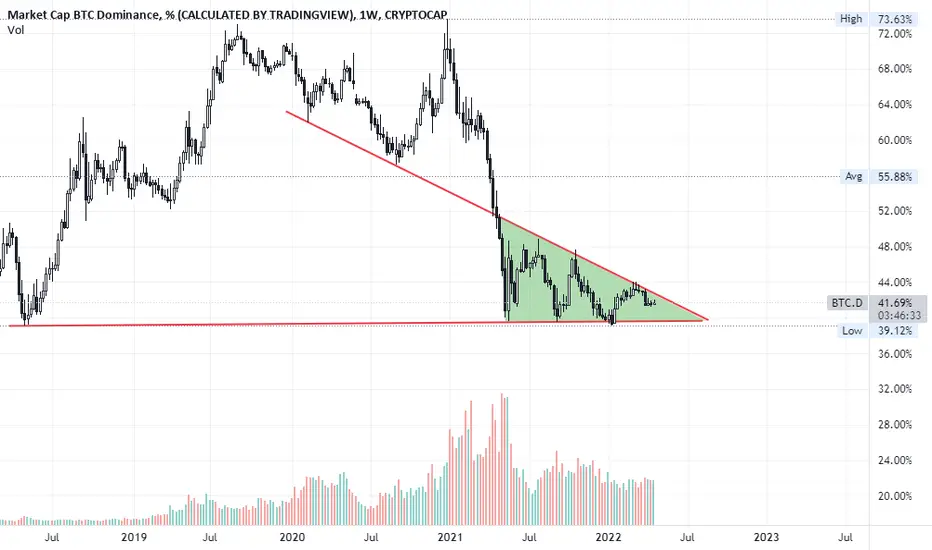
Bitcoin Dominance Breakout$BTC Dominance is seeing break of the downtrend trendline, but has yet to make a HH to signify the break. RSI is breaking resistance, although it had not had many touches.
Typically a bearish scenario overall, but not always.
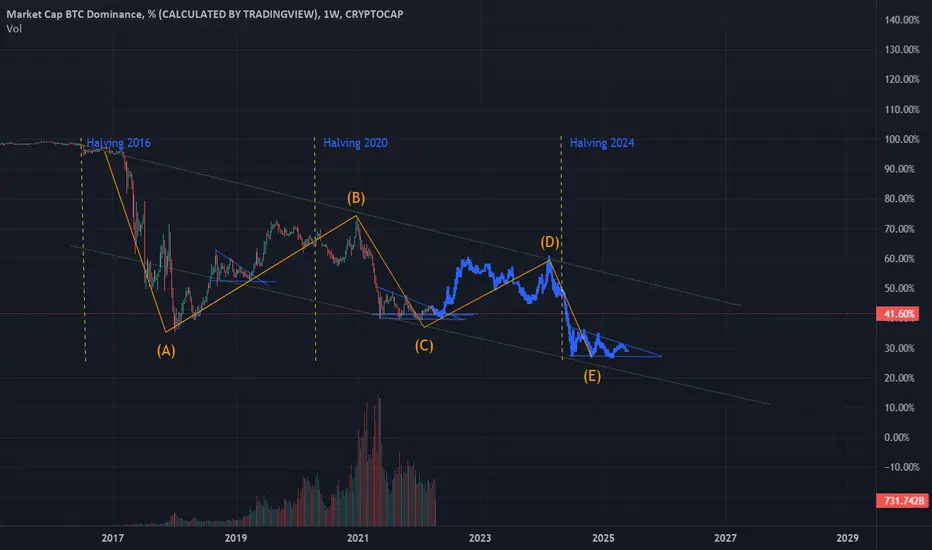
BTC.D: nothing has changed!!This is an inverted chart!
Im still expecting BTC.D to make new highs to around 50% before Altseason starts.
Everytime BTC begin a new rally to ATH it makes at first a drawdown from altcoins and then release some of its dominance to push altseason.
This is the case, especially considering the fact that ETH will likely not rally when BTC is moving massively.
Still expecting this for long time now. We'll see soon if we get it!
Hope this can be useful for the trading view community!

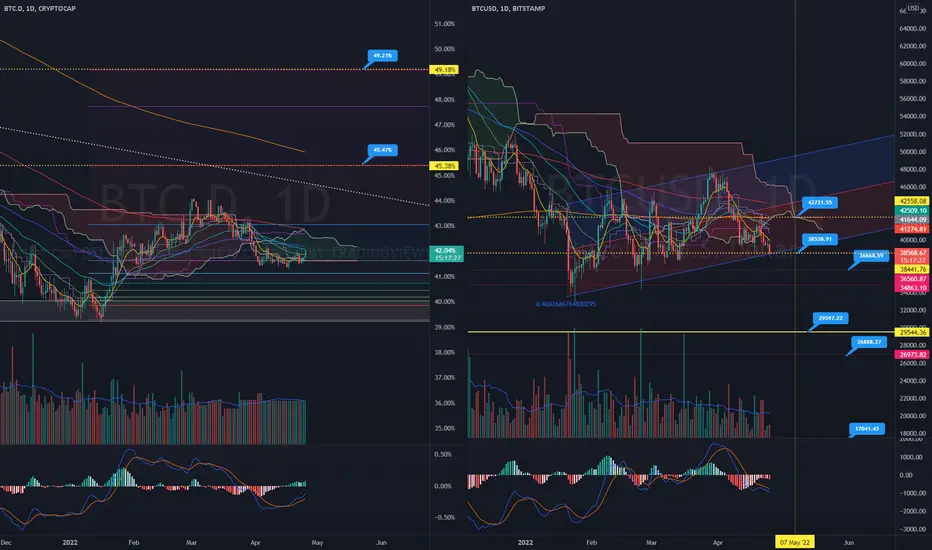
#BTC can hold the $38,500 price zone?#Bitcoin is trading around $38,500 (dangerous price)
From now until about 07/05/2022 #Bitcoin will have strong fluctuations in price
#bitcoin prices heading after breakdown 38,500
1. 34,000~36,500$
2. 29,000~30,000$
Dominance #bitcoin is showing signs of increasing again, expecting to break out of the triangle compression area => Target : ~45% & 49%
During this period set stoploss for each trade !
How has BTC dominance affected ALTs? 1 month after publication!
A month ago the idea "BTC.D, dominance is going down! Is ALTSEASON coming soon?" was published. The price (%) began to fall after leaving the channel and testing it as resistance.
What is dominance? Bitcoin dominance is the ratio of the capitalization of the major cryptocurrency (BTC) to the total capitalization of cryptocurrencies. Simply put, % of Bitcoin's capitalization in the TOTAL capitalization of the crypto market (Bitcoin+Altcoins). Now it`s 42%.
When Bitcoin dominance falls, 99% of altcoins start to grow. This is also called an altseason . The longest altseasons with 10-100x for ALT`s happen during the end of Bitcoin bull market (2017, 2021), but during temporary corrections like this small altseasons also happen.
In one month, Bitcoin rose by 16% to $48,000. We see that 3/4 of altcoins have grown more than Bitcoin:
1. Cardano (ADA) +35%
2. Dogecoin (DOGE) +50%
3. Near Protocol (NEAR) +82%
4. Only BNB have grown as well as BTC +16%!
That's why it's important to pay attention to Bitcoin's dominance (BTC.D). It can be an additional indicator to open a trade!
Did you use our tip a month ago? Write in the comments, it's interesting to know.
Friends, press the "like" button and share with your friends - it will be the best THANK YOU.
P.S. Personally, I open an entry if the price shows it according to my strategy.
Always do your analysis before making a trade.

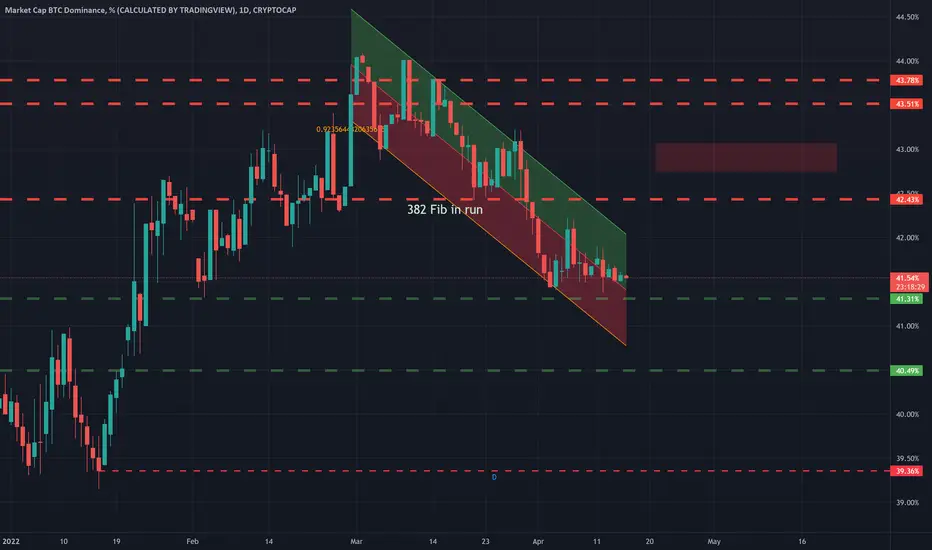
BTC.D - I'm calling it my treasure mapI heard the voice of Mr Klaws and that said it's time for a reasonablely noticabel market move. If you're not familiar with BTC.D, feel free to PM me or ask here and we'll explain. I call this the "treasure map". My strategy is BTC in the green channel, my fav alt probably coming into a buy zone or opportunity. Red zone should be printing profits. Green dash lines are market support for BTC. Red lines and box are where we would find massive supply (people selling cheap) of alts.
It is important in this time to keep focus on a longer trend and make some hay.
Or it mega bounces and my portfolio hurts....
invest wisely and with confidence or not at all.
AKKK AKKK AKKK AKKKK AKKKK AKKKKK
BTC Dominance Channeling into AltseasonClearly to see: 8.236 / 1.272 calling for BTC.d
Let it fight a while inside this triangle before giving it up and blow all the liquidity into alts
Hold my beer pls
----
No financial advice, do your own research, don't be stupid
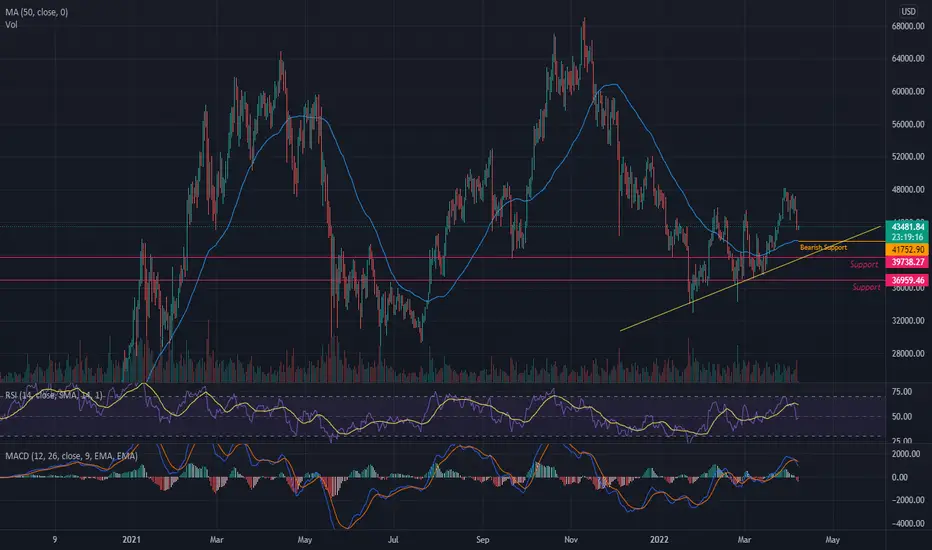
BTC REJECTED 📉😔Greetings,
Today we're looking at Bitcoin price action and it's 1D candle close. The past 2 days both daily closes have been in the red, that may show a sign of things to come. Yesterday we can see a Bearish Inverted Hammer & Today's candle, which has just closed is a bearish candle. I'm looking for tomorrow's daily candle to close above $44,400 to stay in bullish territory.
1D Time Frame 50MA (Blue line) - This can be a level where we will see as support if BTC reaches these lows. If BTC reaches these levels it will be around $41,800 price range.
Trend Line (Yellow Line) - If BTC price action falls below this line, expect armageddon.
Keep in mind we're watching Bitcoin price action closely as it determines our Altcoin trading as well as USDT.D & BTC.D to do our analysis.
Remember, nothing is guaranteed, control the controllable.
Mogues