Bitcoin chart analysisBitcoin may fall once more around 9950 area.
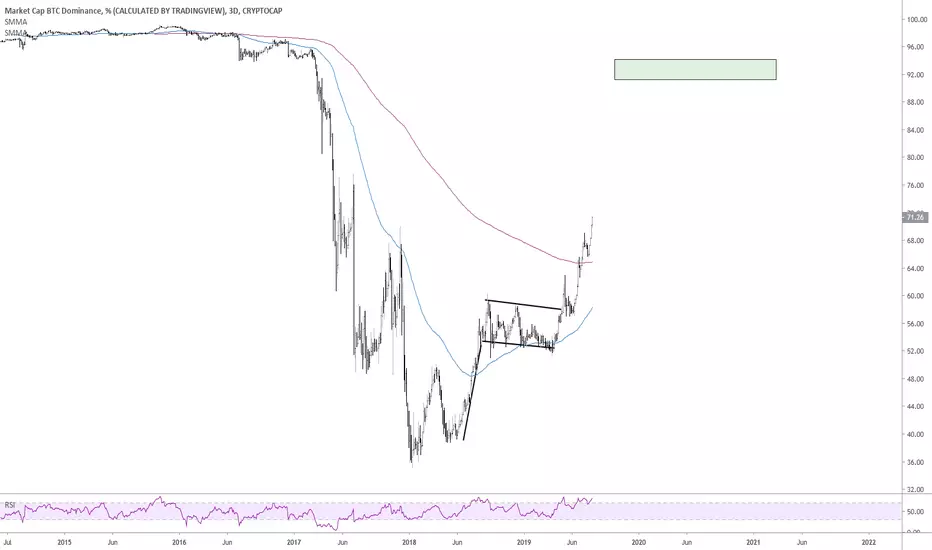
it seems like dominance chart is dropping down so alts are gaining their powers while bitcoin is slowly losing its strength.
i would go for eos and eth for short term and for long term xrp looks good.
since dominance for bitcoin has dropped its shoulder area it may drop harder than before which means more alts are going to pump.
check out threads and press like button and follow if you want more analysis.
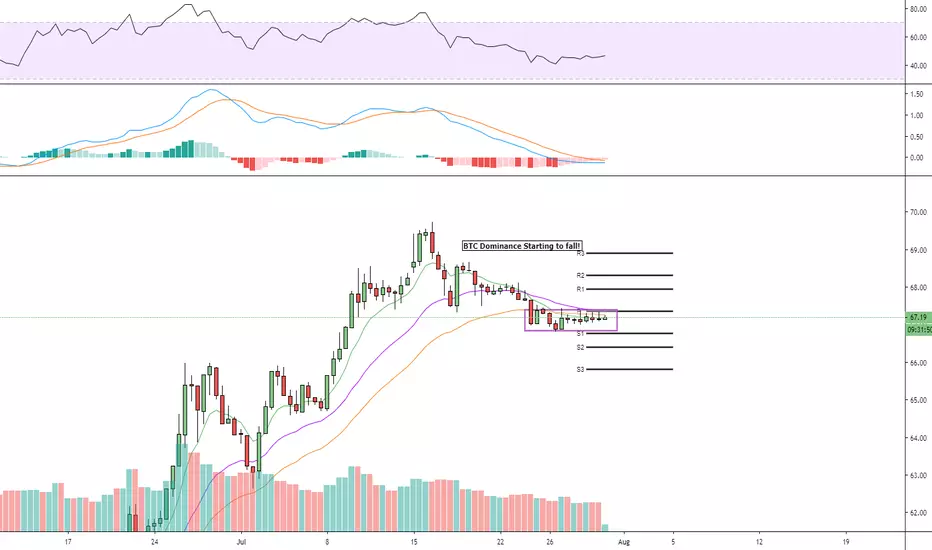
Btc-dominance
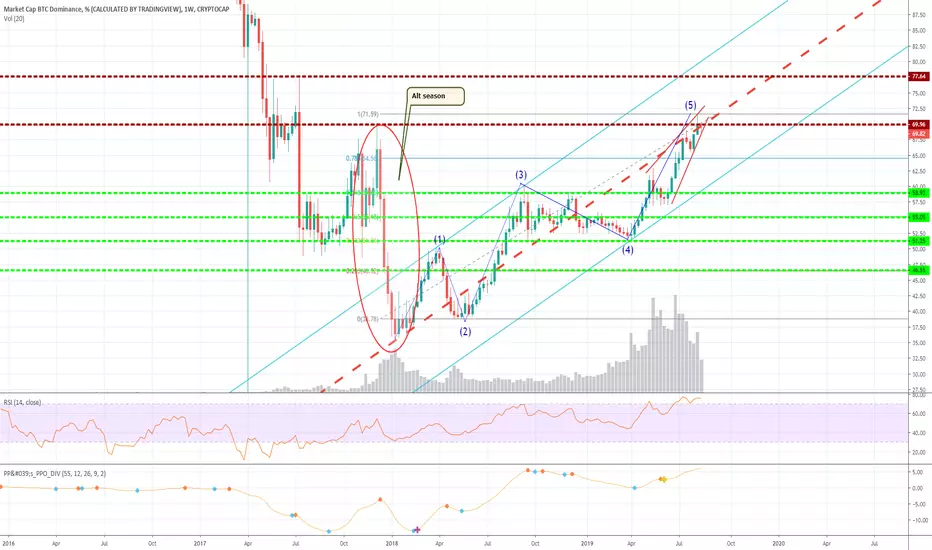
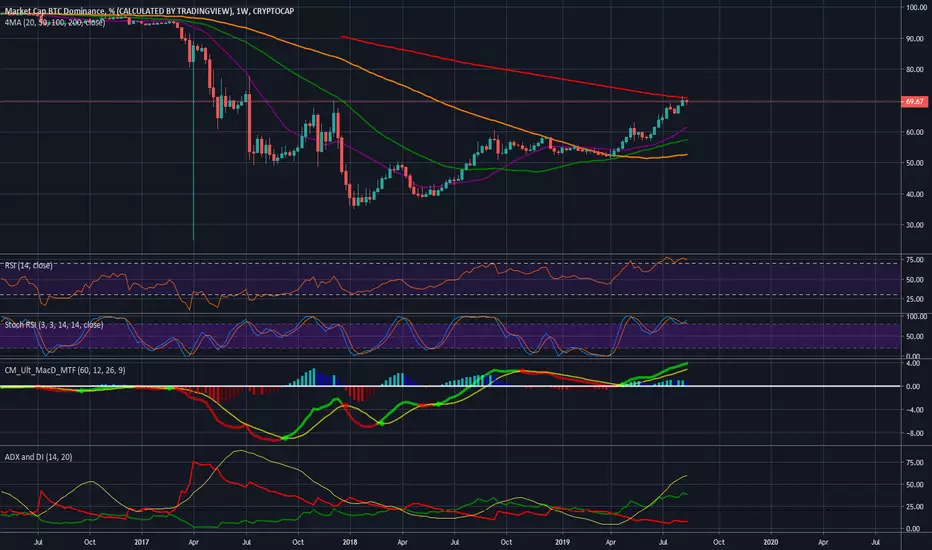
BTC DOMINANCE around topThis is what i am looking, btc dominance could top around 75 and then rejected with a retrace below 70 around 62/65.
This will give alts some exposure.
Enjoy.
-------------------------------------------
If you're interest in my indicator "Lady BTC BOTTOM" check the link below:

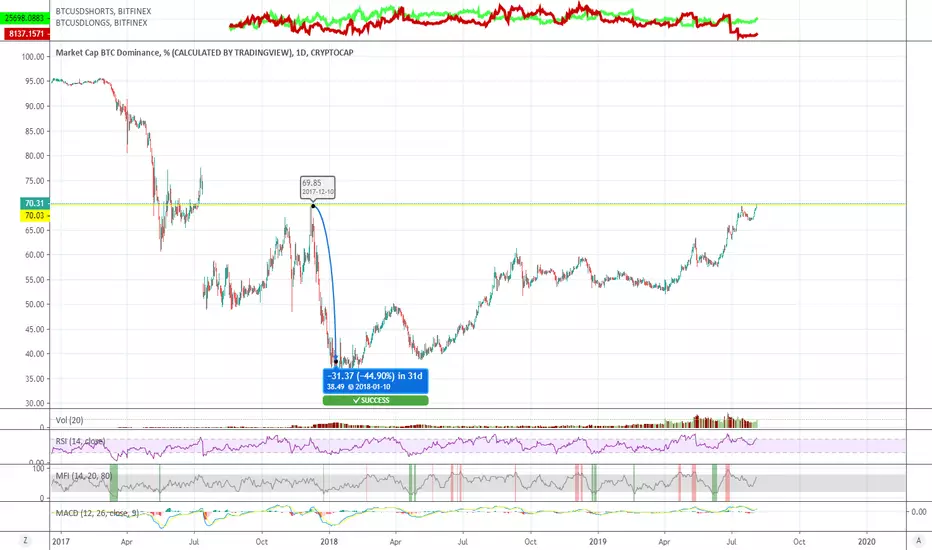
Market Cap BTC Dominance - Including BTCIt seems that the BTC dominance just hit a crazy number and in my opinion it's about to go down!
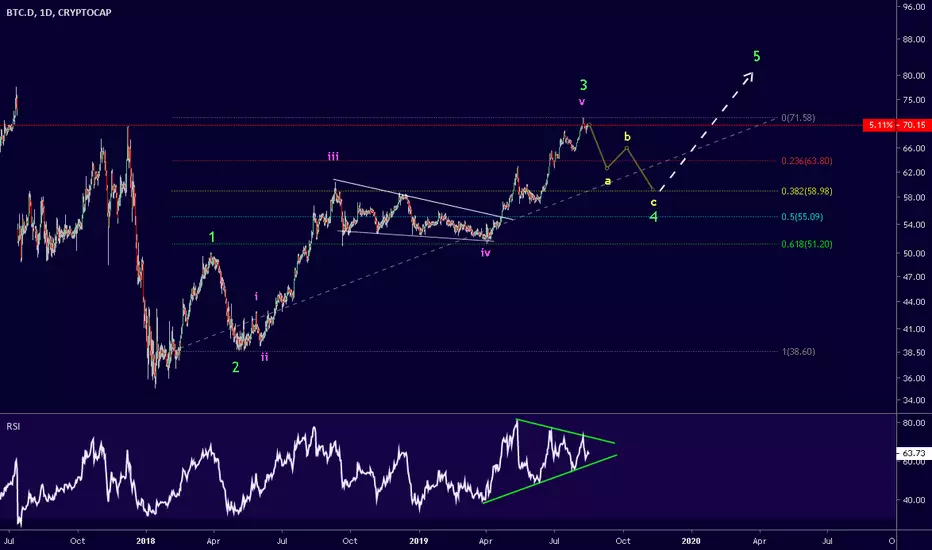
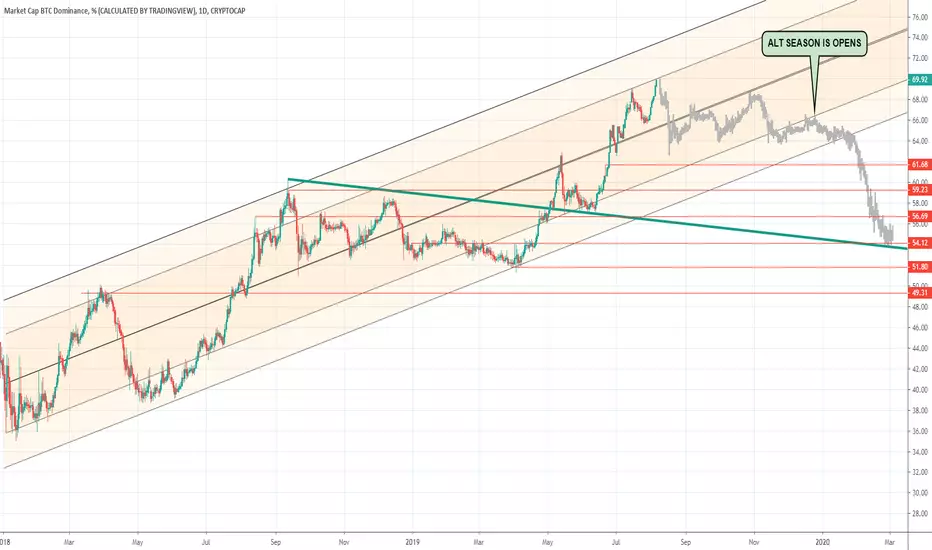
BTC Dominance (1D): Alt Season Soon!BTC Dominance fell off the bearish wedge. RSI is showing a triple divergence. Looks like alt season is around the corner. Good luck everyone!
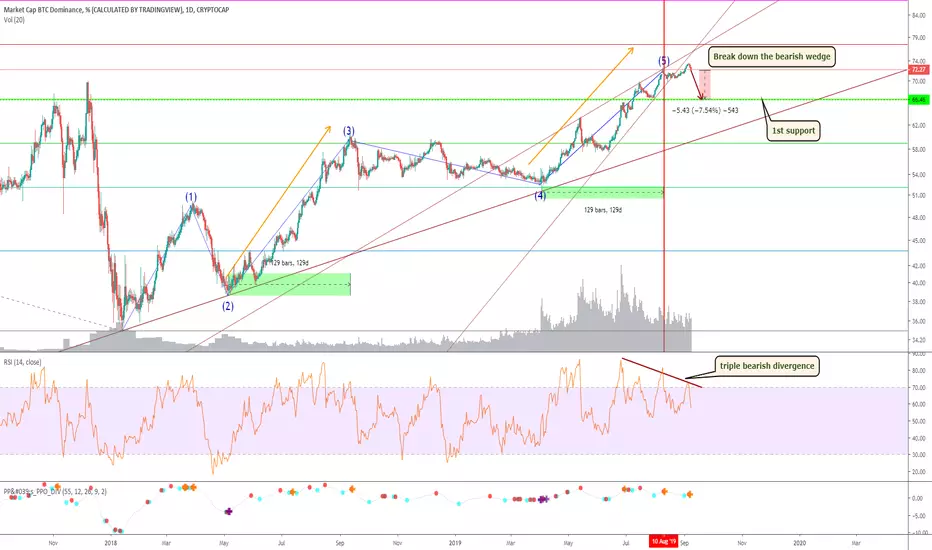
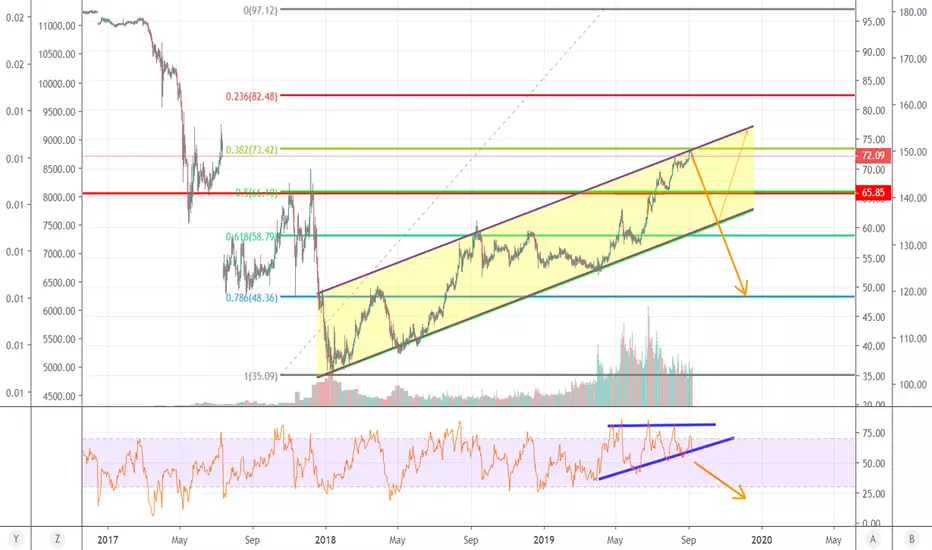
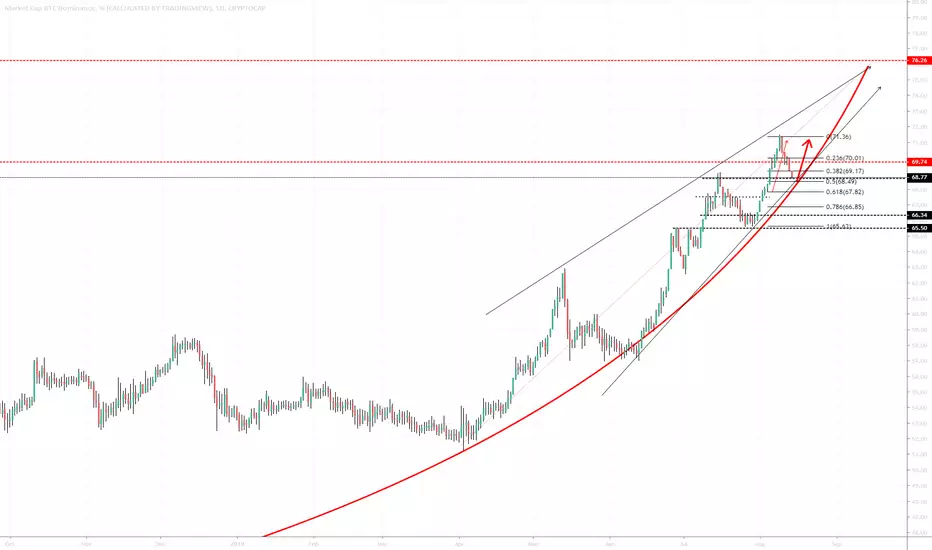
BTC dominance reversingDominance was rejected at the .382 fib which is also the resistance of an upward channel that dominance has been in. The RSI is in a rising wedge and looks like it will breakdown. This could be the start of the 2019 Alts season.
If dominance breaks down from it's channel, it will drop further than the .618 support, because the target of the channel breakdown is much lower.
Bitcoin dominance comejust looking at the weekly chart the first goal sbltncz the point is marked with a yellow oval
BTC.D - alts going to recovermany of altcoins found their bottoms. but always have stoploss in case things go against your will.
BTC Dominance (TA). BTC to go up soon again.Observation:
BTC dominance has almost hit the 0.5 retracement fib level around the 68% mark.
The ALT dominance chart has not made much gain in the same move.
Stockatic RSI indicating over sold region, etc.
Thoughts:
Factoring a random no. of ALTs and how they have reached key resistance levels coupled with BTC dropping to the buying zone\s, I would bet that BTC is about to go up soon and the ALTs to drop further.
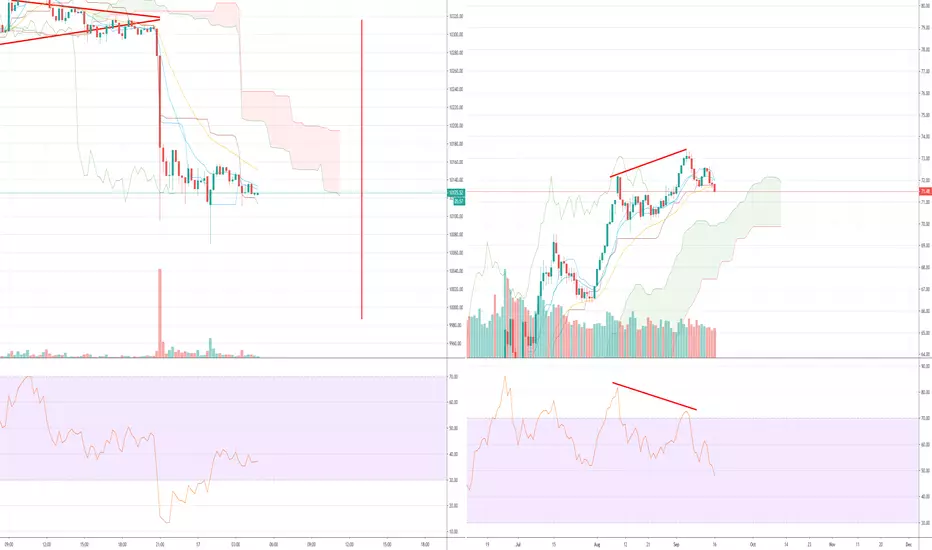
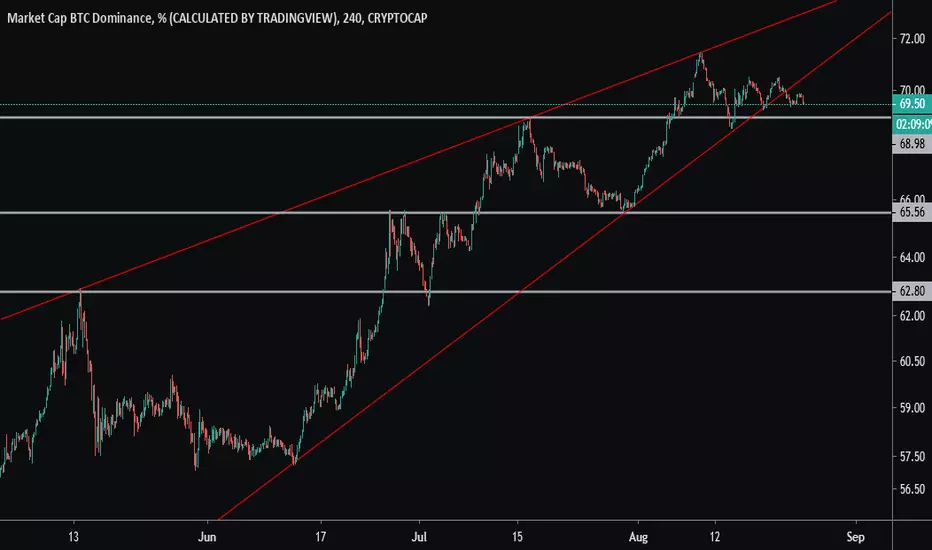
BTC Dominance (1W)We currently testing the first target. The following week or 2 weeks will be crusial. We either gonna start altseason now(end of August - max beginning of September) or BTC will kill all shitcoins completely and go to 77 level. Lets see... Too many factors tell us that Dominance should go down now. We are on the middle of the channel, bearish wedge, pinbars, strong sell levels. Lets see.. Good luck everyone!
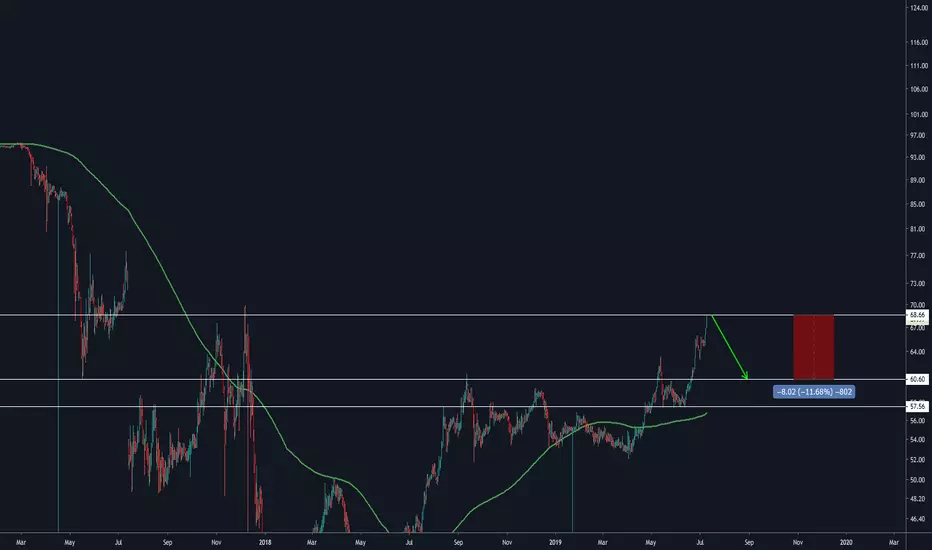
BTC dominance about to fall to 62%As seen in the chart, BTC's dominance is currently facing resistance and is likely to fall back to 62%, when supported by the EMA.
This means a short alt revival is on the corner, maybe initiated by ETH or XRP.
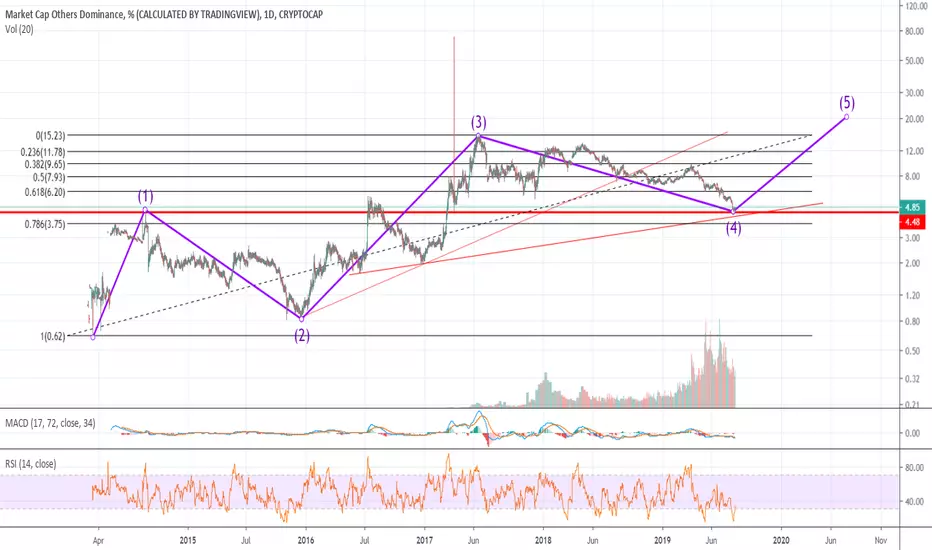
Alt Season??!!the dominance of the alt has reached a good support point near the 0.786 fibo along with a lta and can reverse and make its wave 5,
BNB - Trend Starting? Can it carry on? With BNB. Is it possible we get a trend? New rules in terms of how the holding period is for BNB holders (30-day rule) can this be one of the main growing coins when BTC Dominance comes down... Likely...
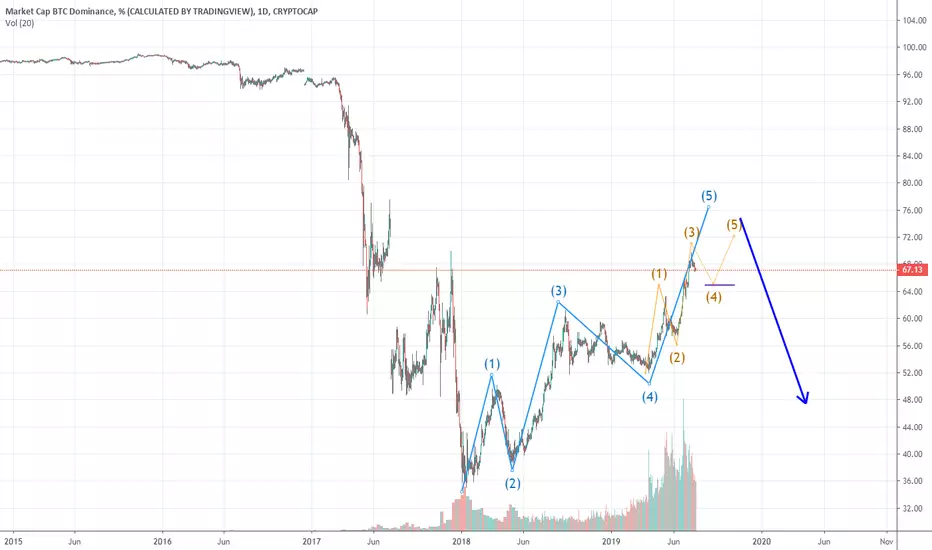
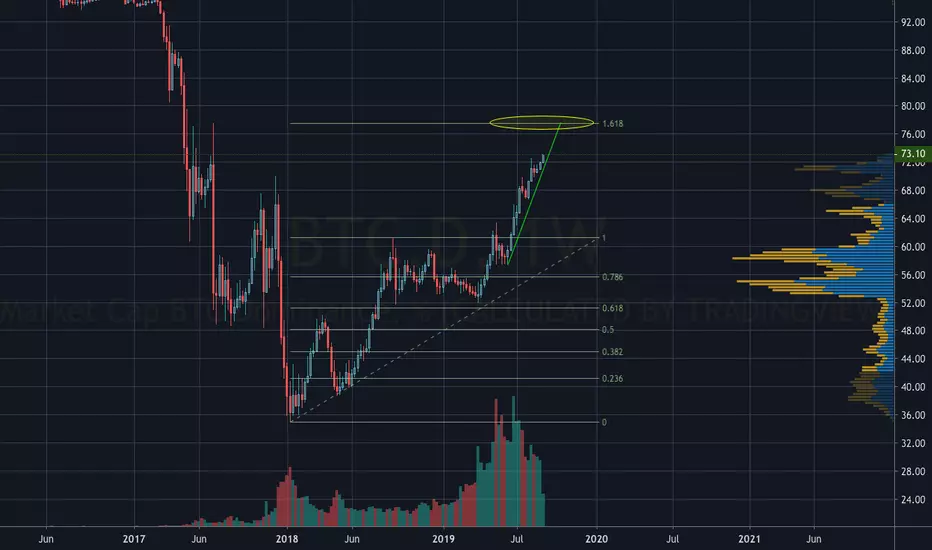
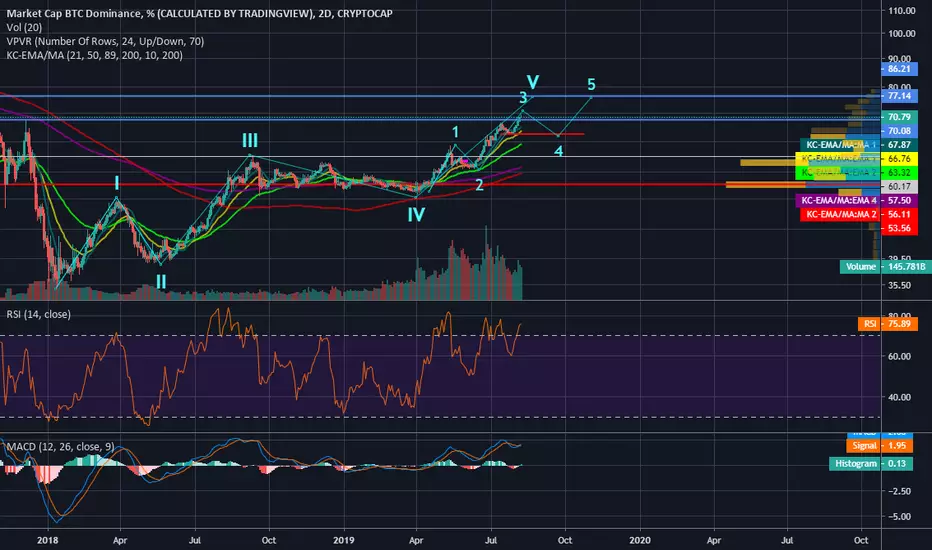
Elliot Waves on BTC.D I don`t usually do TA with Elliot waves, but I could see this on BTC.D any opinion on this would be very useful. Final target 77.5% - 80% Thanks!
Bitcoin is healing from the over speculation of Alts-Market recently over speculated on alts by greed and lack of understanding the nature of what a cryptocurrency is (2017)
-It damaged Bitcoin and severely lowered its market dominance
-Market seems to be readjusting the natural Bitcoin dominance
-Alts could have plenty more downside remaining, Bitcoin probably has a lot of juice remaining
-Punishment of the over greed and over speculative nature of alts, that attracted throngs of average joes
-If you think useless shitcoins having a hundred Million $ marketcap is normal, you will be trapped again
-Reverse = Alts/Btc bubble bursting
-Bear in mind that some alts are more resistant/stronger than some others, please do your own research
-Bitcoin is a strong nascent asset that punishes over bearish behaviour since 2010: wether people short it heavily, wether people over buy alts hoping to make money VS Bitcoin or even Usd, are punished.
Ciao!
Bitcoin Dominance Back to 50% is ImminentMost are now are all in Bitcoin, especially considering BTC.D growth. This is market panic, which does result in a lot of money being moved from alts to Bitcoin.
But this is exactly when smart money goes in. The market pshycology tells me, that this is perfect time for BTC.D to start reversing. Nevertheless, the it could be too early for the Alt Season to start.
I'd expect it to BEGIN at the end of this year.... or, to END by the end of this year. Soon we'll find out, but I am holding my alts long term.
Now you might ask why BTC will lose so much dominance. Well, BTC is a store of value, a long term "GOLD" investment. But, blockchain continues to develop with mass adoption on its' way. This will stimulate the growth of other chains and capital will be slowly distributed. People don't like to keep all eggs in one basket, even if this is a basket of Gold. They will buy Silver, Diamonds, Property etc simply to diversify.
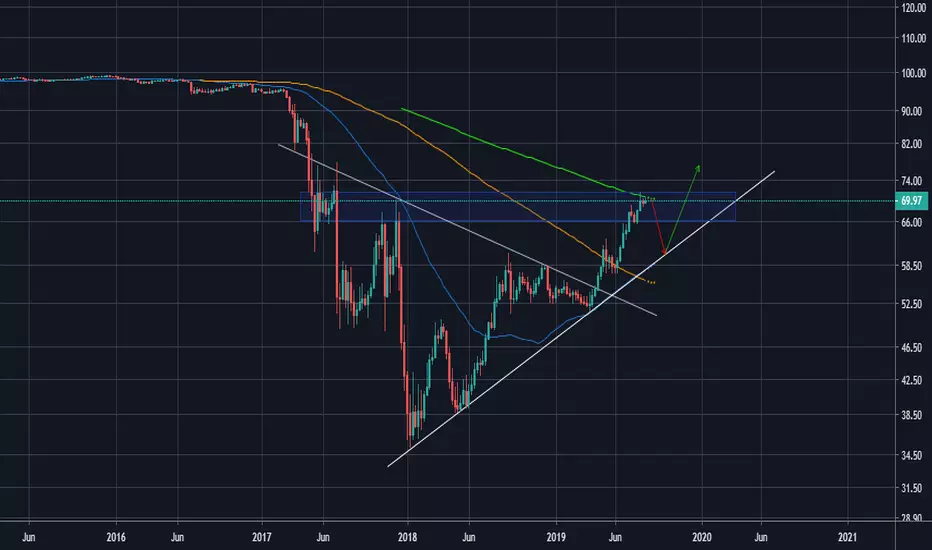
BTC DOMINANCE AT KEY LEVELS FROM 2017 DECEMBER...This could be a key area for Bitcoin and it's dominance. Last time we had it this high was before the alt-season rally of 2017. If that was to repeat. The amount of gains in the alt-coins would be pretty large as a lot of alt-coins are at pre-2017 levels.

Bitcoin Dominance Bullish. Alt season or Altpocolypse?I keep trying to warn people and have said since April there is no alt season yet. This is the only chart you need to watch. It is the playbook for alt season. Right now do not fight the trend. Alts can drop another 50%+. Btc dominance made the 67 level resistance into support, which is very bullish. It may not be a straight line, but I see no reason why dominance cannot run to 75-80. Imagine what this will do to alts. Imagine btc hitting new all time highs and most being stuck with worthless bags of alts. The trend is your friend. Until we see this chart reverse, anyone playing in the majority or alts is just gambling. Btc is flexing its muscle and only when btc is done its run and cooling off, will money start to flow back into some of the alts that do not die. Don't get rekt and try and catch a falling knife. Watch this chart for reversal pattern. Until then stick to the king bitcoin.
BTC Dominance - Sideways - Should We Be Worried?Should we be worried about the lack of movement in dominance?
BTC staying stable at 9400 however no money coming into alt-coins...
Make or break the region to see if Alt-coins will move forward or drop back.
soon alt season, Elliott wave analysis BTC dominanceWe may be in the middle of wave 5 in BTC dominance, at the moment probably at the beginning of wave 4 with 3-4% correction still to go. Wave 5 will be followed by a major correction, it s when alts will moon. Good luck to all and happy trading!