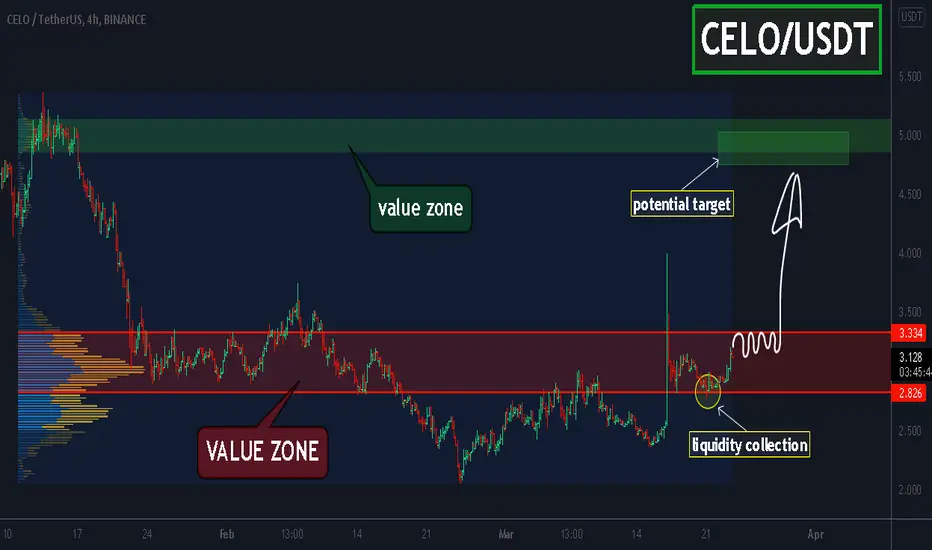
CELO, PUMP after a HUGE accumulation?After a false level breakout and liquidity collection, Celo now continues to rise.
A break up from such a huge accumulation zone could lead the price to a big PUMP.
The target for the global move is $4.7-5. Here is the nearest value zone and the psychological $5 level. At this price, most traders will close their positions and the price can pull back temporarily.
Friends, push the like button, write a comment, and share with your mates - that would be the best THANK YOU.
P.S. I personally will open entry if the price will show it according to my strategy.
Always make your analysis before a trad
BTC-ETH-XRP
$XRP$XRP Shaping up for nice 20%+ move with price now testing long term trendline from the ATH. Looking for $0.77 support to hold otherwise price is likely to rebound and bounce from around $0.72. Overall looking bullish
891% RISE in XRP!?? From $0.7 to $7.1Weekly Timeframe
Breakout Area / Rejection Area: $0.7979.
Bitcoin doesn't have much movement for today as we are in the weekend. but XRP moved for at least 5%. WE are entering a Breakout Area where we would most likely hit our target price of $7.1386.
1D Timeframe
From our 144 EMA, Rejection areas are $0.8448 & $0.7948.
We are back inside the cloud which means its neutral. RSI is bullish crossing MA. We are yet to see the next Awesome Oscillator (AO) volume, it can print a positive volume to continue the trend to the upside.
Relative Strength Volatility Variable Bands (RSVVB) is currently constricting the tunnel preparing for a massive pump. we are ripe for a pump to the upside. Ride before it flies.
4H Timeframe
We are holding on to 200 MA which means we are already in the bullish trend. Area of support $0.7505. Rejection Area $0.7876. There might be an incoming correction as our AO is still in negative. 144 EMA and 233 EMA are exactly at the same support area of 200 MA. This means it will be SUPER BULLISH .

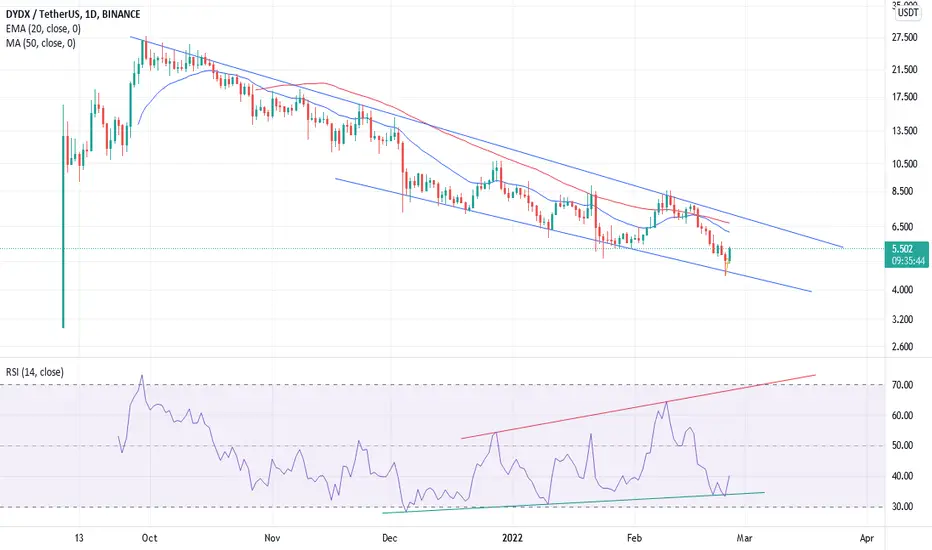
Wedge in dYdXHi friends!
As you can see in the dYdX chart,
The price has formed a Descending Wedge
And there is a positive divergence in the RSI
And in his Bitcoin pair he is testing his floor for the fourth time,
Do you think it can form a wedge pattern here?
Thank you for supporting me!
Good luck!
LTC - levels to watch on the way up...Possible long after confirmation of current resistive formation forming on Daily (thin yellow line). Theoretical confirmation circled.

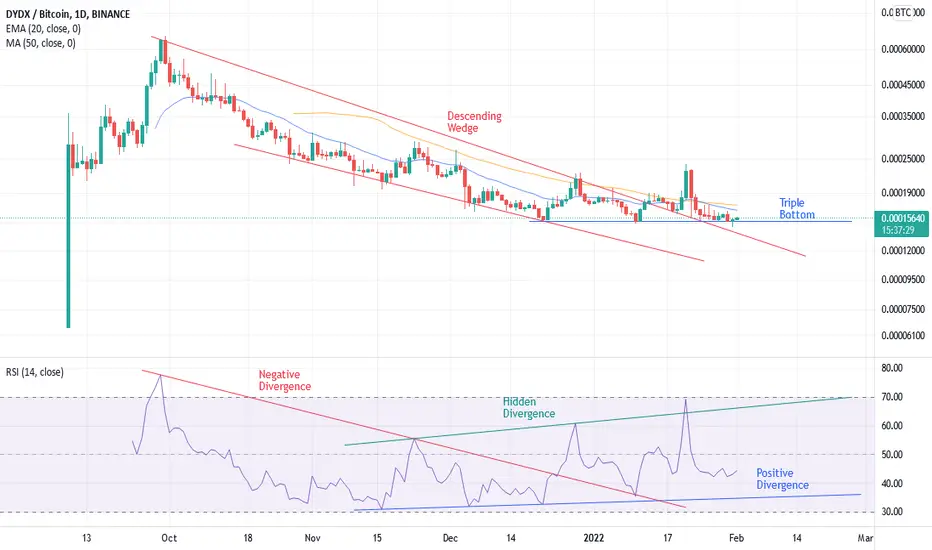
Rally in dYdXHello friends!
In the DYDX chart as you can see,
The price is forming a rally on the downtrend line,
Can that level be tested again,
Or is it possible to climb from here?
Thank you for your support!
Good luck!

same trap same fake movesGuys btc is doing same traps over over again. First it breaks triangle pattern in 1h frame to down. Then it price go up a while to retest the triangle break point again and again but never up break retest and big fall happens.
They doing this to make people open more long position and believe resistances really gonna break. Dont fool to this traps.
Let me tell why btc will go 28-30k in couple of days.
Tech analysis ; Daily falling trend , Not broken yet.
Negative divergency in 1 hour , 30min charts
Hidden negative divergency in 4 hour , Daily chart
Fundemental part : Russia is about to go in Ukraine.
Every hour there is new news come up that How Russia is preparing for war against Ukraine.
US fed will increase rates in next month.
So in this senario , How logical to wait BTC will break all the resistance levels and go up?
Please dont fool “market pumpers”
Lets watch
NFA
DYDX H&SHello friends!
As you can see in the chart,
DYDX forms an inverted head and shoulder,
Can it approach the downtrend line?
What do you think?
Good luck!
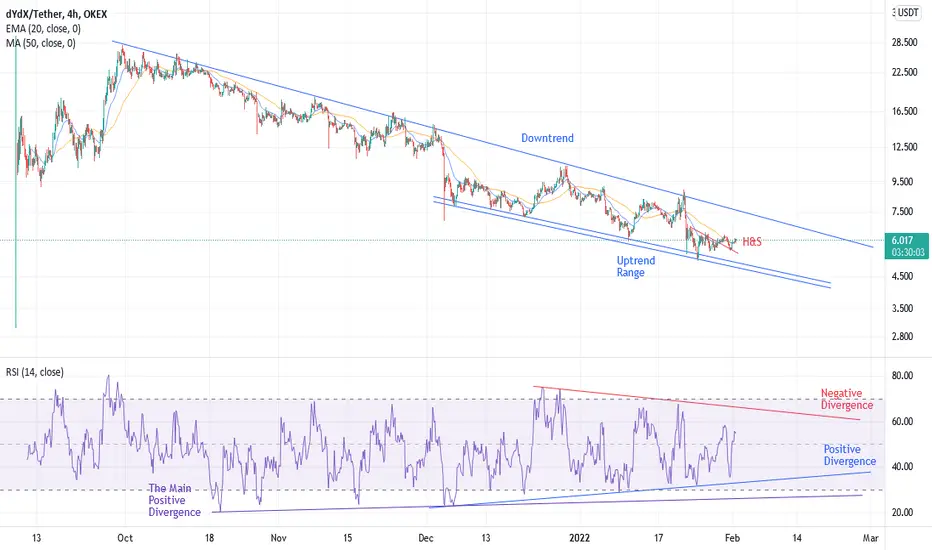
DYDX Triple BottomHello friends!
As you can see in the chart,
DYDX is forming triple bottom and has come out of the wedge,
Can a rally be formed?
What is your opinion?
Good luck!
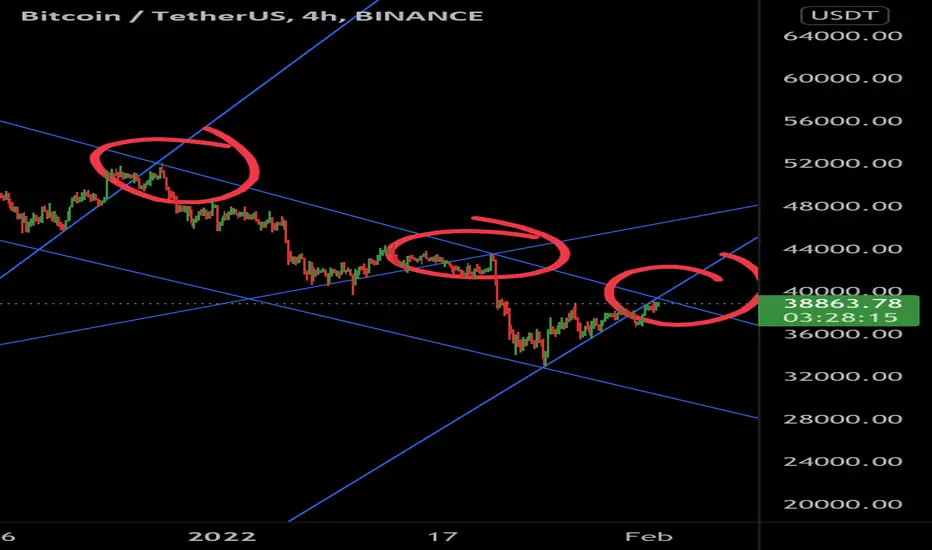
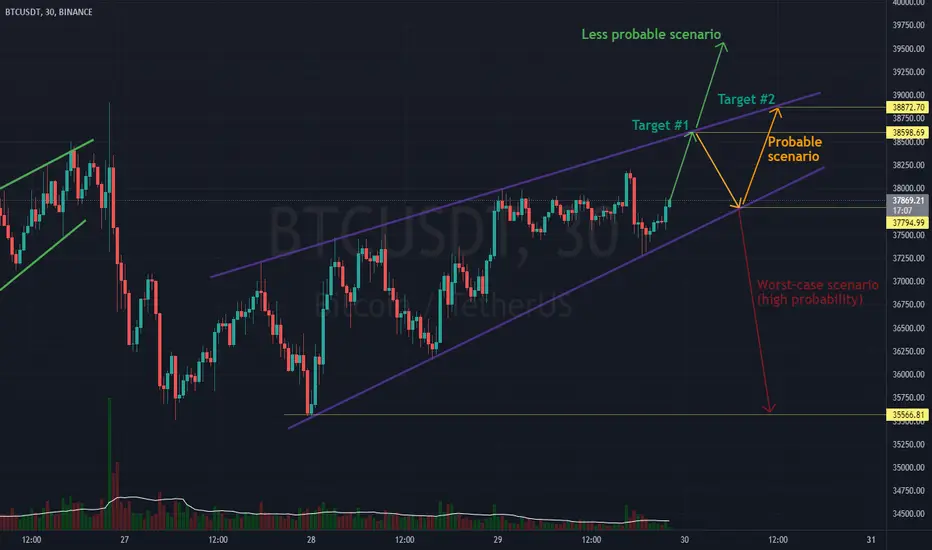
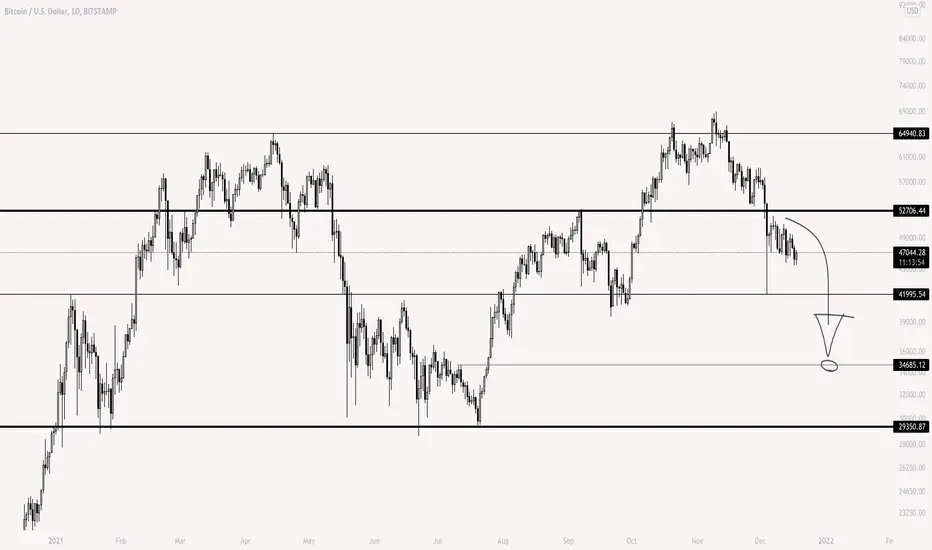
Local rising wedge on BitcoinThere is a local rising wedge on Bitcoin.
The price will probably go to Target #1(~$38.600) and then most likely return to the lower boundary (~$37.800) and either go up to Target #2(~$38.900) or play back the rising wedge and fall to the target (~$35.500).
TOTAL CRYPTO MK CAPmarco the crypto mc looks to be slowing down the aggressive moves towards lower liquidity.
Trend expecting price predication end 2022-oasis network $ 7-11 Hello trading friends,
This is an open free price prediction trend for the oasis network end 2022.
it's fully an expecting trend depending on some trends. and made for just to check it back later.
I see it as a small challenge to watch it back at end of 2022. but know that you should not go from this side study, as it can also be wrong. we don't know the future, the only we do here are expect depending on data trends.
End 2022 I will look a check to it, to see where it did end.
Expecting price action for this coin is between 7 USD and 11 usd+ for end 2022.
That's a huge increase trend, this depending also on the green cycle trend.
Have a great day, next update on this coin here is at the end of 2022.
know that this is a long-term project.
This is not a trading call, but a free-expecting idea and made to check later.

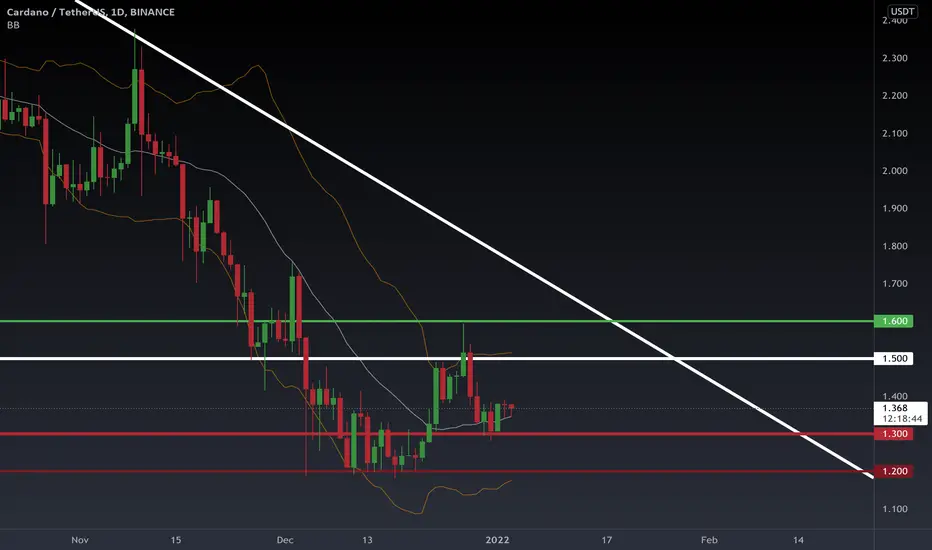
The $ 3.1 range is still maintainedOn a daily timeframe, the $ 3.1 range is still maintained. While I expect Bitcoin to move higher, Cardano can retest for $ 1.5 and the $ 1.6 range. If the support of $ 1.3 is lost, the $ 1.2 range is more important for Cardano, which you can enter if the volume of trades increases.
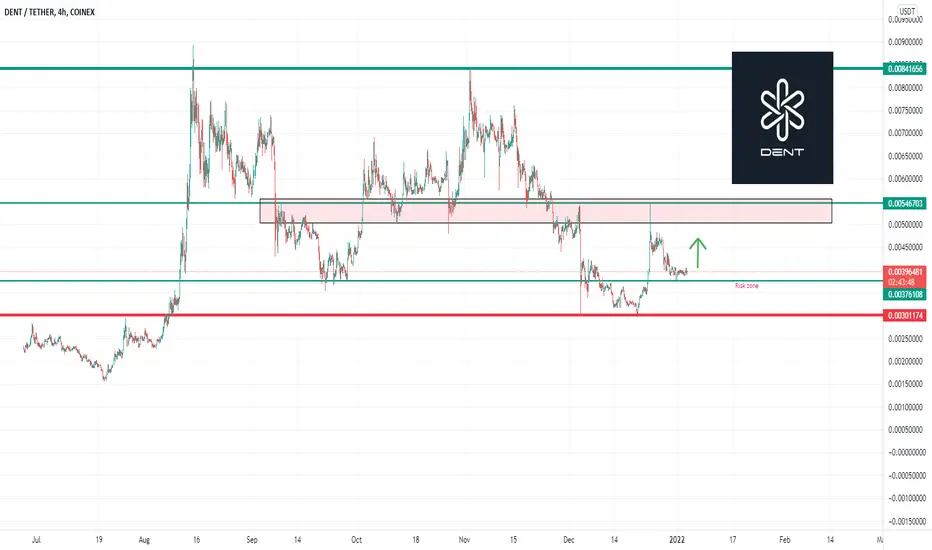
DENT - INTERESTING TARGET FOR POSSIBLE Increase trendHello trading friends,
This is a small update for Dent that shows interesting trends in the short term.
Depending on the last trend if the dent stays above the risk zone, that it could breakout.
It's always good to make a dollar-cost average on difference trading so that you will be not focused on 1 trade. and for day traders, it's important to use a max loss before entering any trade.
I did scan this view and did share it with you all, so you can take a look at it to see if it's interesting.
know that Dent has had a 31%+ breakdown trend since the last point and it can still break down more - but since dent is now on the important level it could behave a new increase range and that's interesting to watch out.
- This is not a trading call view, but more to check the trend and that we all learn more from increasing coins.
Have a great day all!
BTC#BTC
No need to worry about whether it will be a bear market or a bull market….
You don't need either one or the other, you just need a little volatility (read as an opportunity).
RUNE UpdateWe entered when RUNR broke resistance trend line and the behavior shows strength. As per previous post we have been watching the formation and we have now entered.

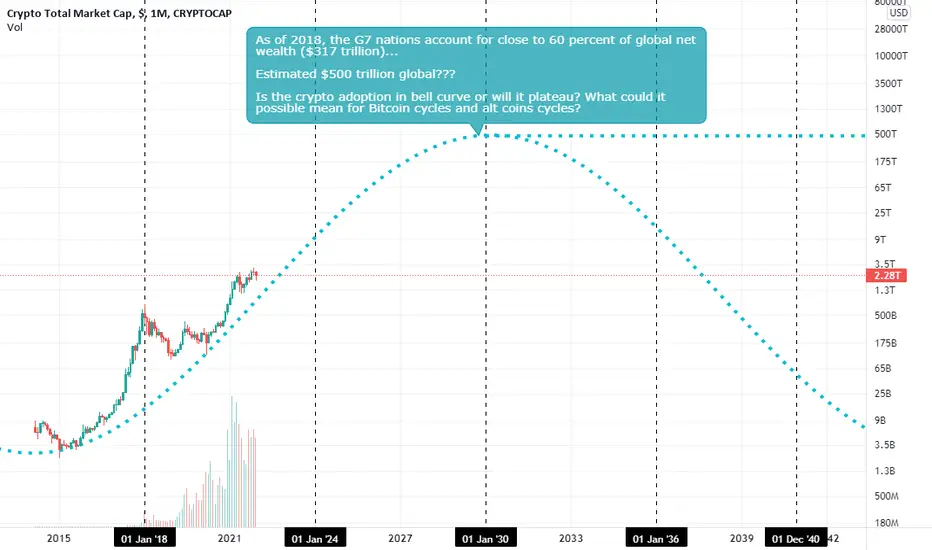
How could the cryptocurrency adoption affect Bitcoin and Alts?I'm just wondering. Can someone please share your thoughts on this? Will the cycles be the same or not?
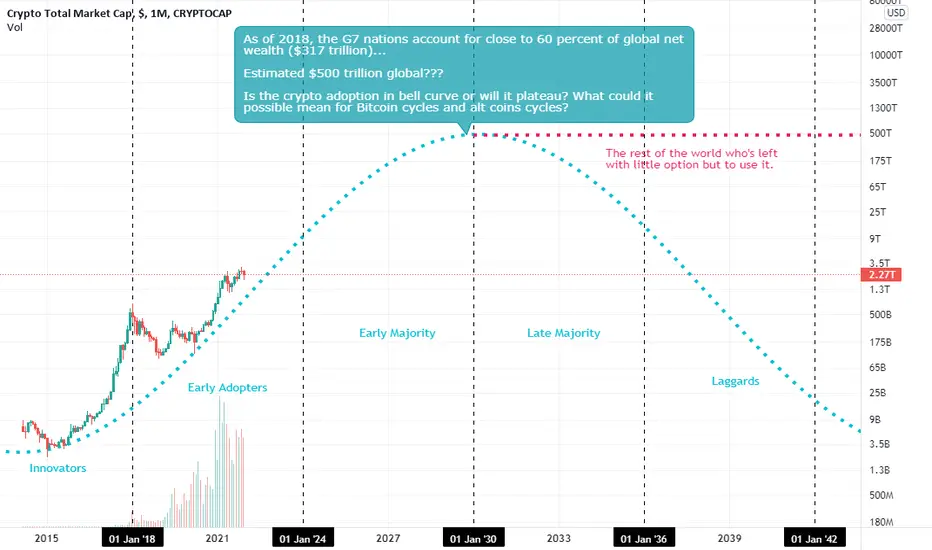
How could the cryptocurrency adoption affect Bitcoin and Alts?I'm just wondering. Can someone please share your thoughts on this? Will the cycles be the same or not?
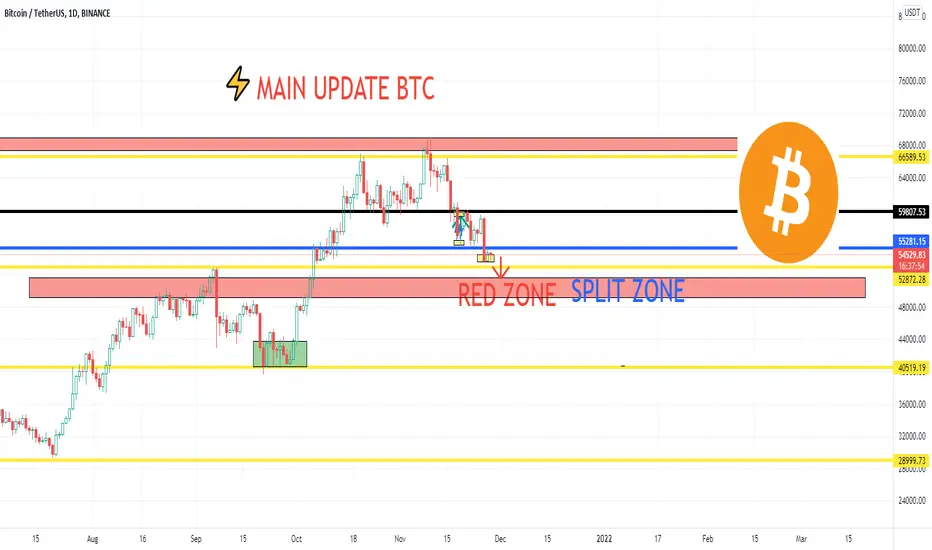
BTC - THE WAY TO 50K TREND DEPENDING ON ETN TOOL POSSIBLEHello trading friends,
⚡️ Small bitcoin update depending on last trends
🚁Bitcoin is still not interesting for the main trend for an uptrend, until at 56400+ with confirmation and time frame. ⚡️ Scalps are a possibility for day trades into this stable trend.
✅Bitcoin is still into breakdown trend depending on the main trend and can with time frame even hit the 50K area.
💎its important for BTC's healthy trend to get an increase to 56K, otherwise we can see into short term a recovery trend.
Have a great time.
# depending on the ETN tool it's possible that we can get a recovery to 50K area in the coming time, see November chart here below.
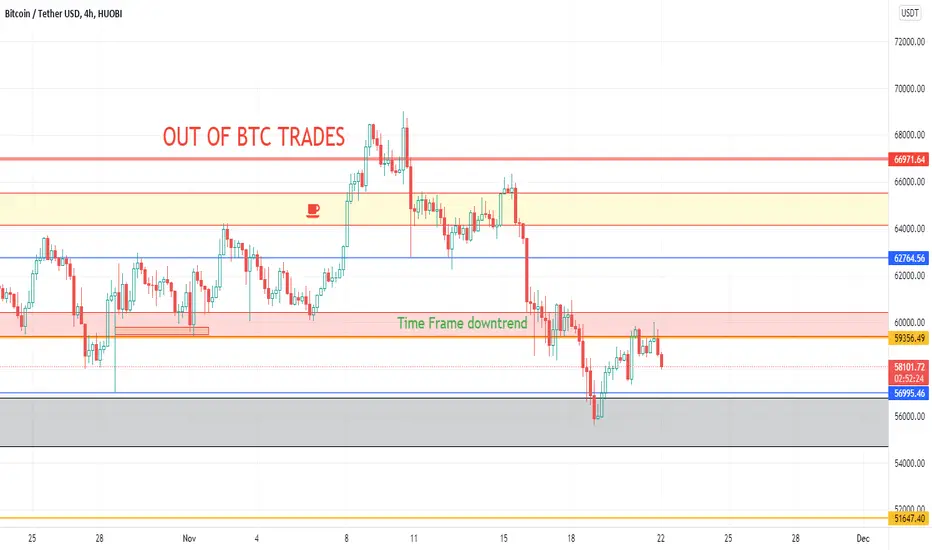
BTC SCALP LONG TRENDHello trading friends,
Since the last short scalp, Bitcoin looks to enter a new scalping trade for long trend.
Know that this scalp trends are for a short periode and it says noting about the main trend.
Have a great day!
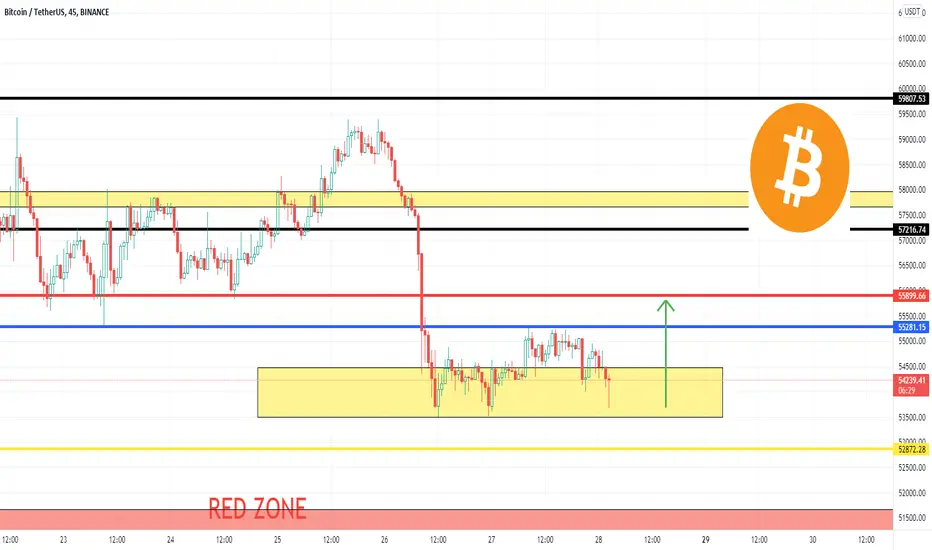
BITCOIN TIME UPDATE WHAT NEXT?Hello trading friends,
This is a small update for Bitcoin depending on the market change since the last trend increase.
depending on last trend changes. Bitcoin looks to get a breakdown trend, and what is the trend now on bitcoin?
As long BTC holds the 57100 trends we could speak about healthy trend, but if Bitcoin breakdown also the 57100 with time frame and confirmation ( so means not just hitting it, but with time frame, then we could see more breakdown trend.
Bitcoin should return at last to 59400 with a time frame to get a trend stable, moving between 57100 + and 59400 could be for more a No trading zone. of course, there are always trends to make a scalping trading.
⚡️Powerlines
55400
57200
59500+
Have a great day!
KAI KARDIACHAIN 0.60 $ by December 21 / January 22KAI is making 5th wave with target of 0.60$ .
If 5th wave gets extended that will bring price more closely to 1$ .

ADA Breakout As SuggestedHey famz, ADA has broken long term daily resistance as we suggested and expect a huge run this week.
