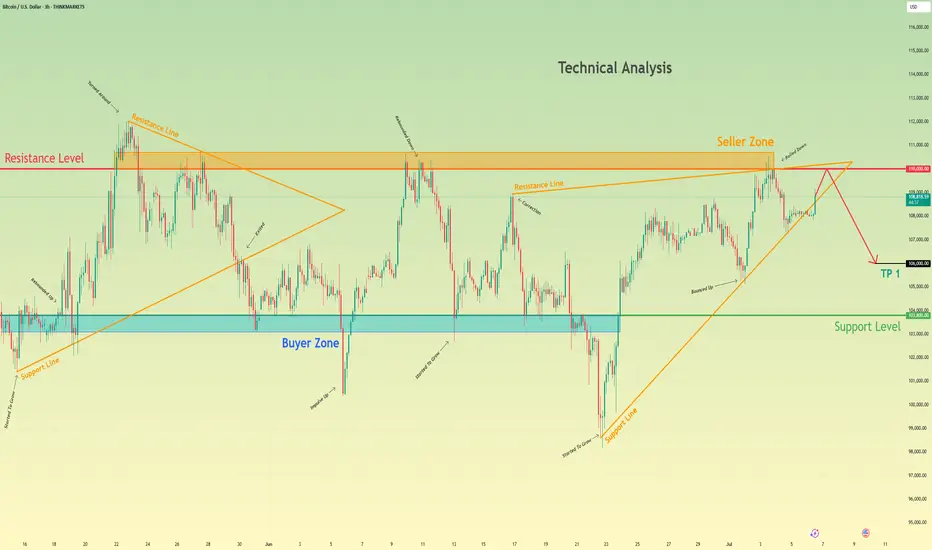
Bitcoin can rebound from resistance level and start to declineHello traders, I want share with you my opinion about Bitcoin. Recently, the price broke above a local resistance and quickly approached the key resistance level at 110000, which also aligns with the upper boundary of the seller zone (110000 - 110700 points). This area has already proven its strength multiple times, causing sharp rejections in the past. Moreover, the price has tested it again recently and failed to break through. In addition, we can see a triangle structure, which fits the logic of a pennant pattern after a bullish wave. However, the latest move upward has already lost momentum near the apex, and the price is now trading just under the upper edge of this formation. That makes this zone technically overloaded and vulnerable to a downside reversal. Based on this, I expect Bitcoin to test the resistance level one more time and then roll back down toward TP 1 at 106000 points, a zone near previous liquidity accumulation and a local consolidation range. If selling pressure increases, the price might aim for the buyer zone (103800 - 103100). Given the current rejection at resistance, the structure of the triangle, and the reaction inside the seller zone, I remain bearish and expect further decline toward the support. Please share this idea with your friends and click Boost 🚀
Disclaimer: As part of ThinkMarkets’ Influencer Program, I am sponsored to share and publish their charts in my analysis.
BTC-M
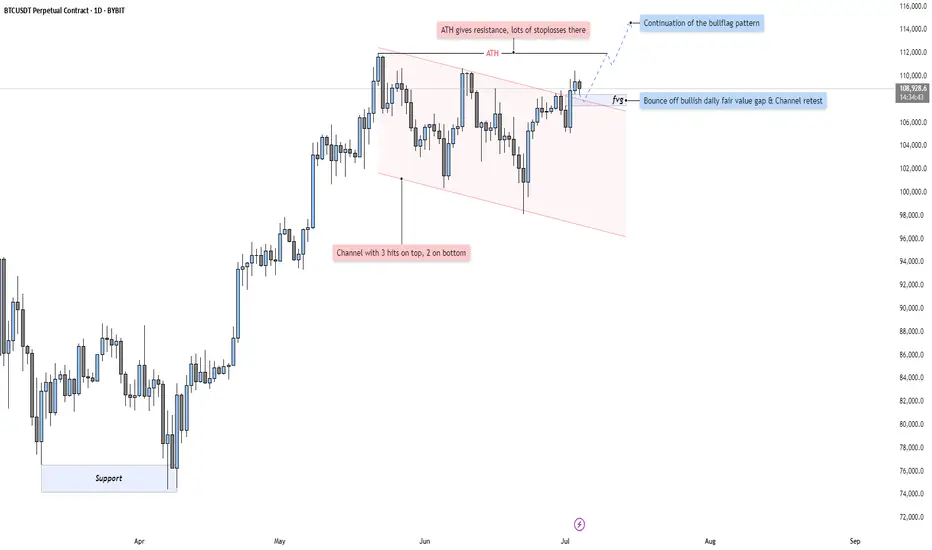
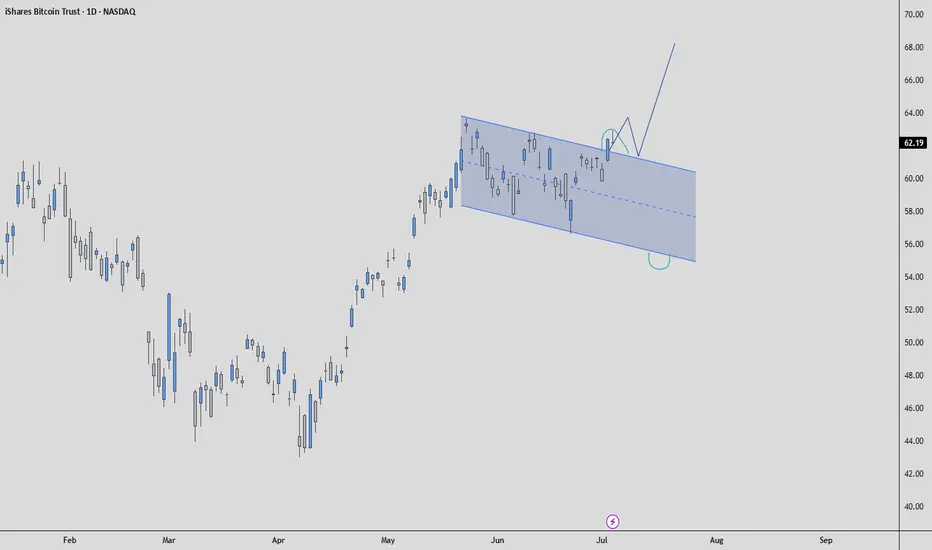
BTC - Bullflag Pattern points to new ATHMarket Context
Bitcoin has been trading within a well-defined descending channel for several weeks now, respecting both upper and lower boundaries with precision (3 touches on the top, 2 on the bottom). This structure suggests an orderly pullback after a strong impulsive leg to the upside in Q2. As price compresses within this flag-like pattern, market participants are watching closely for signs of breakout or breakdown.
Bullish Fair Value Gap Reaction
Recently, price dipped into a Daily Fair Value Gap (FVG) and bounced strongly — a key bullish signal indicating that demand stepped in at the inefficiency. The FVG also aligns with a retest of the channel’s resistance-turned-support, further validating the bounce. This confluence zone acts as a springboard for potential continuation.
Channel Breakout & Liquidity Above ATH
Price has now broken above the channel structure, shifting the market narrative from consolidation to potential expansion. The breakout zone is located just beneath the All-Time High (ATH) — an area that’s likely loaded with stop orders and breakout buys. A sweep or clean break above the ATH would not only invalidate the prior bearish structure but also trigger a fresh wave of bullish momentum.
Bull Flag Continuation Potential
Structurally, this chart presents a classic bull flag breakout. After a strong impulsive leg up and a controlled consolidation phase, we now see bullish continuation potential toward the 112,000–114,000 region. If the ATH gets breached and reclaimed, it could become strong support in the next leg higher.
Final Thoughts
This is the type of setup that blends both technical precision and market psychology — structure, liquidity, and momentum all coming together. Whether you're already long or watching for confirmation, this move could set the tone for Bitcoin’s next major rally.
If you found this analysis helpful or thought-provoking, please give it a like! And let me know in the comments — do you see this as a true breakout or a trap in disguise?
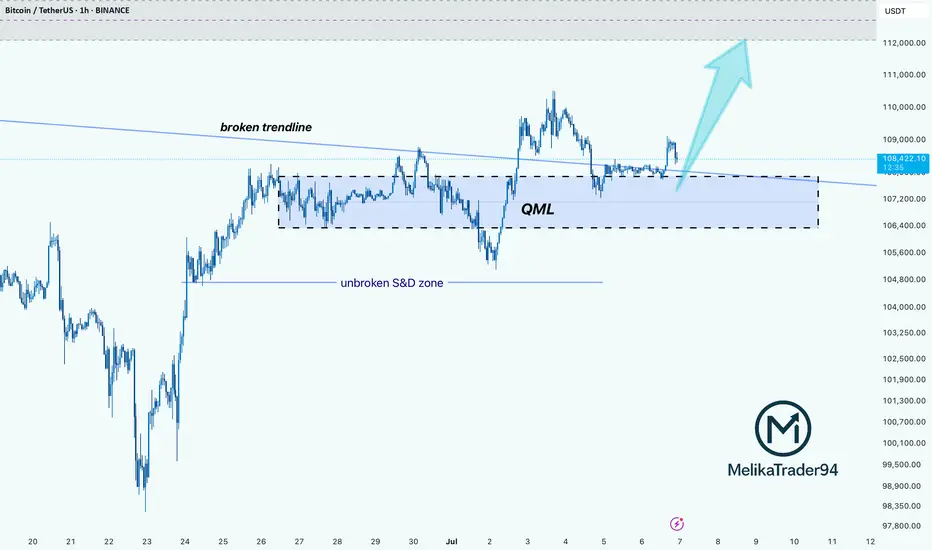
BTC: Demand Zone + QML + Trendline Flip = Perfect SETUPHello guys!
BTC is showing signs of a potential bullish reversal, forming a Quasimodo Level (QML) setup inside a valid S&D zone that remains unbroken despite multiple tests.
The downward trendline has been broken and is now acting as support, aligning perfectly with the QML and demand zone. giving us a solid confluence area.
Important to watch:
Rejection wicks and volume building at $106.6K–$107.4K zone show strong buyer interest.
If price can reclaim $109K and consolidate above, we could see a move toward $112K and higher.
Invalidation below $106.4K suggests the demand has failed, and bears may regain control.
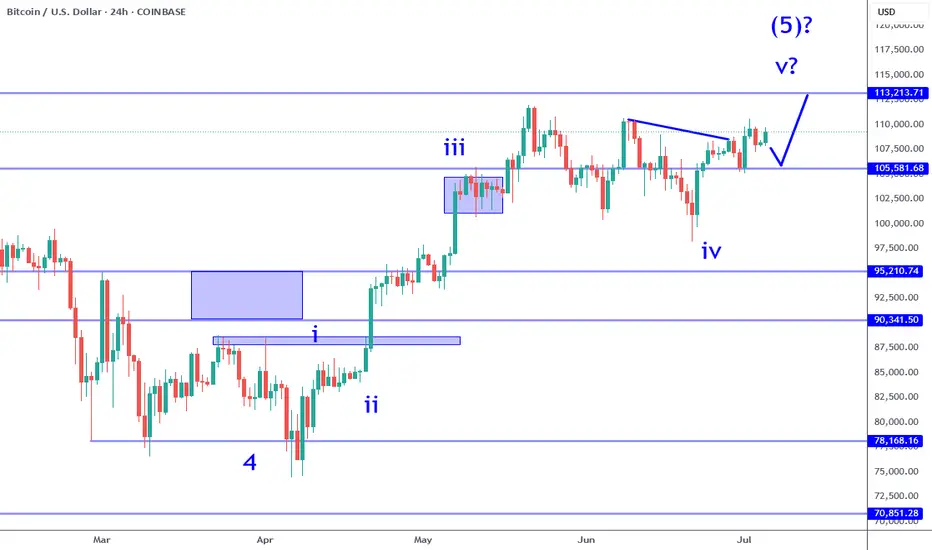
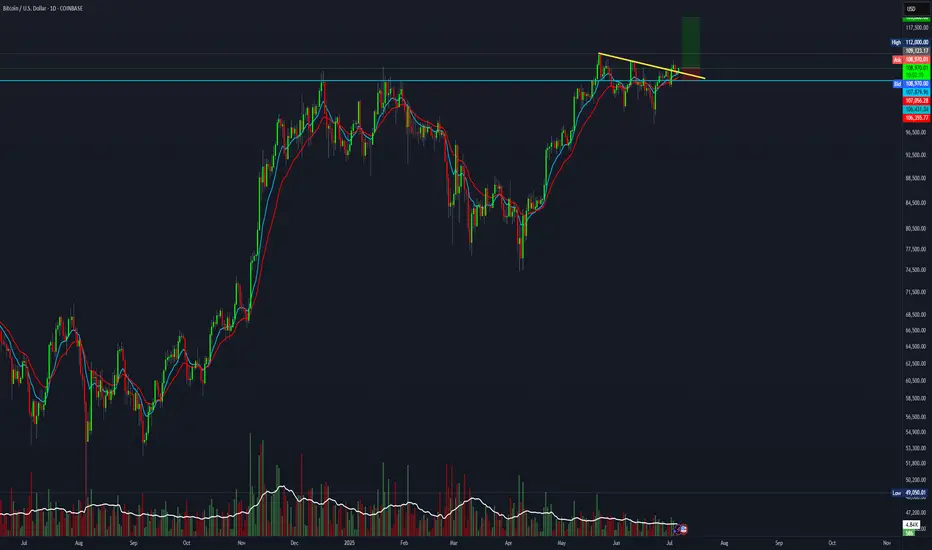
Bitcoin: Breakout To 113K Refuses To Pull Back.Bitcoin is poised to test the 113K resistance over the coming week. It has broken the upper trend line resistance and simply refuses to retrace in any meaningful way. With a continuously weakening dollar and other economic inflationary pressures, it will take a surprise negative catalyst to turn this around at least to the point of testing a high probability trend support on this time frame. Here is the way to play this environment:
Buying this breakout for time horizons longer than a swing trade requires a big risk tolerance. While this leg is likely to be the Wave 5 of 5 that I have been writing for some time and can see Bitcoin test some major new highs, investing here still puts you at the mercy of the market. The nearest support is around the 103 to 105K area at minimum and just not worth the risk in my opinion at current levels for INVESTING.
Swing trades are a great way to participate in the breakout continuation. Risk can best be defined by the current candle low or previous candle low. Profit objective now is 113K or 120K area. The Trade Scanner Pro actually called a long and offered numerous opportunities to enter over a week and a half ago. I have been reviewing this regularly on my live stream forecast every Monday at 3 PM ET. It helps immensely to have levels and risk defined for these type of situations in advance so that you know how to adjust your size.
Otherwise the optimal way to go about this is trade the smaller time frames. I will always suggest this near highs and breakouts on larger time frames. The reason is simple: risk can be tightly controlled. This requires some kind of rules or guidelines to judge the market, along with a way to confirm. Using the Trade Scanner Pro for example, the analysis component is easy: trend is bullish on all small time frames. This means you wait for a trade suggestion on the time frame that you regularly trade (1 min or 5 min f or example).
No matter what type of trend following system or rules you use, by aligning with the bigger picture and confirming a setup in some way is what puts the probabilities on your side. The smaller the time frame you operate, the more precise your risk management can be.
Thank you for considering my analysis and perspective.
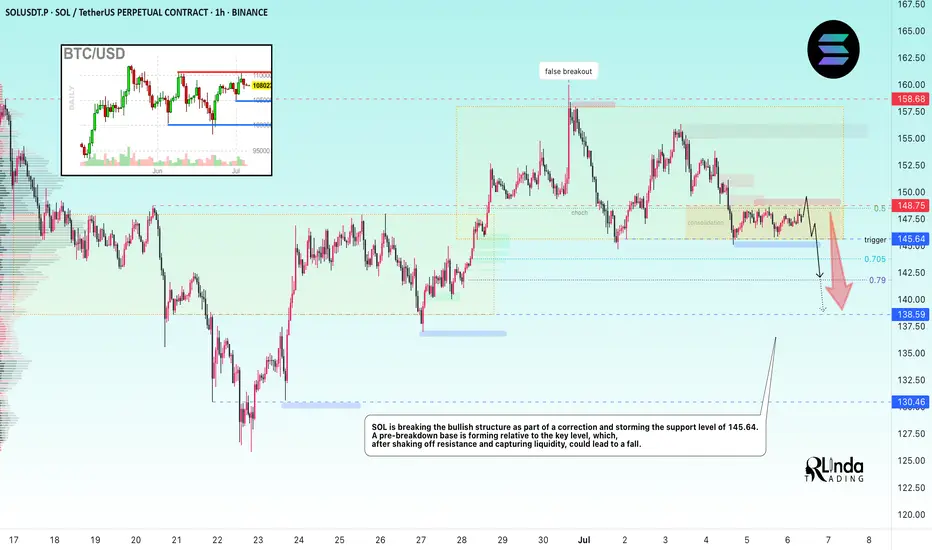
SOLANA → Pre-breakdown consolidation may lead to distributionBINANCE:SOLUSDT is declining and testing the support of the trading range as Bitcoin pauses after strong growth and enters a correction phase...
SOL looks a bit weaker than Bitcoin technically, but SOLANA has some positive fundamentals, though that might not be enough.
After forming a false breakout of key daily resistance, Bitcoin is moving into a correction phase. An update of local lows on the chart could trigger a drop across the entire cryptocurrency market.
In SOL, the focus is on the two nearest levels of 148.75 and 145.64. A breakdown of support could trigger the distribution of accumulated energy within the specified range as part of a downward momentum.
Resistance levels: 148.75, 151.2, 153.88
Support levels: 145.64, 138.59
The ideal scenario would be a false breakout of 148.75 (liquidity capture) and a retest of 145.64, followed by a break of support. Consolidation below 145.65 could trigger a drop to the zone of interest at 138.59.
Best regards, R. Linda!
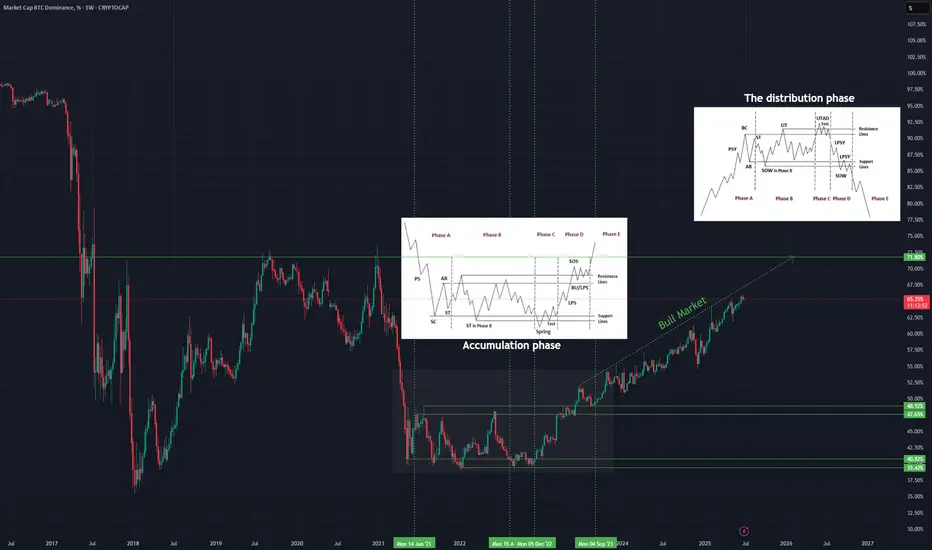
#BTC.D (BTC-DOMINANCE) - Cheat sheet#BTC-DOMINANCE
The asset has many strong features to achieve its goal.
This text does not contain recommendations on financial transactions or investments.
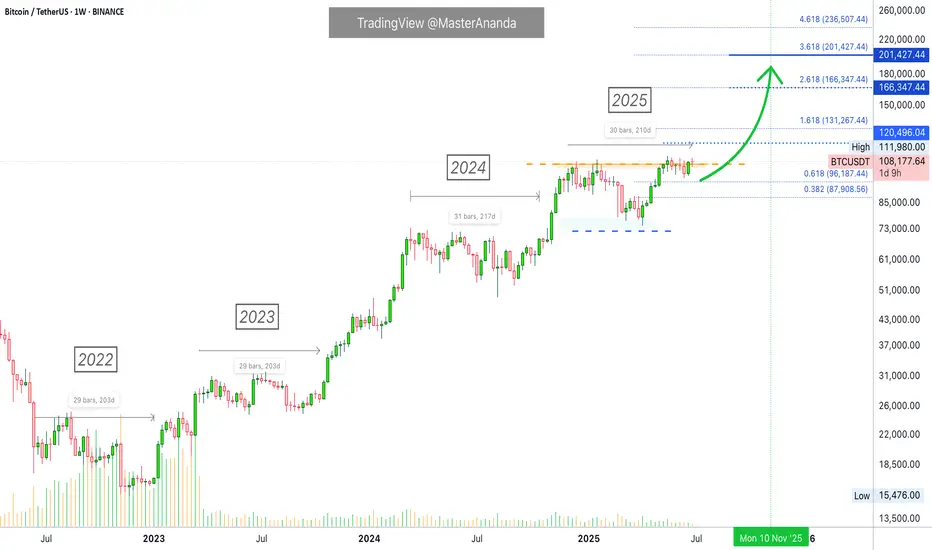
Bitcoin's Consolidation Almost Over —200-220 DaysBitcoin's consolidation period before a bullish breakout tends to last some 200-220 days on average. We have four instances of this pattern since the 2022 bear market counting 2025. Let's look at those. This proves that Bitcoin is set to grow in a matter of days. Continue reading below and make sure to boost. When you reach the end of the article leave a comment with your opinion about this issue. Do you agree? Do you disagree? Can you see what I mean?
» Back in 2022 Bitcoin consolidated for 203 days before a bullish breakout.
» Back in 2023 Bitcoin consolidated for 203 days before a bullish breakout.
» Back in 2024, last year, Bitcoin consolidated for 217 days before a bullish breakout.
It really depends on where you start counting for the total days but it all adds up to 200-220 days. With 220 being the maximum.
» Currently, in 2025, Bitcoin has been consolidating for 210 days. Looking at previous patterns, this means that only a few days are left before Bitcoin produces a bullish continuation.
We also saw that once Bitcoin breaks out of a this long-term consolidation range/period/phase, it never moves back to the lows of the consolidation range. That is, Bitcoin will never trade below 80K nor 90K once it resumes growing.
I am estimating that the next jump can start as early as next week. The entire move can take months to develop. After a peak is reached, Bitcoin will then start a new consolidation phase with a bearish bias first. This bearish bias produces a low after several months yet a strong higher low compared to the previous consolidation period which is current prices. After this low, more consolidation and then a new bullish jump.
If we take into consideration a bear market, then the dynamics can be different. Bear markets only happen once every four years. Seeing how different market conditions are now, the next bear market will be interesting because it won't be anything like the bear markets of the past. Bitcoin will remain much stronger but that is an analysis for another time.
Summary
Bitcoin is going up. It is very close now. When Bitcoin breaks up and hits a new all-time high, just to continue growing, the altcoins market will explode. You've been warned.
Now you can leave your comment.
Share your opinion on the comments section below. I know you have something to say. You've been trading Cryptocurrencies for years, buying and selling, making profits so... Are you ready for the 2025 bull market?
Thank you for reading.
Namaste.
BTC - Bulls Getting Ready!!Hello TradingView Family / Fellow Traders. This is Richard, also known as theSignalyst.
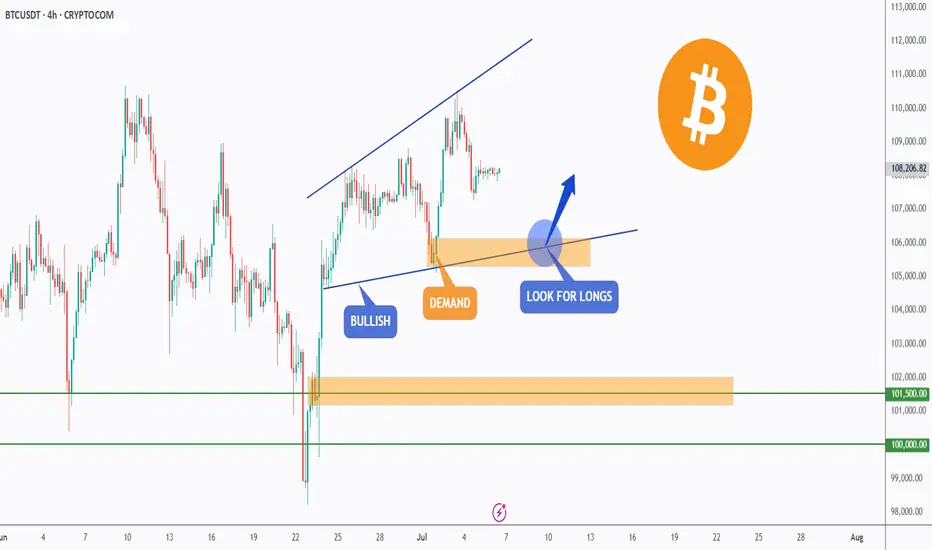
📈BTC has been bullish trading within the flat rising wedge marked in blue and it is currently retesting the lower bound of the wedge.
Moreover, the orange zone is a strong demand.
🏹 Thus, the highlighted blue circle is a strong area to look for buy setups as it is the intersection of demand and lower blue trendline acting as a non-horizontal support.
📚 As per my trading style:
As #BTC approaches the blue circle zone, I will be looking for bullish reversal setups (like a double bottom pattern, trendline break , and so on...)
📚 Always follow your trading plan regarding entry, risk management, and trade management.
Good luck!
All Strategies Are Good; If Managed Properly!
~Rich
Volatility period likely to continue until July 11th
Hello, traders.
Please "Follow" to get the latest information quickly.
Have a nice day today.
-------------------------------------
This volatility period is expected to last until July 11th.
The first volatility period, July 1-7, 3 days passed, and the second volatility period began on July 6.
It is important to explain it in words, but I think it would be better if you could intuitively understand the flow by looking at the chart.
For that reason, I divided the chart into a chart with a trend line drawn and a chart with indicators.
Since the trend line is used as a tool to calculate the volatility period, it is not necessary to show it after the volatility period is displayed.
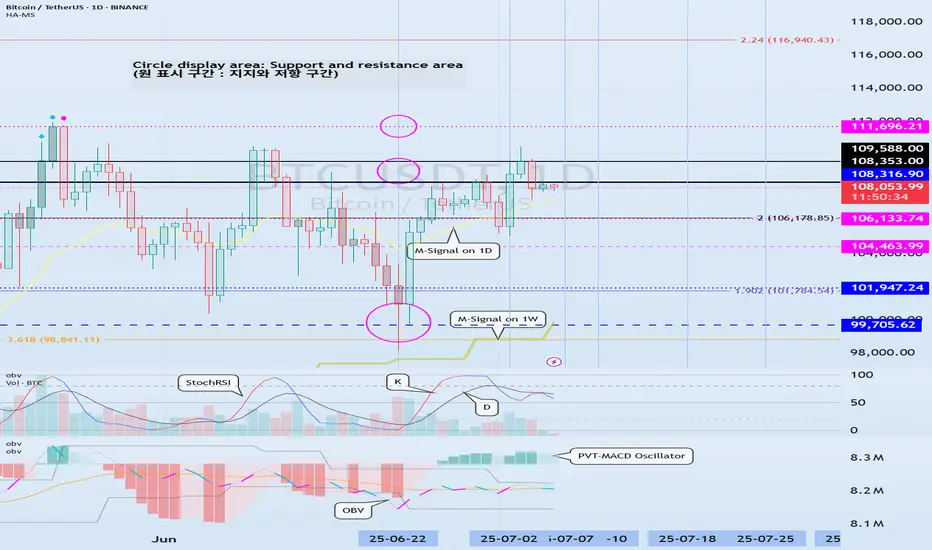
What we need to look at is the support and resistance points drawn on the 1M, 1W, and 1D charts after the calculated volatility period, or the support in the indicator to find the trading point.
-
It seems that support is being checked around 108316.90, which is the HA-High indicator point of the 1D chart.
Therefore, we need to see if it can rise after receiving support near 108316.90 during this volatility period.
If not, it will eventually show a downward trend.
As a basic trading strategy, we use buying near the HA-Low indicator and selling near the HA-High indicator.
Therefore, considering the current price position, it can be said that it is a section where we should sell to make a profit.
However, since the HA-Low and HA-High indicators are intermediate values, if it falls from the HA-Low indicator, it is possible to show a stepwise downward trend, and if it rises from the HA-High indicator, it is possible to show a stepwise upward trend.
Therefore, we need to respond with a split transaction.
Conditions for continuing the uptrend include:
1. When OBV is above the High Line and shows an upward trend,
2. When PVT-MACD oscillator is above the High Line,
3. When StochRSI is above K > D, showing an upward trend,
If the above conditions are met, there is a high possibility that the uptrend will continue.
-
If it falls below the M-Signal indicator on the 1D chart, it is highly likely that it will select the trend again when it meets the M-Signal indicator on the 1W chart.
At this time, whether there is support near 99705.62 is important.
If it rises, you should check whether it is supported near 111696.21.
If it is not supported, it means that it has not broken through the high point section, so you should prepare for a decline.
The high point boundary section is the 108316.90-111696.21 section.
Therefore, if the price is maintained within this section, there is a possibility that it will continue to attempt to break through upward.
-
Thank you for reading to the end.
I hope you have a successful trade.
--------------------------------------------------
- Here is an explanation of the big picture.
(3-year bull market, 1-year bear market pattern)
I will explain more details when the bear market starts.
------------------------------------------------------
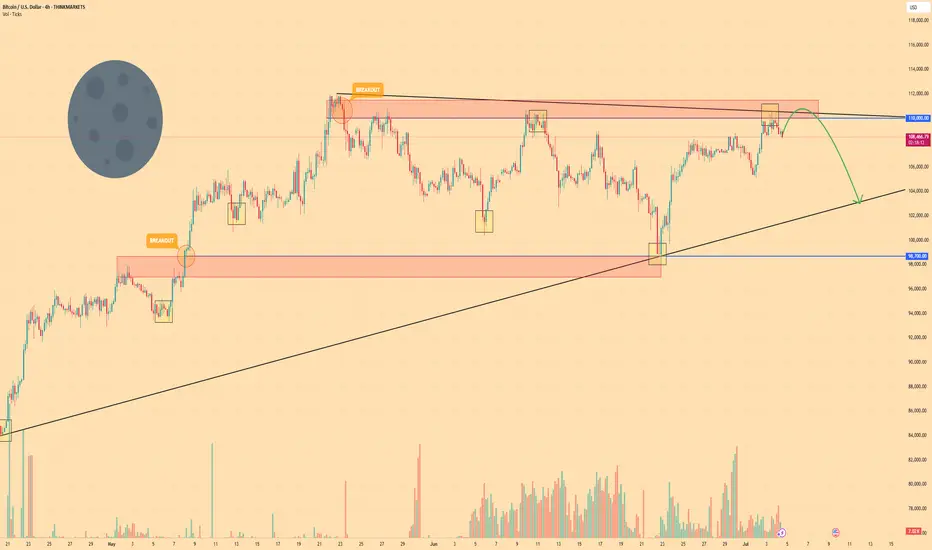
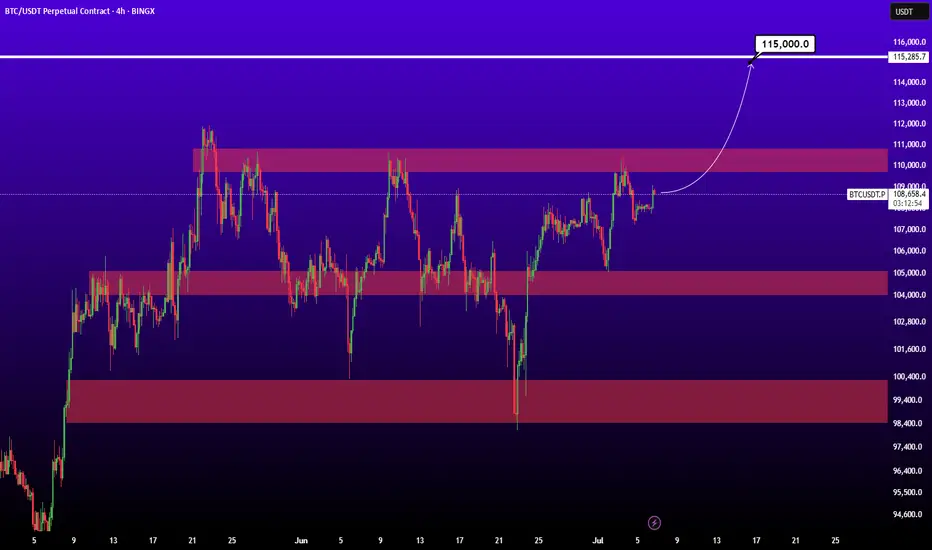
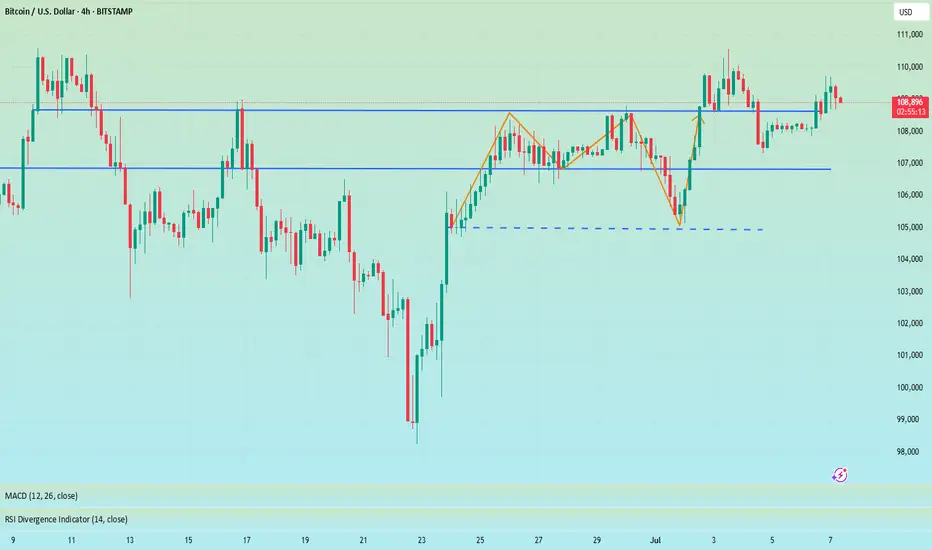
BITCOIN - Price can drop from resistance area to $103000Hi guys, this is my overview for BTCUSD, feel free to check it and write your feedback in comments👊
Some days ago, price entered a pennant pattern, where it at once made an upward impulse from support line.
Then the price reached $98700 level and soon broke it, after a small correction, and then continued to move up.
Later BTC rose to the resistance line of the pennant, but soon turned around and started to decline, breaking $110000 level.
Price little corrected and then tried to bounce back and failed, after which it fell to $98700 level and then started to grow.
In a short time, BTC rose to a $110000 resistance level and tried to break it again, but recently turned around and started to fall.
Now, I expect that BTC can grow to the resistance area and then drop to $103000 support line of the pennant.
If this post is useful to you, you can support me with like/boost and advice in comments❤️
Disclaimer: As part of ThinkMarkets’ Influencer Program, I am sponsored to share and publish their charts in my analysis.
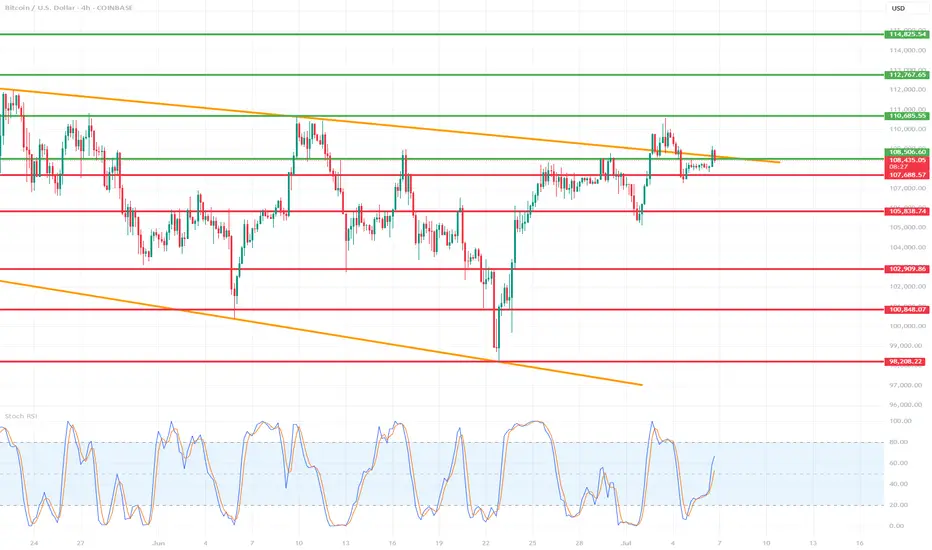
Is BTC getting ready for a new ATH?🔍 1. Key Support and Resistance Levels (Horizontal Lines):
🟢 Resistances (Green Lines):
114,295.54 — strong resistance resulting from previous highs.
112,767.65
111,009.00
110,685.35 — current key level that price may try to retest after a potential breakout.
🔴 Supports (Red Lines):
108,496.55 — current level being tested, also coinciding with local resistance from the past.
107,687.57
105,888.74
102,909.85
100,848.07
98,208.22 — strong long-term support; in the past, this level was reacted with a strong bounce.
🔶 2. Downtrend channel marked with orange lines:
The upper downtrend line acted as resistance.
The lower uptrend line acted as support.
The price recently broke above the upper line, but is now testing it again - this could be a retrospective retest.
➡️ If the close of the H4 candle is above this line - a possible confirmation of the breakout.
📊 3. Stochastic RSI indicator (at the bottom of the chart):
Currently in the uptrend phase after a bounce from the oversold level (<20).
The %K line (blue) is crossed upwards by the %D line (orange) - a bullish signal.
Still below the overbought zone, which suggests that the potential uptrend still has room to develop.
🧠 4. Market structure and price action:
Price broke above the 108.496 level, but is currently struggling to stay above this zone.
A retest of the broken triangle could be a healthy move, provided that support is maintained in the 108k–107.6k area.
A break below and a close below 107.6k could mean a false breakout and a possible decline towards 105.8k or even 102.9k.
🧭 5. Possible scenarios:
✅ Bullish scenario:
Maintaining the 108.496 level and closing the candle above the upper orange line → continued growth.
The nearest targets are:
110.685 (first resistance),
111.009 and 112.767 next.
❌ Bearish scenario:
The price will not stay above 108k and will fall below 107.687.
Possible return to the previous consolidation range with the target:
105.888,
and then 102.909 or 100.848.
🧮 Summary:
Currently, the decisive moment is underway: a test of support after breaking out of the convergent triangle.
The Stoch RSI indicator gives a bullish signal, but the price must confirm the movement by behaving above 108k.
Retest and bounce - this is a bullish scenario.
A breakdown and return under the trend line - means that the breakout was false.
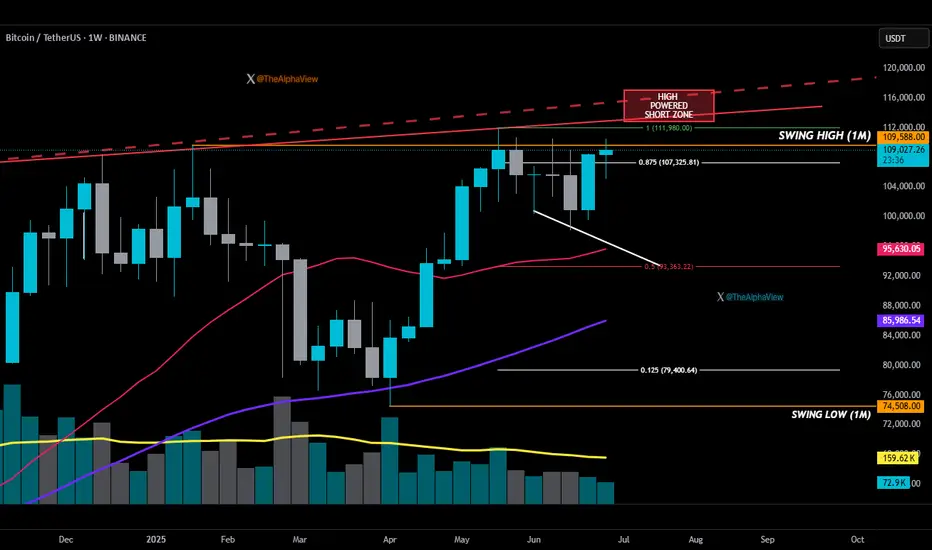
BTC-HIGH-POWERED SHORT ZONEAs you can see, the Volume Moving Average (YELLOW LINE) has been steadily declining ever since that sharp move up back in April. That’s not bullish behavior—it’s a warning. This week ENDING ON THE 13TH, Bitcoin must close above the monthly swing high (Top ORANGE LINE) if the bulls want any shot at locking in a green monthly candle.
Now, here’s the part most miss: if price breaks below the 0.875 GANN level (Top WHITE LINE), odds spike for a retracement toward the 0.5 GANN level (Middle RED LINE). Conveniently—that area also aligns with both the 20 SMA (PINK LINE) and the 50 SMA (PURPLE LINE). That’s your confluence zone. It’s a great spot to exit any shorts and reassess the battlefield.
I’ve been in a short from around the $108K mark for weeks. BTC is strong as long as it holds above the 0.5—and I’m still calm above the 0.125 GANN level (Lower WHITE LINE). Panic only creeps in if we break the monthly swing low (Bottom ORANGE LINE).
Now, if by some miracle the bulls rip through the all-time high, I’ll happily add to my short in the HIGH-POWERED SHORT ZONE (RED BOX). That’s where overconfidence meets resistance.
THIS IS NOT FINANCIAL ADVICE. I’M JUST A GUY ON X… DO YOUR OWN RESEARCH!
👉 FOLLOW ON X: @tHEaLPHAvIEW
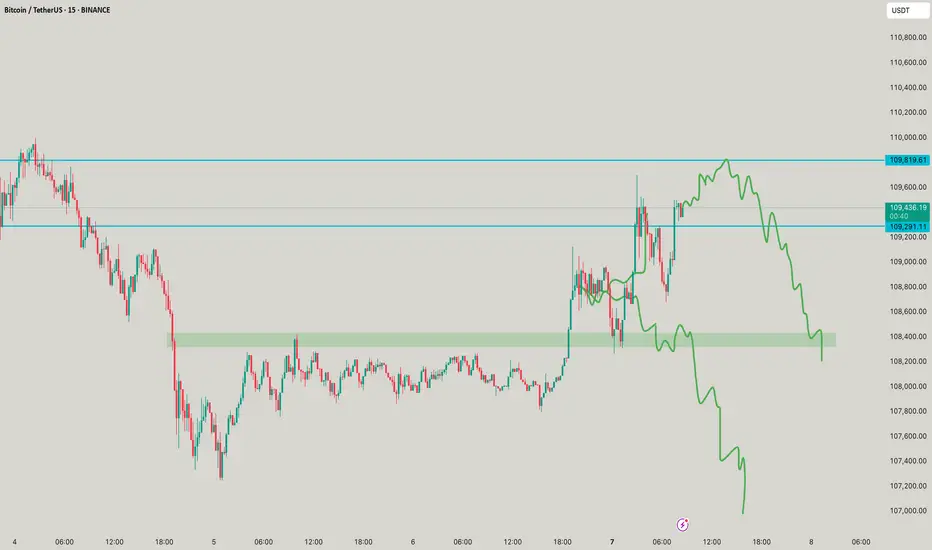
BTC - Fly High or Just Nuke down?As depicted earlier in the earlier drawing, 109,850 and now little bit more push to fall it down!
BTC setup with a 3.9 risk-to-reward ratio.Is BTC beginning a bullish move toward 120K?
This setup offers a 3.9 R:R with an
Entry at 109,000
Stop loss at 106,355
Target 120,000
Not financial advice.
Bitcoin BTC Trade Plan: Watching for Breakout or Pullback Entry📊 Currently watching BTC (Bitcoin) as price action remains bullish overall, but we're approaching a key decision point 🎯
💹 Price is pushing higher, but with some signs of exhaustion after the recent rally ⚠️ — and with the weekend approaching, we could either see a continuation higher or a healthy pullback
I’m keeping an eye on two potential trade scenarios:
1️⃣ A break and clean retest of the recent high, which could offer a continuation long if momentum follows through 🚀
2️⃣ A retracement into equilibrium — a deeper pullback toward fair value 📉 — which could also present a high-probability long setup if confirmed with structure and reaction 📈
Either way, I’m letting the market reveal its hand and waiting for one of these setups to play out before committing 💡
💬 Not financial advice — always assess your own risk and confirm with your own analysis.

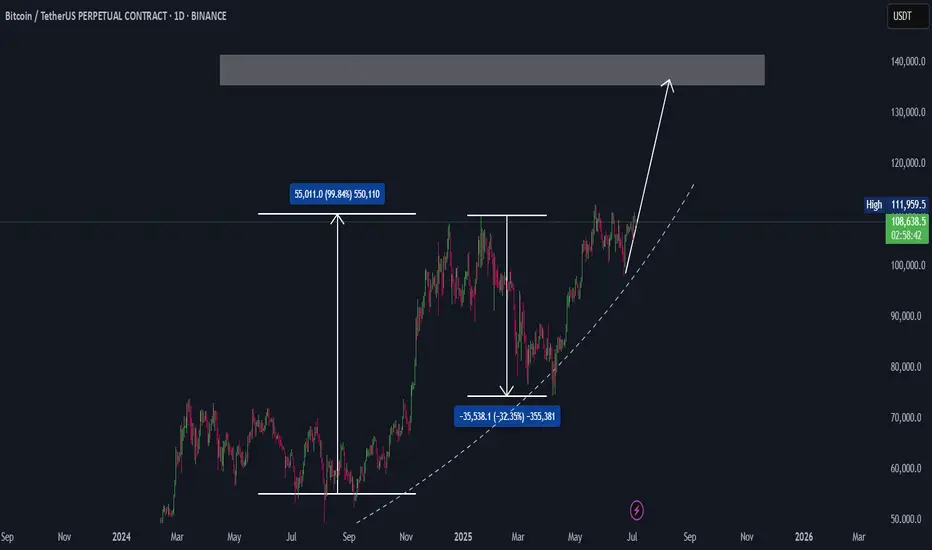
BTC bullish sentiment and All time highs?BTC is printing a good structure and characteristics resembling the highs of 2021. 2025 is the only bullish year left before BTC crashes again.
Usually BTC is bullish in the end of the year. This OCT/NOV could print 130K-136k for btc before a fatal crash
BTCUSDTWait for breaked ATH for 115K target.
BINANCE:BTCUSDT.P
Now price is in two level trading renge but come entry volume of buyers.
BTC - Channel is Broken, Now What?
The most bullish scenario right now is that the price stays in the upper part of the channel, tests the top of the channel and continues to rise.
If this breakout in BTC remains a manipulation, the price may also make the same manipulation downwards. When the price breaks through, my first thought is that it may find support at the midpoint of the channel, but this is a low probability. The higher probability is that it will make the same manipulation downwards and then re-enter the channel.
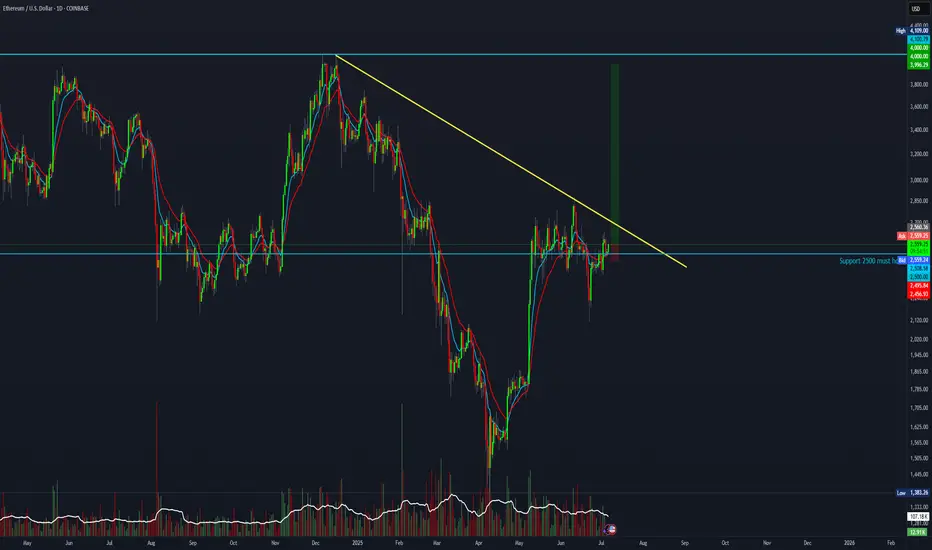
Ethereum setup with a 14 R:R.Let’s see if this time marks the beginning of bullish momentum.
This setup offers a 14:1 risk-to-reward ratio
Entry at 2560
Stop loss 2457
Target at 4000.
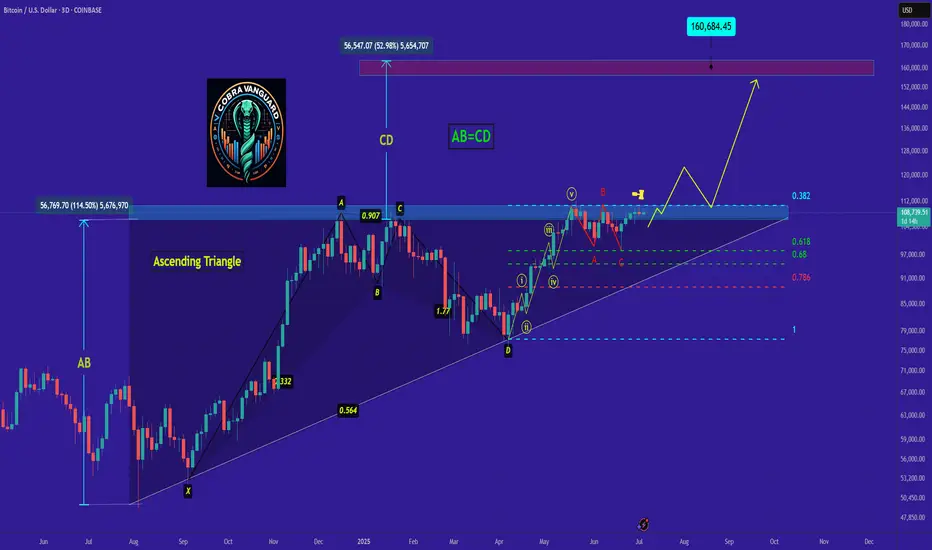
BTC's Situation, A Comprehensive Analysis !!!Bitcoin is now at a point where it cannot be ignored! In my view, the bullish wave has started after the corrective wave ended. This wave could continue until it breaks the ascending triangle, then with a slight correction, push the price upward again. The current period and the coming days could be crucial in determining the market's trend.
Best regards CobraVanguard.💚
7.7 Analysis of the latest BTC trend and operation layout📊 Cautious wait-and-see strategy (Recommendation index ⭐️⭐️⭐️⭐️⭐️)
📰 News information:
1. Digital Market Asset Transparency Act
2. Anti-CBDC Regulation Act
3. US Stablecoin Innovation Act
📈 Technical Analysis:
At present, the price of BTC is around 109,000, and the overall narrow fluctuation pattern continues. The market as a whole lacks clear direction. However, it is worth noting that the trading volume has dropped to 30.1 billion US dollars, which has further shrunk compared with the previous day, reflecting a decline in market participation.
In my opinion, the driving factors of the market include the following:
1. The continued activity of ancient whales has attracted attention
2. The technical side shows that the momentum is weakening
3. Market sentiment has turned neutral
4. ETF fund inflows remain strong
5. The "Crypto Week" policy catalyst is coming
Currently, BTC continues to consolidate within the upward trend line, but the momentum indicator shows fatigue, the 4H Bollinger Bands shrink, and the price is running near the middle track of 108,400. Enter the market cautiously during the day and pay attention to the support of 107,000
🎯 Trading Points:
SELL 109,000-110,000
TP 107,500-107,000
In addition to investment, life also includes poetry, distant places, and Allen. Facing the market is actually facing yourself, correcting your shortcomings, facing your mistakes, and being strict with yourself. I share free trading strategies and analysis ideas every day for reference by bros. I hope my analysis can help you.
BITSTAMP:BTCUSD
#BTC Update #4 – July 7, 2025🟠 #BTC Update #4 – July 7, 2025
Bitcoin has been trading inside a supply zone , and its last impulsive move happened right into that area. While it tried to push higher again, I now see signs of rejection.
If this rejection holds, the first level I’m watching is $107,850 . Below that, there's a key support around $106,350 . Should this level break, we could see a deeper drop toward $102,650 , where an imbalance zone remains untested.
At the moment, short setups look more reasonable than longs but from a risk/reward perspective, I don’t see enough edge to take action yet. So for now, I’m not entering any position and will simply watch BTC’s next move .
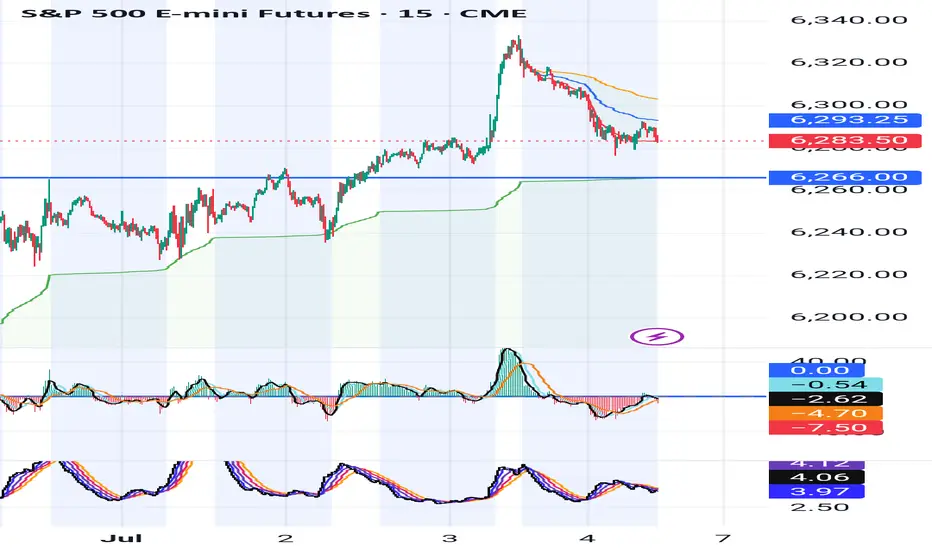
ES, SPY, SPX will be testing key support on Sunday After a welcome rally into new highs for the s&p, there appears to be a critical crossroad forming. Using the ES continuous contract I have placed 2 anchored VWAP's. The first being anchored to the last higher low on Thursday, June 19. And the the second, being anchored to this last Thursdays high on July 3rd.
For this post we will call the anchor from June 19 - VWAP1. And for the July 3rd anchor - VWAP2
VWAP1 r1 has acted as a key support line since the higher low was set. Successfully bouncing and holding support several times.
As we headed lower on this Thursdays July 3rd session, we remained between the center and r1 of VWAP2 indicating strong selling pressure for the day. With it being a shortened trading day with less liquidity however, I have less concern over the days price action. The forming crossroads and the upcoming Sundays open will be more telling for where we likely head this week.
The blue Horizontal Line at 6266 is placed directly on VWAP1s r1 (green line) which has acted as support. If we trade into this level on the Sunday open, it's a clear signal the sellers are still in control. If however, price can consolidate at that level (6266) and form structure, a breakout of the structure would be evidence of sellers backing off and buyers stepping in creating a good buying opportunity for the week.
Another possible scenario, if we first manage to trade up into s1 of VWAP2 (orange line) around the 6300 level, I will be looking for a short scalp down to the r1 of VWAP1 at 6266. From here it would be prudent to sit and wait for more confirmation on if this is a reversal, or just another pullback in the uptrend.
These are my two trade setups and ideas for Sunday's open. Hope this analysis helps. Happy trading 🤙💰📈