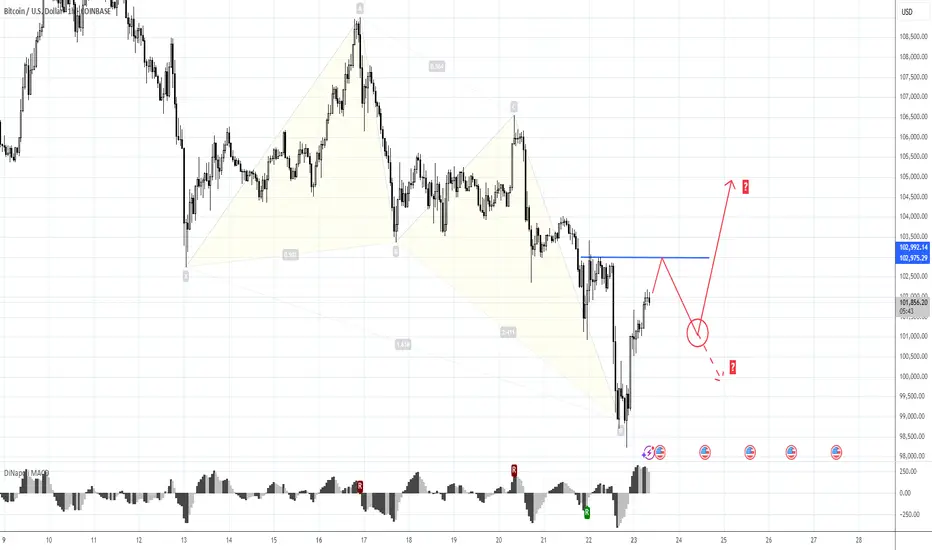
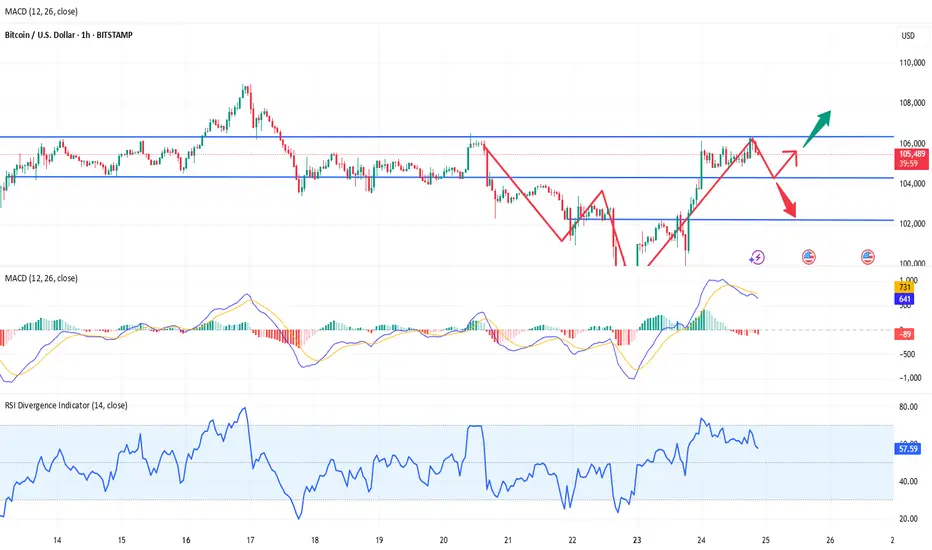
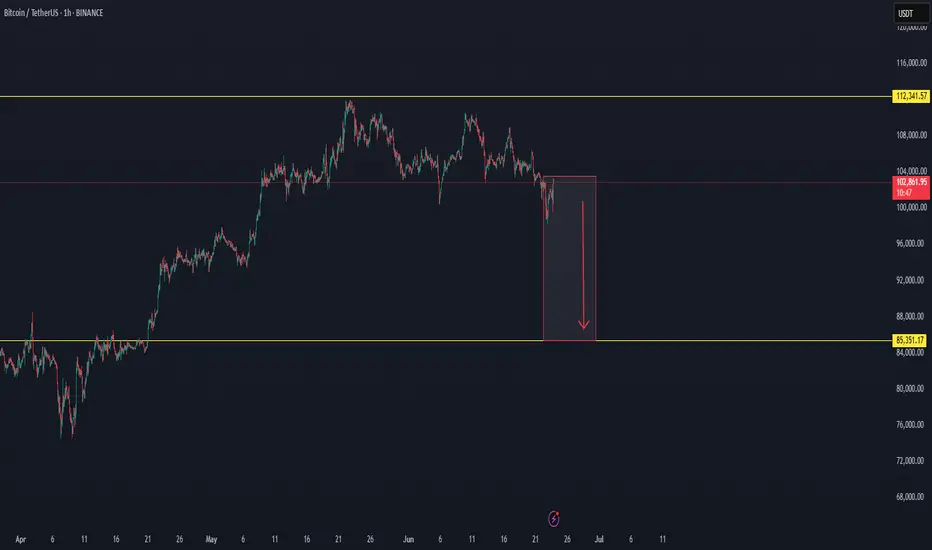
103 to 101K trade and reverse H&S patternMorning folks,
So, our Thu setup is done perfect, both targets are met and even more. Now we consider two different fast trades on BTC.
Now context remains bearish and 103K is rather strong 4H resistance area. So, first trade is scalp "Sell" from ~ 103K with "at least" target of 101K. In fact, choosing of 101K as a minimal target is based on the 2nd trade.
2nd trade is potential reverse H&S is sentiment on the market will start changing. But this is not the fact yet. That's why I place downside arrow here as well, if H&S will not be formed or start failing, BTC could drop lower so, downside trade might be even better.
BTC-M
Bitcoin Reclaims Momentum: War Fears Fading, Bulls Eye $125K! MARKETSCOM:BITCOIN just delivered a powerful bounce right off the critical $100K level. A key psychological and technical support zone tested multiple times in recent sessions. This time, the bounce came with strong volume confirmation, signaling renewed buyer interest. As geopolitical tensions in the Middle East begin to ease, market confidence is returning, fueling bullish sentiment across the board.
CRYPTOCAP:BTC now looks poised to retest the $110K resistance zone, where some short-term rejection could occur. However, a decisive breakout above $110K opens the gates for a potential rally toward the next major target at $125K. Stay sharp, always manage your risk, and don’t forget to set a proper stop loss. The trend is strong, and momentum is building!
Follow Our Tradingview Account for More Technical Analysis Updates, | Like, Share and Comment Your thoughts
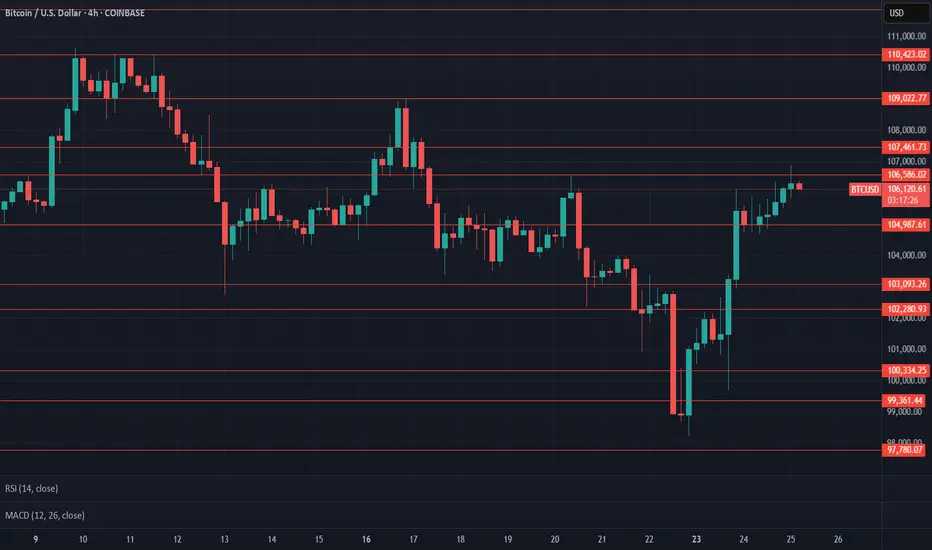
$BTC Update CRYPTOCAP:BTC #BTC $106,586 resistance in effect and testing as of now, $104,987 current support. $103,093 key support from here, $107,461 support required to reattempt taking $110,423. Dropping volume on 1D, Previous daily closed trying to follow thru on a bullish engulfing from Monday's close, current 1W looking massive good but it's just the beginning of the week - Watch given S/R.
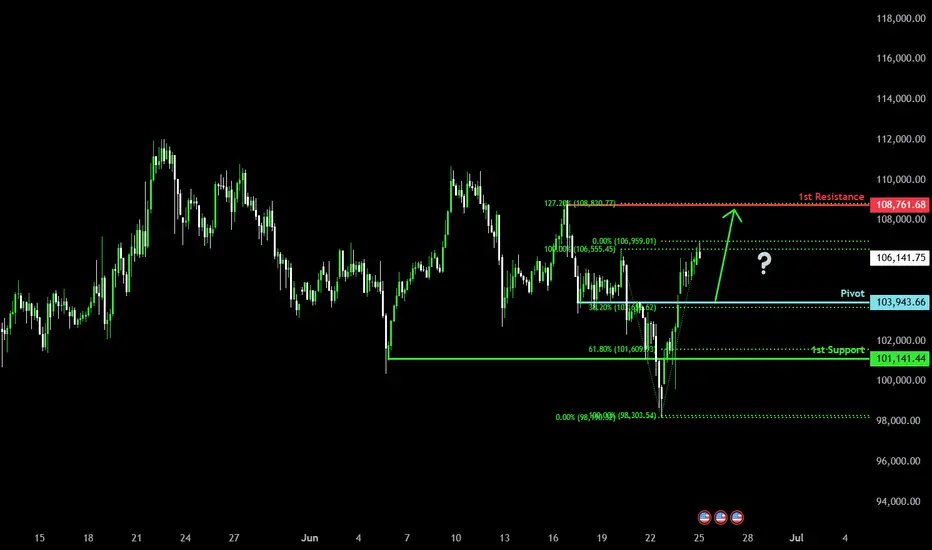
Bullish bounce?The Bitcoin (BTC/USD) is falling towards the pivot and could bounce to the pullback resistance.
Pivot: 103,943.66
1st Support: 101.141.44
1st Resistance: 108,761.68
Risk Warning:
Trading Forex and CFDs carries a high level of risk to your capital and you should only trade with money you can afford to lose. Trading Forex and CFDs may not be suitable for all investors, so please ensure that you fully understand the risks involved and seek independent advice if necessary.
Disclaimer:
The above opinions given constitute general market commentary, and do not constitute the opinion or advice of IC Markets or any form of personal or investment advice.
Any opinions, news, research, analyses, prices, other information, or links to third-party sites contained on this website are provided on an "as-is" basis, are intended only to be informative, is not an advice nor a recommendation, nor research, or a record of our trading prices, or an offer of, or solicitation for a transaction in any financial instrument and thus should not be treated as such. The information provided does not involve any specific investment objectives, financial situation and needs of any specific person who may receive it. Please be aware, that past performance is not a reliable indicator of future performance and/or results. Past Performance or Forward-looking scenarios based upon the reasonable beliefs of the third-party provider are not a guarantee of future performance. Actual results may differ materially from those anticipated in forward-looking or past performance statements. IC Markets makes no representation or warranty and assumes no liability as to the accuracy or completeness of the information provided, nor any loss arising from any investment based on a recommendation, forecast or any information supplied by any third-party.
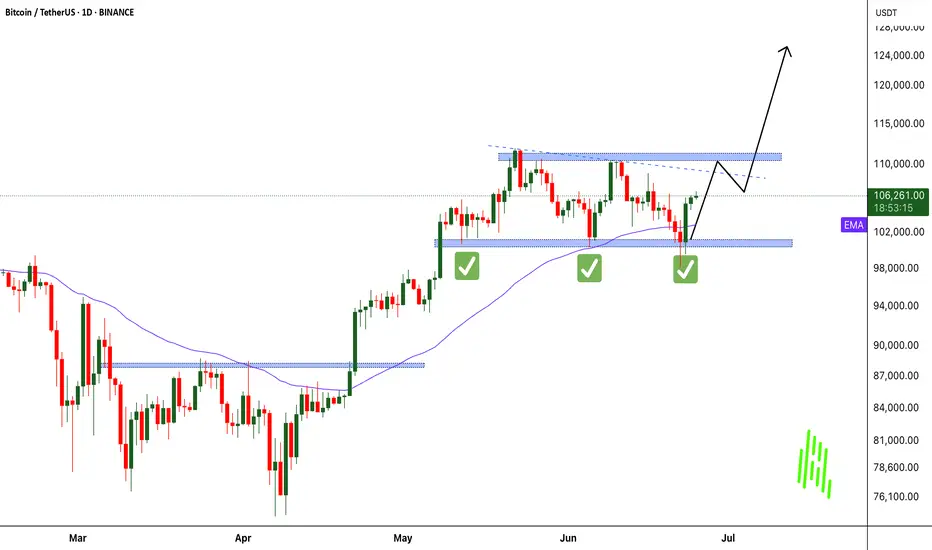
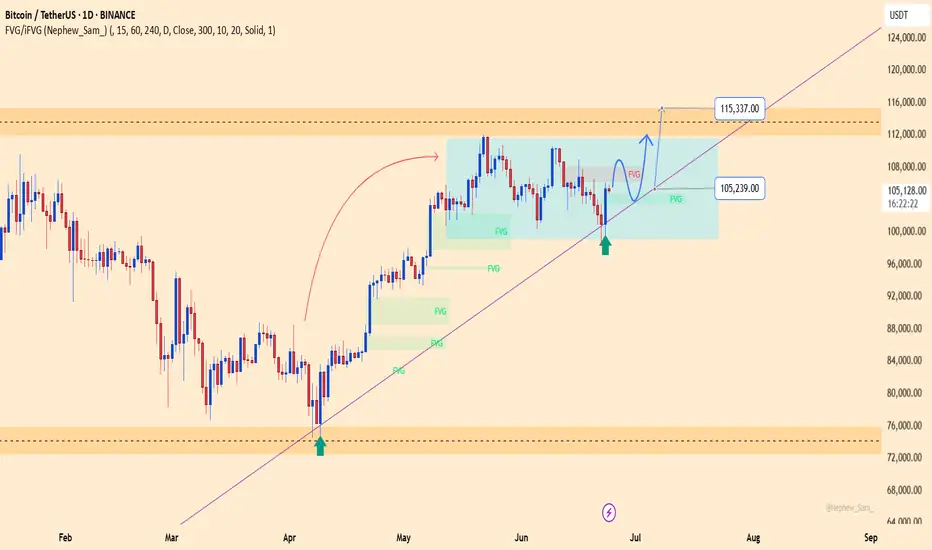
BTCUSDT – Rebound from trendline, targeting 115,300On the daily chart, BTCUSDT has bounced from a confluence support zone around 105,200, where the rising trendline meets the FVG, confirming that the bullish structure remains intact. The current price pattern suggests a continuation of the uptrend, with a short-term target at the 115,300 resistance zone — a level that has previously rejected price multiple times.
If this level is broken, momentum could extend toward the 120,000 area in the medium term. As long as the price holds above the trendline, the bullish outlook remains valid.
On the news front, market sentiment is improving as Bitcoin spot ETFs in the U.S. show signs of renewed inflows, coupled with growing expectations that the Fed might pause rate hikes due to recent signs of economic weakness.
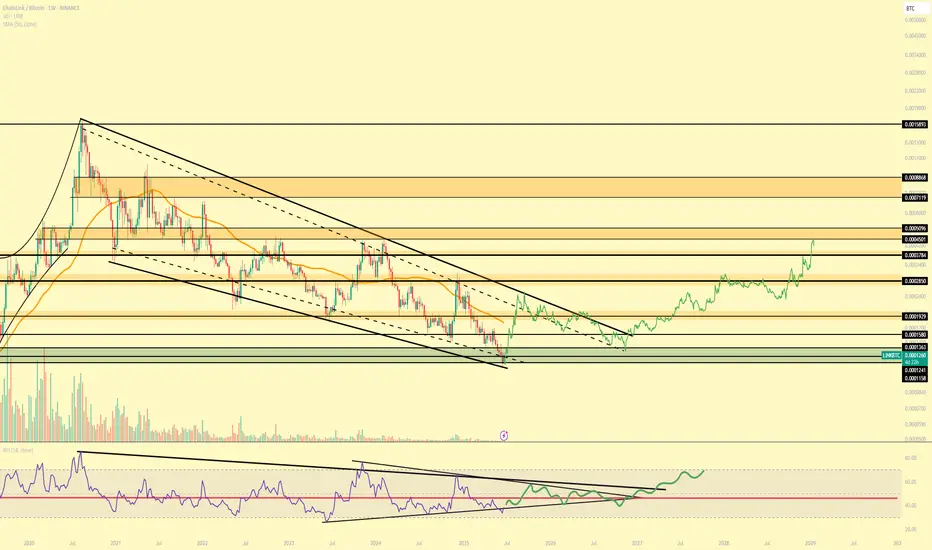
LINKUSD Paths on OfferPretty clear accumulation stages going on and so I am inclined to think we head towards the Bullish path to ~$100
Bears will want to buy LINK at massive discounts and so perhaps we do see some capitulation before our next mark-up phase.
However, the current Total Market cycle patterns, along with the BTC pairing, almost rule out the possibility of further downside, or at least major downside.
LINK / BTC Looking Juicer Than EverEven if you aren't aware of the fundamentals of LINK adoption & application , the chart speaks for itself.
Would be very surprised is LINK isn't bottoming out here and all it needs is a bit of sideways before we get some expansion and mark-up.
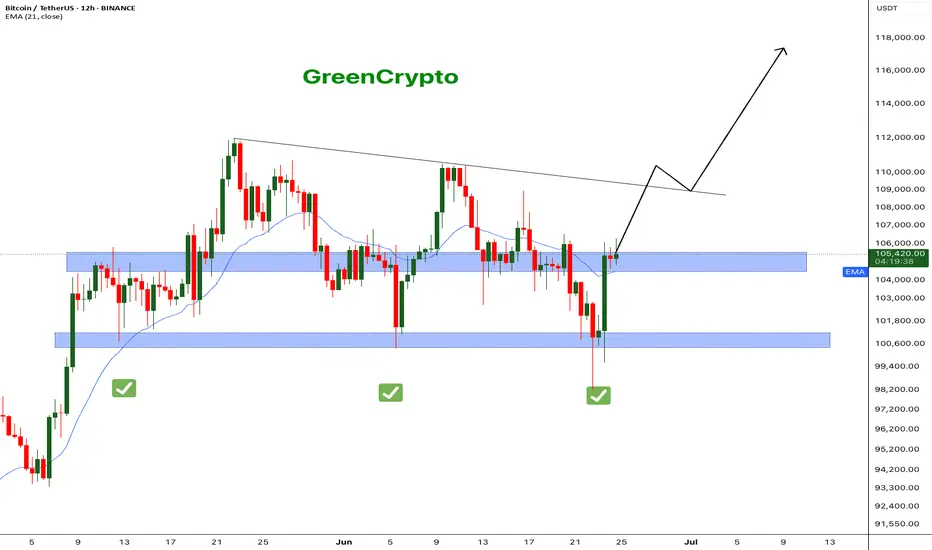
symmetrical triangle in progressBitcoin has been consolidating at this level for several weeks, easing some of the pressure in order to push above 120K. As of today, we have a clear formation—a large symmetrical triangle—which confirms the continuation of the upward trend and rules out any possibility of returning to lower levels.
Bitcoin - What's next ? BINANCE:BTCUSDT (12H CHART) Technical Analysis Update
Now that ceasefire is announced, bitcoin price has successfully recovered to the resistance level and currently trading at the resistance zone. It's critical that bitcoin breaks this resistance for it to hit the next resistance around 110K .
I'm expecting price to reach 110k this week and we can see some consolidation in that range before moving further up.
Follow our TradingView account for more technical analysis updates. | Like, share, and comment your thoughts.
Cheers
GreenCrypto
BTC is expected to retreat in the short term, focus on 104500📰 Impact of news:
1. The ceasefire agreement reached earlier did not take effect, and Trump believed that both sides violated the agreement
2. Federal Reserve Chairman Powell delivered a speech 3 hours later
📈 Market analysis:
I haven't updated BTC for a while. Today I want to share my views on BTC with you. BTC is currently encountering resistance and pressure at the 106,000 level and is beginning to retreat. From the technical indicators, MACD is in a dead cross, and RSI is retreating after reaching the overbought area. There is no problem with the short-term bearish trend, and it is expected that it will be able to retreat to the 104,500 level without much problem. However, the recent decline in the gold market, DXY market, and crude oil market may cause funds to flow into the BTC market.
🏅 Trading strategies:
SELL 106000-105500
TP 105000-104500
BUY 140500-103500
TP 105000-106000
If you agree with this view, or have a better idea, please leave a message in the comment area. I look forward to hearing different voices.
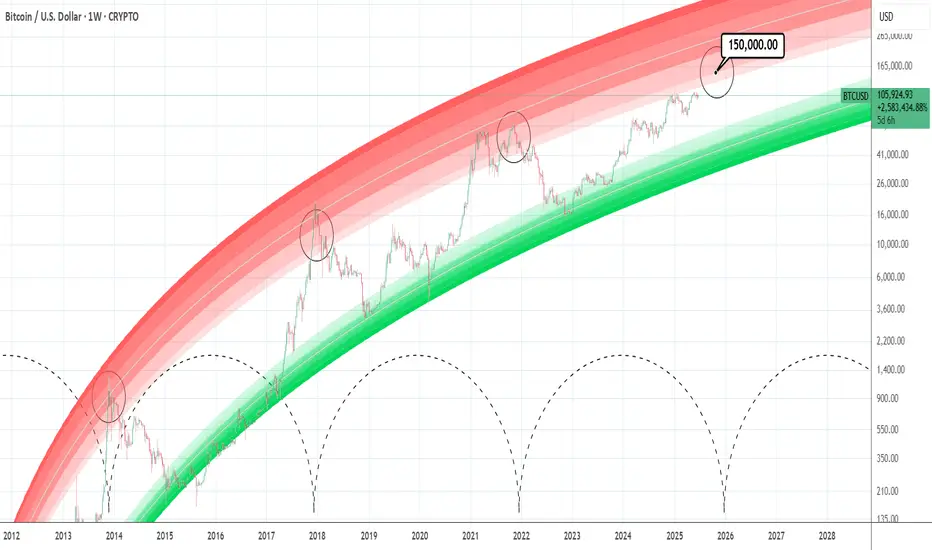
BTCUSD: Minimum target for this Cycle is 150,000Bitcoin turned neutral again on its 1D technical outlook (RSI = 52.882, MACD = -410.600, ADX = 22.509) as it recovered the losses of the last 2 days thanks to the Truce announcement between Israel and Iran. The long term picture couldn't be more bullish however as it hasn't even hit the bottom red zone of the Logarithmic Growth Curves model. According to the Time Cycles that mark each Cycle High, the Top for this Cycle is estimated to be between October and December. By October 2025, the top of the first profit taking zone (lightest pink) would be $150,000. That is technically the bare minimum of Top that should be expected based on the current LGC model. Technically it can even hit $200,000 but fundamentals have to help a lot in this scenario (adoption, ETFs, rate cuts).
## If you like our free content follow our profile to get more daily ideas. ##
## Comments and likes are greatly appreciated. ##
Bitcoin Recovers...What we've learned in the past few years is that Bitcoin's demand is just too strong. Retraces and corrections are no longer wild like before, these are limited and capped. Nobody wants to take the risk of selling too much and being left out or losing their Bitcoins for good, they are just too valuable. Many times more valuable than the USD Dollar or Gold. It is the most valuable asset in the whole digital world.
Other than food and toilet paper, nothing is more valuable than Bitcoin.
Technical analysis
Ok, let's focus on the chart.
The retrace has been ongoing for 31 days, since 22-May.
Total drop amounts to 12.33% (-12%).
The action moved below the 5-June low around $100,400. Bitcoin is now back above this level. Clearly showing that this is a stop-loss hunt event.
Stop-loss hunt and liquidity hunt because thousands, if not millions, of over-leveraged traders have been liquidated. They were betting on the wrong side short-term. Long-term yes, bullish is the trend, the direction and the win. Short-term, it was SHORT but not anymore.
Never trade with 20X that's crazy. Imagine going LONG 20X at the all-time high? Isn't that stupid?
I can bet you the same people didn't want to buy LONG when Bitcoin was trading at $75,000. In fact, I can bet that these people that just got liquidated were selling below $80,000 and buying LONG with 20X at $110,000. A recipe for disaster.
Anyway, I am calling it early. This is it, we are going up.
I got my signals, as you already know, from the altcoins.
If you agree boost and follow.
Thanks a lot for your continued support.
Namaste.
Bitcoin Weekly Ultra-BearishThe 100K support is still valid but the weekly timeframe chart isn't looking good.
Good afternoon my fellow Cryptocurrency trader, how are you feeling today?
Bitcoin peaked the week 19-May. Then we have bearish action only.
The week after 19-May was red, then two neutral weeks and a continuation this week. It looks pretty bad right now, terrible to be honest.
» The main support range sits between $82,500 and $88,888.
Thank you for reading.
This support zone will only become active is 100K breaks on the weekly timeframe.
Namaste.
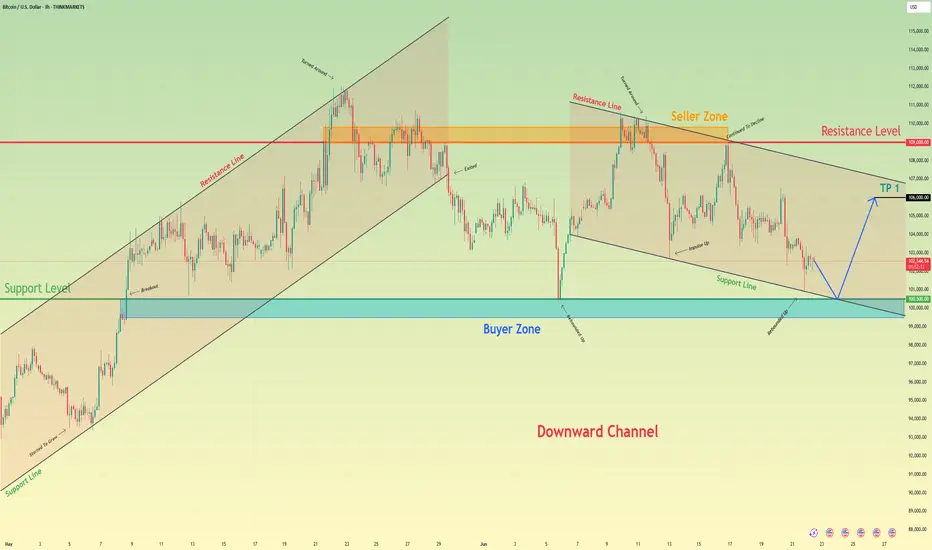
Bitcoin can correct to support line of channel and start to growHello traders, I want share with you my opinion about Bitcoin. The price was moving inside a strong upward channel, where it managed to break through the support level and then the resistance level, eventually reaching the seller zone. After that, BTC started to turn around and declined, once again breaking through the 109000 resistance level, this time from above. That movement also marked an exit from the upward channel. Following that, the price made a correction move down to the support level — the same zone that previously acted as a breakout area. From there, BTC showed strength again with a bullish impulse upward, returning to the Seller Zone. However, that rally was short-lived. The market started to decline again, this time forming a downward channel. Now the price is approaching the support line of this channel, which coincides with the support level around 100500 and the buyer zone between 99500 and 100500. I think BTC can decline a bit further to test this support line, and then rebound from this area, starting a new upward move toward the channel resistance line. That’s why I’ve set my TP at 106000 points, just below the resistance line. Given the structure and past reactions from these zones, I remain bullish and expect further growth after this local pullback. Please share this idea with your friends and click Boost 🚀
Disclaimer: As part of ThinkMarkets’ Influencer Program, I am sponsored to share and publish their charts in my analysis.
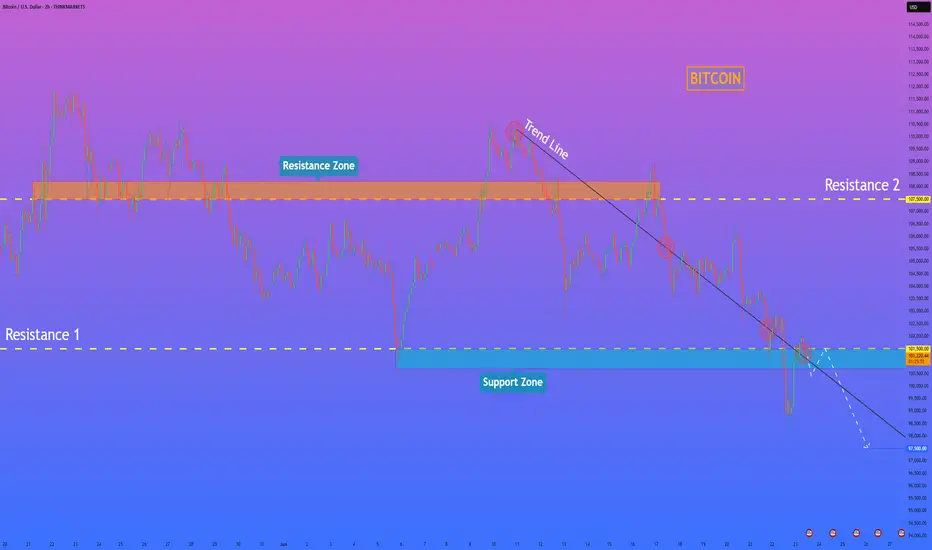
HelenP. I Bitcoin may break trend line and continue to move downHi folks today I'm prepared for you Bitcoin analytics. After testing the resistance area between 107500 and 108200 points, the price started to form a clear descending pattern, respecting the downward trend line with multiple touches. The price consistently failed to break above it, confirming bearish pressure. Eventually, it dropped below the 101500 support level and entered the support zone down to 100700 points, where it found temporary relief. From there, BTC attempted a short-term rebound and moved back toward the 101500 resistance area. However, it now trades just under the trend line again, signaling that the sellers are still in control. The structure suggests a potential pullback toward the trend line or the lower boundary of the resistance zone before further downside continuation. In my opinion, BTCUSD is preparing for another move lower. That’s why I expect a slight upward correction, followed by a new bearish impulse that could push the price toward the 97500 level, my current goal. Given the ongoing pressure from the trend line and the failed breakout attempts, I remain bearish and expect further decline. If you like my analytics you may support me with your like/comment ❤️
Disclaimer: As part of ThinkMarkets’ Influencer Program, I am sponsored to share and publish their charts in my analysis.
How to Tell BITCOIN is BULLISH using MOVING AVERAGES OnlyBTC is trading sideways and it sparks a lot of debate whether or not we are at the beginning of a new bearish cycle, or if there is still a push upwards waiting to happen.
Here's how you can use the Moving Averages to determine whether or not BTC is bullish.
Don't miss this update on my stance on the market and why I think ALT Season is waiting:
______________________
BINANCE:BTCUSDT

Market SIGNALS SHOW THAT BTC CAN FALL TO 85K USDMarket follow-up study shows that there is a good chance BTC can fall to 85K in the coming time period. The market cycle seems to end the green trend and to enter a new red zone.
Time will show what really can happen with BTC.
The market can make a fake trend, with a trend fall on a high time frame.
The crash can also happen on the main markets.
This is not trading advice, trade always only depending on your plan.
BTC/USDT Technical Outlook – Reversal Zone In Play✅ BTC/USDT Technical Outlook – Reversal Zone In Play
Current Price: 101,884.97 USDT
Structure: Bullish Reversal Setup
🧠 Market Insight:
Bitcoin has tapped into a high-probability demand zone between 100,000 – 99,300 USDT, showing clear signs of buyer absorption after extended downside pressure. The chart illustrates a strong bullish reaction from this area, hinting at a potential shift in momentum.
📈 What the Chart Tells Us:
Demand Zone Activation:
The price has tested a historically reactive demand block and bounced with strength — indicating a possible exhaustion of sellers and re-entry by larger players.
Volume Cluster Confluence:
Volume Profile shows heavy historical activity around this zone. This suggests that the current bounce is not just noise — but supported by previous institutional interest.
Path Projection (White Curve):
Market structure suggests a minor pullback followed by bullish continuation toward the 104,000–105,000 USDT target. The curved projection outlines potential market behavior leading up to this target.
Short-Term Resistance:
First key resistance is seen around 102,800–103,200 USDT. A break above this would likely trigger bullish momentum toward target levels.
🔐 Trading Insight:
Bias: Bullish (Short to Medium Term)
Entry Zone: 100,200 – 100,800 USDT (buy on minor dip)
Target Zone: 104,000 – 105,000 USDT
Invalidation: Clean breakdown below 99,000 USDT
📊 Summary:
BTC is currently sitting at a critical demand zone with bullish potential building. Price action, volume profile, and market behavior all support a reversal toward 104K+. Traders should watch for confirmation on the next pullback before entering long positions.
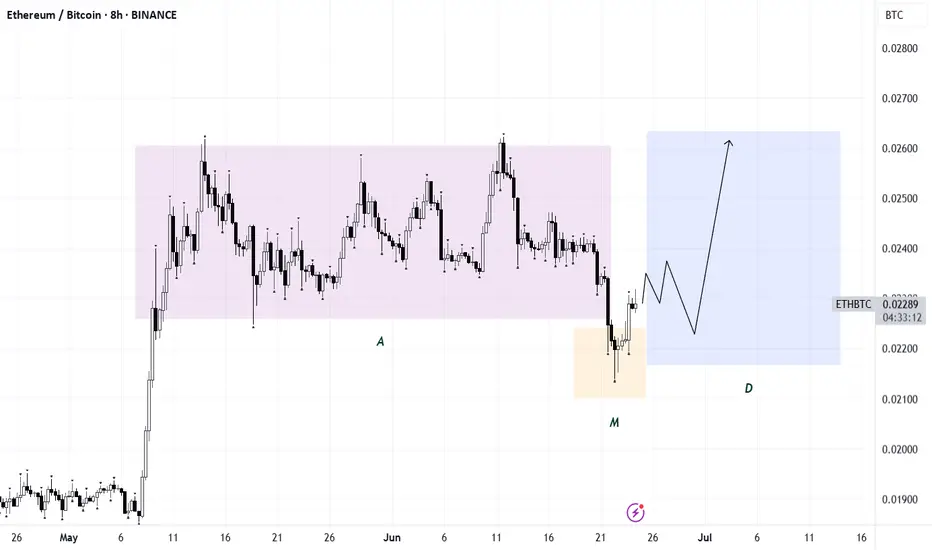
ETH/BTCPotential AMD setup forming. Ideally, a distribution phase unfolds before July 9th — which could trigger a rotation into altcoins.
As always, confirmation is key for any entry. No confirmation — no trade.
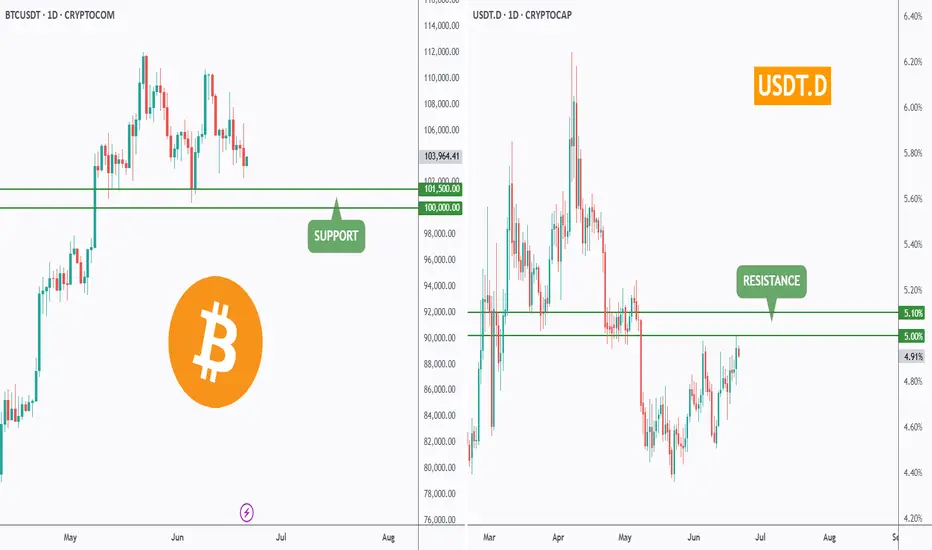
BTC & USDT.D => Bullish Correction Incoming?Hello TradingView Family / Fellow Traders. This is Richard, also known as theSignalyst.
Both BTC and USDT.D are sitting around key rejection zones.
💰 BTC is hovering near the $100,000 level — a major previous low and a psychological round number.
📊 Meanwhile, USDT.D is testing the 5% resistance — a supply zone and another critical round number.
As long as $100,000 holds as support on BTC and 5.1% holds as resistance on USDT.D, we could expect a bullish correction across the crypto market.
What do you think? Will these levels hold or break? 🤔
📚 Always follow your trading plan regarding entry, risk management, and trade management.
Good luck!
All Strategies Are Good; If Managed Properly!
~Rich
Bitcoin BTC Pullback Strategy: How I’m Planning My Next EntryI’m currently watching BTCUSDT 👀. Yesterday, we saw a bullish break of structure 🔼, and my bias is to follow that momentum moving forward 📈. Right now, price is overextended 📊, so I’m looking for a retracement into equilibrium, ideally around the 50–61.8% Fibonacci zone 📏.
If price pulls back into that range and holds above the bullish imbalance (discussed in the video) 🧱, I’ll be watching for a long opportunity 🎯. My targets are set at the previous highs and the Fibonacci extension levels 🔝.
⚠️ Disclaimer
This is not financial advice. Trading involves risk, and you should only trade with capital you can afford to lose. Always do your own analysis or consult a qualified financial advisor.

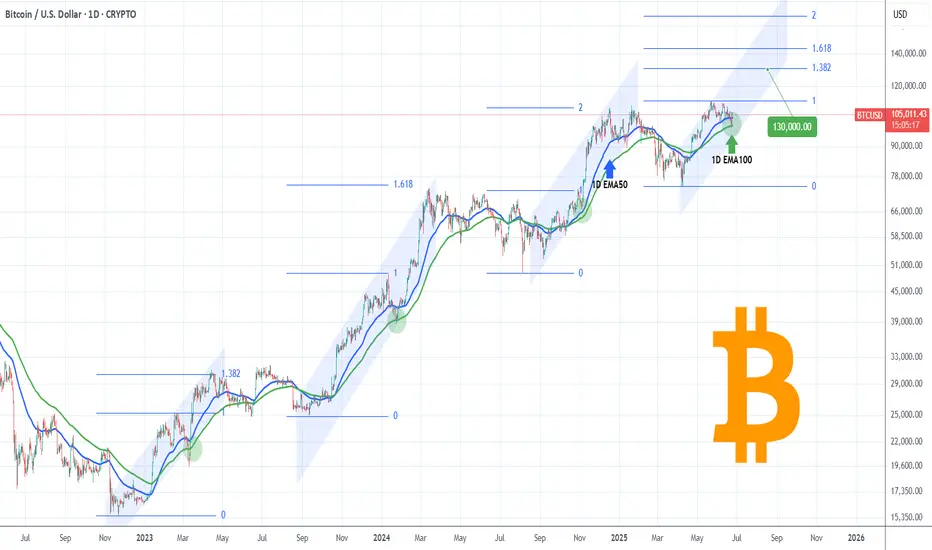
BITCOIN Trump and the 1D EMA100 saved the day!Bitcoin (BTCUSD) rebounded yesterday on its 1D EMA100 (green trend-line) and along with Trump's truce announcement between Israel and Iran, it sent the market into a buying frenzy and back above the $105k mark.
Technically, the 1D EMA100 isn't something to be ignored as since the November 2022 market bottom, each Bullish Leg (Channel Up) that started had a contact (or near) with it that resulted into a considerable bullish extension.
The 1st Channel Up even breached below it, but after rebounding, it reached the 1.382 Fibonacci extension before the next correction. The 2nd Channel Up rebounded exactly on the 1D EMA100, and reached the 1.618 Fibonacci extension. The 3rd Channel Up almost hit the 1D EMA100 and then rebounded to the 2.0 Fibonacci extension.
It is obvious that the pattern follows a progression and each Fib extension peak is higher than on the previous Channel Up. As a result, it is not unlikely to see a High even above the 2.0 Fib ext ($168k) on the current (4th) Channel Up, however on the short-term we would still welcome the 1.382 Fib 'minimum' expectation, targeting $130000.
Do you think we should at least be expecting that? Feel free to let us know in the comments section below!
-------------------------------------------------------------------------------
** Please LIKE 👍, FOLLOW ✅, SHARE 🙌 and COMMENT ✍ if you enjoy this idea! Also share your ideas and charts in the comments section below! This is best way to keep it relevant, support us, keep the content here free and allow the idea to reach as many people as possible. **
-------------------------------------------------------------------------------
💸💸💸💸💸💸
👇 👇 👇 👇 👇 👇
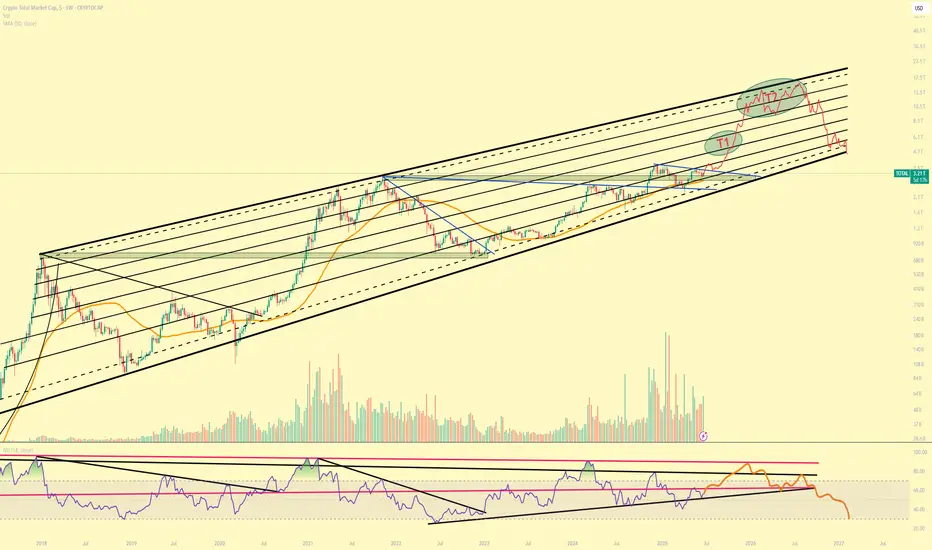
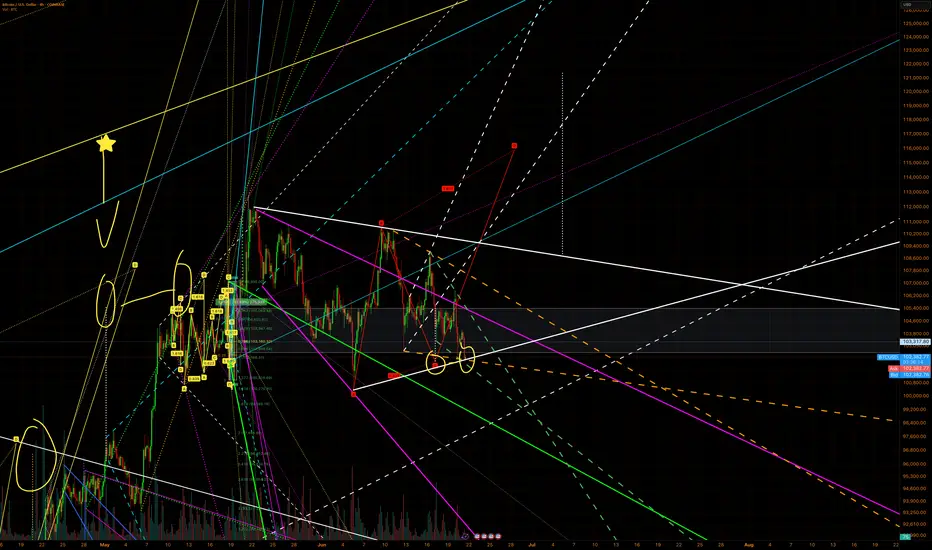
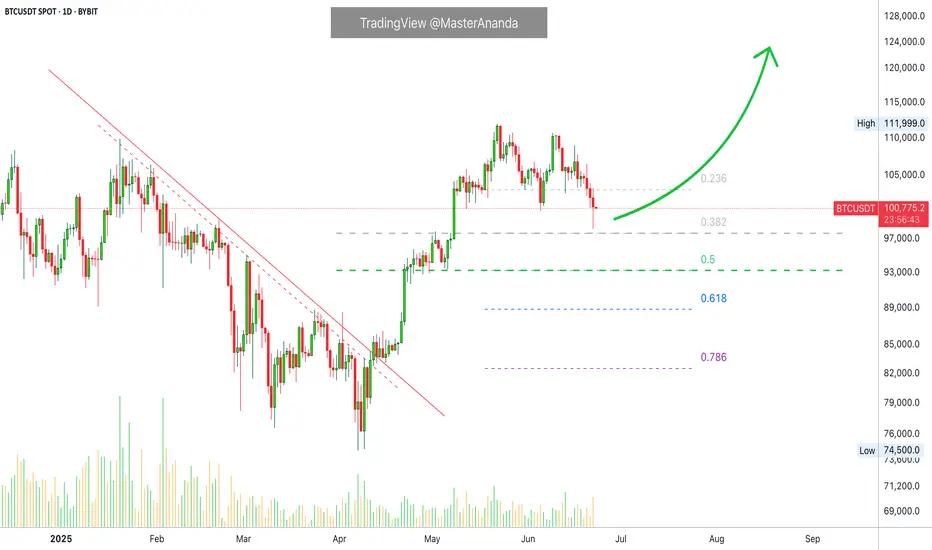
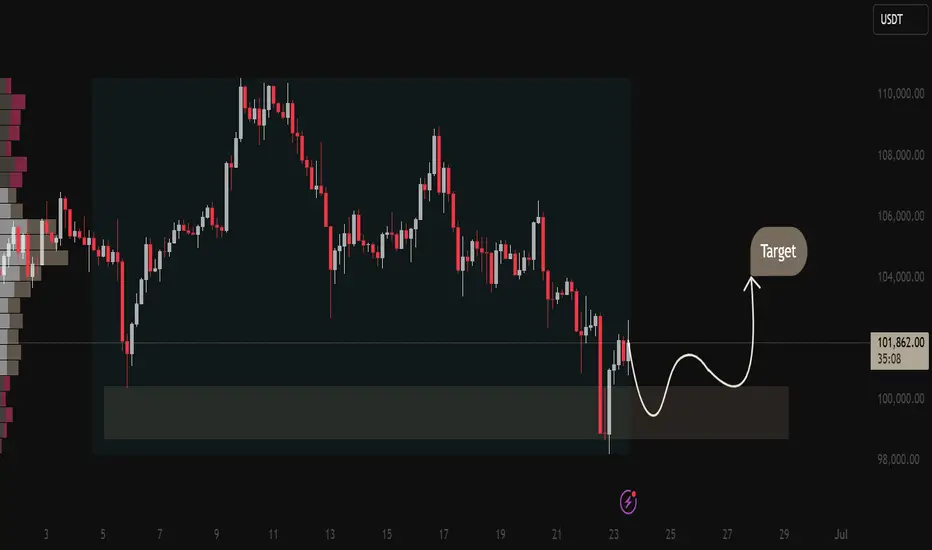
Something Like ThisI believe the charts are pointing towards the market gearing up for a play somewhat like this.
The timing may well be off, but the levels and sequence seem broadly predictable.