$BTC correction: targets 101k, 97.5k, 94k, 87kThe hype is peaking — institutions, banks, Wall Street, and even governments are buying Bitcoin.
Yet despite the frenzy, BTC has been rejected three times around the $110K level and appears to be heading into another correction.
Bitcoin maximalists are pushing a strong FOMO narrative to attract retail investors, but several factors are pushing back:
- Psychological barrier: At these price levels, retail investors are hesitant. Owning just a "fraction" of a Bitcoin doesn’t appeal to the average person.
- Geopolitical tension: The conflict with Iran is serious. This isn’t a small, isolated country — Iran is a millennia-old civilization with global alliances. This situation won't resolve quickly or easily like Libya, Syria, or Iraq.
- Oil price surge: Escalating tensions could disrupt the Strait of Hormuz, a critical route for global oil. Western sanctions on Russia already strain supply — if Iran joins, where will Europe get its energy? U.S. supply won’t be enough. Expect a spike in inflation.
- Recession risks: Persistent inflation could drive a recession in the second half of the year.
- Trade wars & tariffs: No resolution, just chaos.
- Ukraine-Russia war: Still unresolved. Still draining global stability.
In short, the world is burning — and this is terrible for markets.
Bitcoin maximalists — some even selling company shares to buy more BTC — may soon face the harsh reality: Bitcoin needs a deeper flush before it can rally again. Retail won’t return until altseason clears the way and resets sentiment.
In a cycle dominated by propaganda, institutional manipulation, and global unrest, predictions are fragile. The only guide left: the chart.
Technically, we’re in correction mode again. Comparing with past cycles, potential pullback targets are:
$101K, $97.5K, $94K, $87K
There’s massive support at $74K, but it's unlikely we revisit it soon.
Stay cautious. DYOR.
#Bitcoin #CryptoMarket #BTCUpdate #Geopolitics #Altseason #CryptoCorrection #MacroView #CryptoFOMO #RiskAssets #DYOR
BTC-M

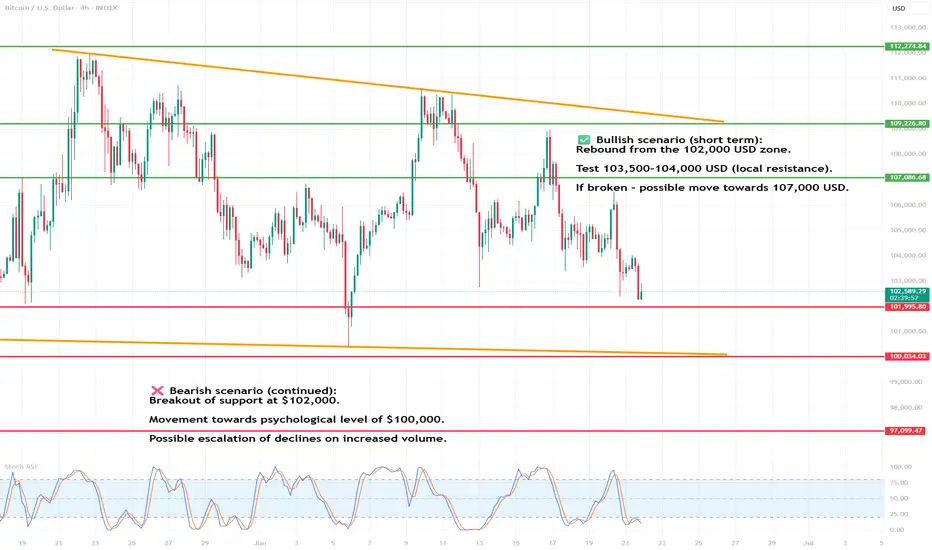
BTC/USD (4-hour interval)📈 BTC/USD
🕒 Interval: 4H
1. General trend
We are observing a medium-term downtrend.
Since June 10 (middle vertical line), the price has been systematically creating lower highs and lower lows.
Current price: approx. USD 102.625.
2. Formation and Price Action
🔻 Left side of the chart (May 20 - June 10):
Volatility, no clear direction, but local highs are formed in the area of USD 111,000 - 112,500.
Consolidation from May 27 to June 2.
🔻 Right side of the chart (after June 10):
A clear breakout from the consolidation downwards.
A potential correction or continuation of the downward movement is currently forming.
The last candles suggest a strong downward impulse, and the current candle has a long lower shadow – a possible demand reaction.
3. Technical levels
📉 Resistance:
$112,400 – local peak from June 10.
$109,000 – $109,500 – area of previous consolidations.
$107,000 – lower limit of previous support.
📈 Support:
$102,000 – currently tested level.
$100,000 – psychological support level.
$97,000 – potential range of further declines.
4. Stochastic RSI (oscillator at the bottom of the chart)
The indicator currently shows the intersection of the %K and %D lines in the oversold zone.
This may suggest a short-term upward rebound – but in the context of a downtrend, this may just be a correction.
5. Candles and price action
The last candle has a long lower shadow and a close close to the maximum – this may indicate buyer pressure in this zone.
No confirmation of a reversal – only the closing of a bullish candle and a breakout above USD 103,500–104,000 may give a signal of a larger rebound.
6. Scenarios
✅ Bullish scenario (short-term):
Rebound from the USD 102,000 zone.
Test of USD 103,500–104,000 (local resistance).
If broken – a move towards USD 107,000 is possible.
❌ Bearish scenario (continuation):
Breakout of support at USD 102,000.
Movement towards the psychological level of 100,000 USD.
Possible escalation of declines on increased volume.
7. Signals to watch
Price behavior in the area of 102k USD - a key place to react.
Volume indicators (not visible here) could confirm the direction of the movement.
Will stochastic RSI give a full buy signal? (%K line above %D, both coming out of the oversold zone).
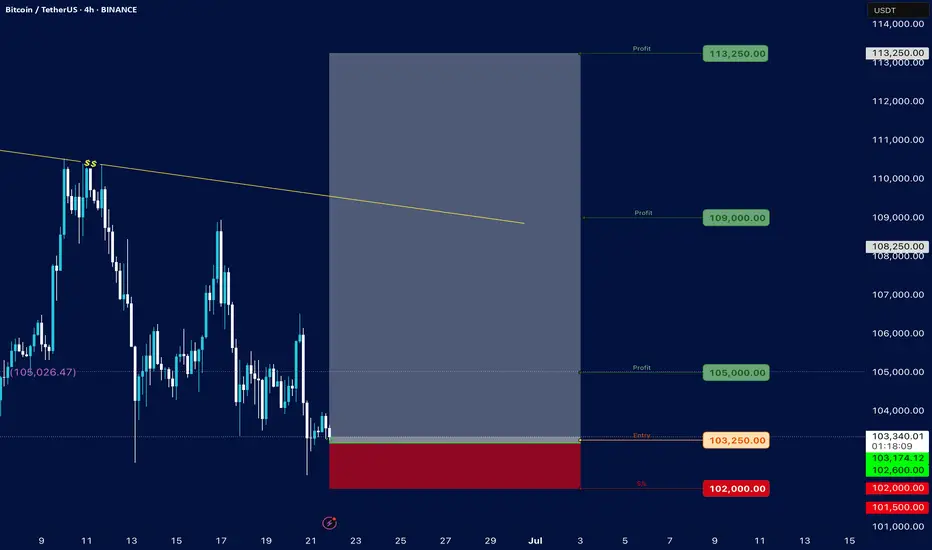
Bitcoin### Bitcoin Price Analysis (June 21, 2025)
#### **Current Price**: $103,236.15 (as of the snapshot)
- The price is hovering near the lower end of the recent range, with key support at **$102,000** (marked as "S/s" on the chart).
- Resistance levels are visible at **$105,000**, **$107,000**, and **$110,000–$114,000**.
#### **Key Observations**:
1. **Support and Resistance**:
- **Strong Support**: $102,000 (critical level; break below could signal further downside).
- **Immediate Resistance**: $105,000 (previous entry point and psychological level).
- **Higher Targets**: $110,000–$114,000 (if bullish momentum returns).
2. **Price Action Context**:
- The price recently rejected the $105,250 level ("Entry") and is now testing lower support.
- The "Profit" markers at $105,000 and $105,026 suggest these were take-profit zones for traders.
3. **Trend and Sentiment**:
- The chart shows consolidation between $102,000–$110,000, with no clear breakout yet.
- A hold above $102,000 could lead to a retest of $105,000, while a break below may target $100,000 or lower.
4. **Volume and Timeframe**:
- The snapshot lacks volume data, but the date range (June–July) suggests a medium-term view.
- Key dates to watch: June 25–28 and early July for potential volatility.
#### **Conclusion**:
- **Bullish Case**: Hold above $102,000 and reclaim $105,000 to aim for $110,000+.
- **Bearish Risk**: Break below $102,000 could accelerate selling toward $100,000 or $99,000.
**Actionable Insight**: Watch the $102,000–$105,000 range for a breakout or breakdown. A rebound from support with volume could signal a buying opportunity, while a drop below $102,000 may indicate further downside.
*(Note: The analysis is based on limited data from the snapshot. For a full assessment, additional indicators like RSI, MACD, and volume would be needed.)*
Bitcoin CME Gap June 21thBitcoin has a CME gap at $103.292 . Historically, these gaps tend to get filled and if it happens again, it could mean a short-term move before continuation.

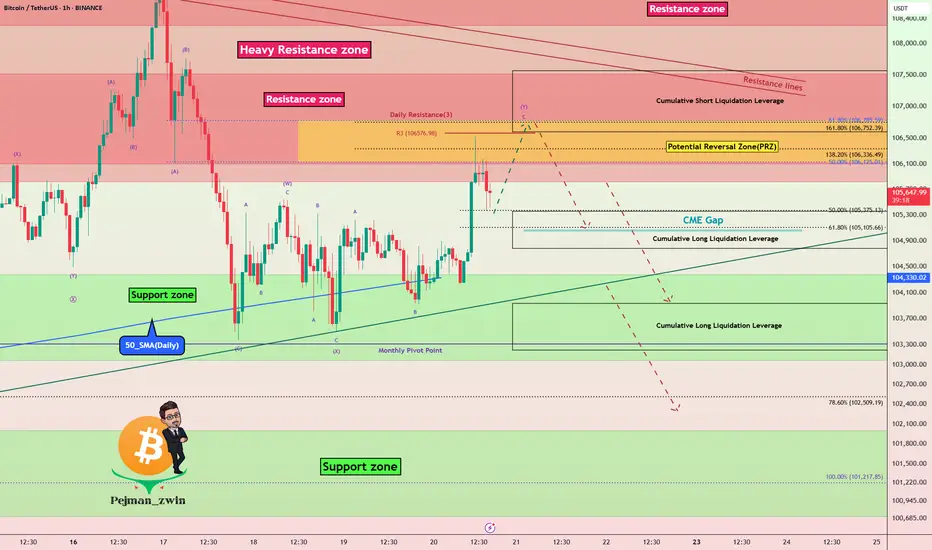
Bitcoin Hits PRZ — Is This the Perfect Short Entry?Bitcoin ( BINANCE:BTCUSDT ) has entered the Potential Reversal Zone (PRZ) after a strong bullish impulse , testing the confluence of Daily Resistance(3) .
In terms of Elliott Wave analysis , the market seems to have completed a complex WXY corrective structure , with the recent rally likely representing the final wave Y . This makes the current zone highly reactive for potential reversal .
I expect Bitcoin to retrace toward the CME Gap($105,075-$105,055) and possibly continue downward toward the Support zone($104,380-$103,060) and Cumulative Long Liquidation levels if the sellers regain momentum .
Cumulative Short Liquidation Leverage: $107,568-$106,601
Cumulative Long Liquidation Leverage: $105,360-$104,784
Cumulative Long Liquidation Leverage: $103,937-$103,217
Note: It is better to look for short positions at the Potential Reversal Zone (PRZ) or if Bitcoin touches $104,780 before reaching PRZ. That is why I chose to label this analysis as ''Short".
Note: If Bitcoin can touch $107,620 , there is a possibility of breaking the resistance lines and increasing further.
Please respect each other's ideas and express them politely if you agree or disagree.
Bitcoin Analyze (BTCUSDT), 1-hour time frame.
Be sure to follow the updated ideas.
Do not forget to put a Stop loss for your positions (For every position you want to open).
Please follow your strategy and updates; this is just my Idea, and I will gladly see your ideas in this post.
Please do not forget the ✅' like '✅ button 🙏😊 & Share it with your friends; thanks, and Trade safe.
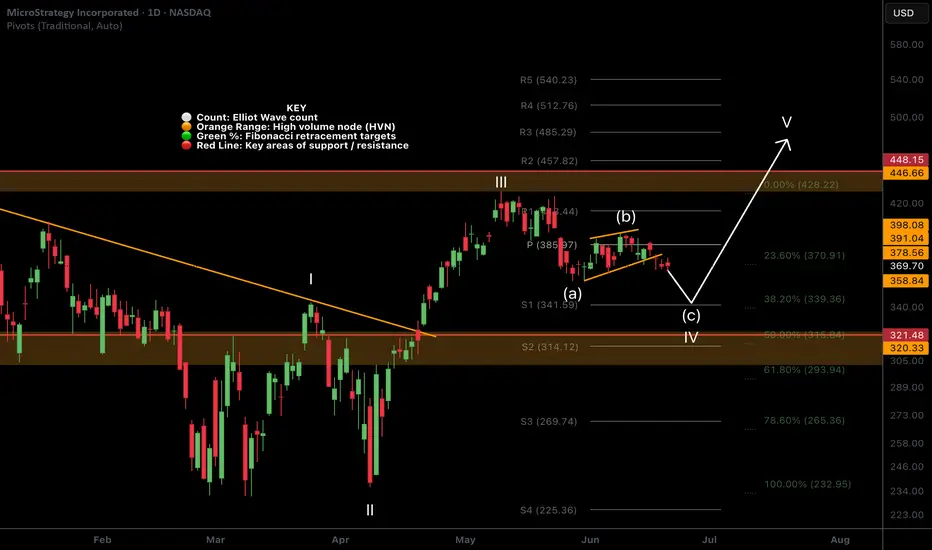
MicroStrategy another pull back before all time high?NASDAQ:MSTR analysis update..
📉 𝙇𝙤𝙣𝙜 𝙩𝙚𝙧𝙢 The weekly R5 pivot target is bold at $1500 but definitely possible as a max greed scenario when the triple tailwind of Bitcoin, SPY and Bitcoin treasury companies trends return.
📉 𝙎𝙝𝙤𝙧𝙩 𝙩𝙚𝙧𝙢 retracement is expected to end around the S1 pivot at $341 and a secondary target of $321.
Irans conflict has investors shaken and not willing to hold assets over the weekend on the fear of worse. However, if the conflict is resolved soon investors could have a great buying opportunity.
𝙏𝙚𝙘𝙝𝙣𝙞𝙘𝙖𝙡 𝘼𝙣𝙖𝙡𝙮𝙨𝙞𝙨
Price appears to have completed wave (B) of an ABC correction in wave 4. Wave C is underway with an expected thrust down (such is the nature of wave C) towards the daily S1 pivot $341. This is also the 0.382 Fibonacci retracement, a high probability area for wave 4 to end. A deeper correction will bring up a triple shield of the High Volume Node, ascending daily 200EMA and 0.5 fibonacci retracement at £321.
Daily DEMA has death crossed.
Safe trading
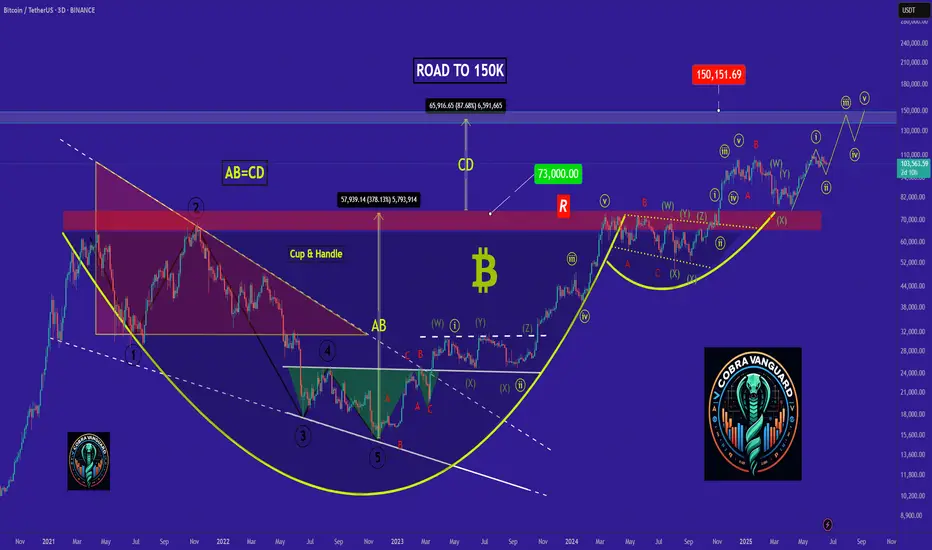
Do you think I'm joking ???The price is currently forming the second corrective wave, and a slight price drop to reach higher levels is normal.
Best regards CobraVanguard.💚
BRIEFING Week #25 : Heading into Summer ModeHere's your weekly update ! Brought to you each weekend with years of track-record history..
Don't forget to hit the like/follow button if you feel like this post deserves it ;)
That's the best way to support me and help pushing this content to other users.
Kindly,
Phil

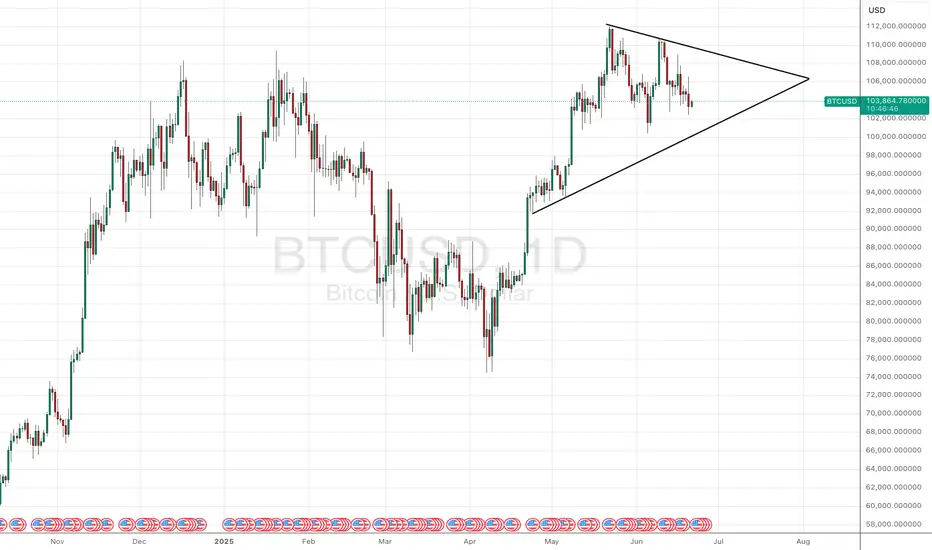
Symmetrical Triangle: Volatility Squeeze Before Breakout?Bitcoin (BTCUSD) is currently trading within a well-defined symmetrical triangle pattern on the daily chart. This formation is characterized by converging trendlines—higher lows and lower highs—indicating a period of consolidation and decreasing volatility.
Price action is tightening, suggesting a potential breakout is imminent. Symmetrical triangles can break either way, but in this case, the pattern follows a strong prior uptrend, hinting at a possible bullish continuation. Still, traders should watch closely for a confirmed breakout with volume.
⚠️ Key levels to watch:
Upper resistance: ~$111,000
Lower support: ~$96,000
A decisive break above or below these boundaries could set the tone for BTC’s next major move.
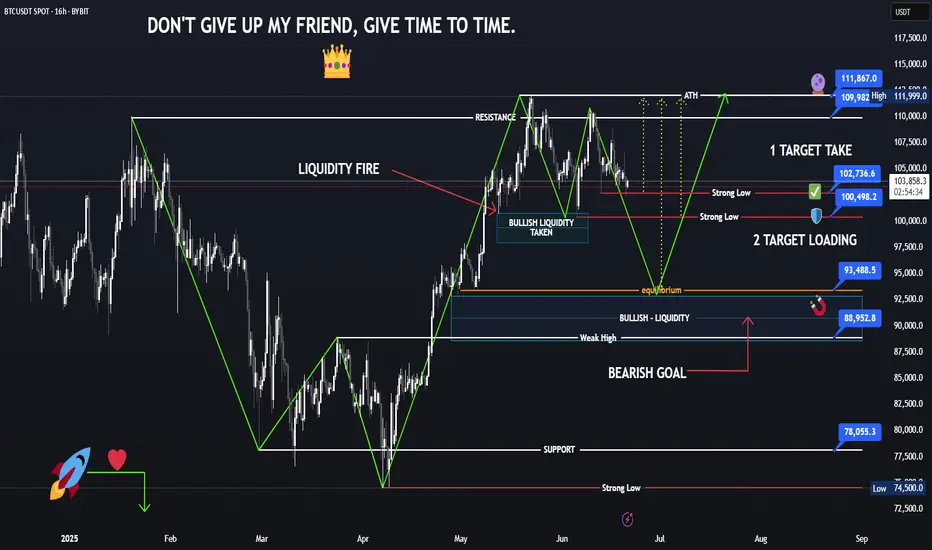
BTC goes wild. But there’s worse. With PipGuard.“BTC goes wild. But there’s worse. With PipGuard.”
Hola, hi my friends! How are you doing? Hope you're doing amaziiiing!
Today we’re having a little chat about Bitcoin, shall we?
I admit it: this time I messed up and took the USDT spot chart instead of USD… but heeey, I’m lazy and it doesn’t really matter. What counts is the trend, RIIIGHT?
But first… boost me and drop a comment <3
📈 The trend is your friend... until it messes with you
🔼 If it goes up, it goes up
BTC is still in a strong bullish trend long term.
Nothing new? Maybe, but if it keeps going… it’s aiming for new highs. Simple.
And if not today, then tomorrow. Your loss if you miss it.
🧠 Always keep one eye on assumptions and the other on objectivity. The market will thank you.
🔽 If it drops... better be ready
And if it decides to go down?
Here come the targets: 102k , 100k , and that delicious 94k I’d love to see.
Why? Because even crypto needs a break.
And each level is potentially a reversal point , you know that already, right?
🧱 Supports, resistances... and your debts
• Resistance: 109k (rounded like those 100€ you still owe me haha)
• Serious support: 78k
• Cuddly support: 88k
• The rest is noise.
• Trend still strong, yes. But if you’re not watching… someone else will watch your wallet.
🔥 The market today? On fire, as always
• BTC did its usual trick: touched 106k , then dropped below 103k
• Liquidations? BOOM 💣: over 450 million dollars in longs
• The market shook like a noob on their first short
🌍 War, hacks, and chaos: BTC loves it
• Israelis flying around Iran bombing targets
• Iranians firing back missiles
• Israeli hackers broke into Nobitex and BURNED 90M in crypto
• The White House is silent, but the US has a “Bitcoin Reserve”
• Result? BTC pumps, dumps, pumps again… you tell me
🐍 Juicy GOSSIP
• In New York, two crypto bros kidnapped an Italian guy from Rivoli and tortured him for 17 days to get his wallet password
• Electroshock. Power saw. “Wild” sessions with madams & friends
• All this between parties, bondage, and wheelchairs
• The guy, alive by miracle, is now the new symbol of “ never give your key to anyone ”
📊 Technical Recap
🧱 Resistance: 109k
🪨 Supports: 88k / 78k
💣 Liquidations: +450M long
📉 Price Range: 106k ➝ below 103k
🌍 Geopolitics: Real bombs & BTC
😈 Gossip: Crypto-bros under pressure 😱
😂 The curtain drops…
My fingers hurt. And not just from typing… oops, I said it? I did.
If you had fun, boost and comment .
If not… next time I’ll give you support at 69k, that’ll teach you.
A hug from your loyal lunatic, PipGuard 🤣🧨
Skeptic | Bitcoin Deep Dive: Rate Hikes, War Tensions & TriggersInterest Rates: The Big Picture
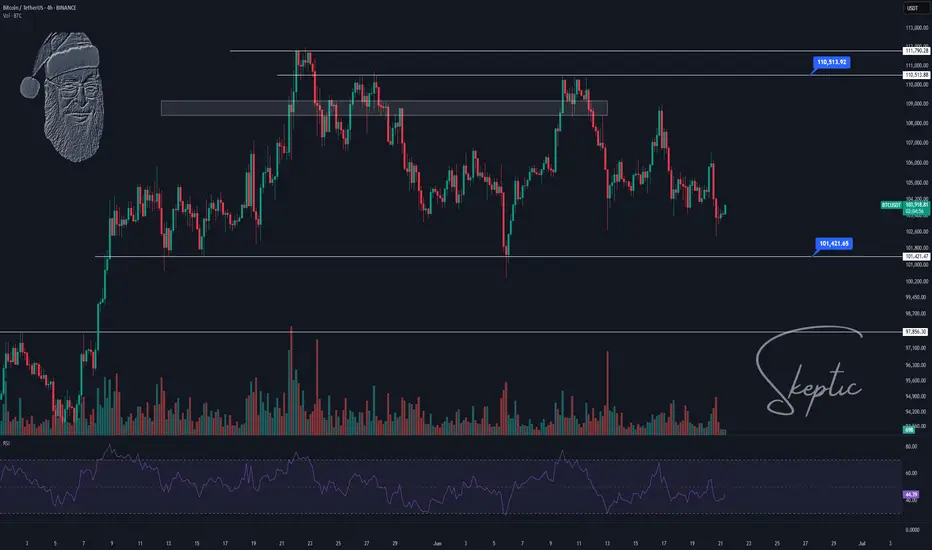
Let’s start with the Federal Reserve’s move—interest rates jumped from 4.25% to 4.5% . What’s the deal? Higher rates mean costlier borrowing , so businesses and folks pull back on loans. This drains liquidity from risk assets like Bitcoin and SPX 500, slowing their uptrend momentum or pushing them into ranges or dips. Now, mix in the Israel-Iran conflict escalating ? Straight talk: risks are sky-high , so don’t bank on wild rallies anytime soon. My take? BTC’s likely to range between 97,000 and 111,000 for a few months until geopolitical risks cool (like Russia-Ukraine became “normal” for markets) and the Fed starts cutting rates. Those two could ignite new highs and a robust uptrend. Let’s hit the charts for the technicals! 📊
Technical Analysis
Daily Timeframe: Setting the Stage
You might ask, “If 100,000 support breaks, does that mean we’ve formed a lower high and lower low, flipping the trend bearish per Dow Theory?” Absolutely not! Here’s why: our primary uptrend lives on the weekly timeframe, not daily. The daily is just a secondary trend. If 100K cracks, it only turns the secondary trend bearish, leading to a deeper correction, but the major weekly uptrend stays intact.
Spot Strategy: No spot buys for now. Economic and geopolitical risks are too intense. I’ll jump in once things stabilize. 😎
Key Insight: A 100K break isn’t a death sentence for the bull run—it’s just a shakeout. Stay calm!
4-Hour Timeframe: Long & Short Triggers
Zooming into the 4-hour chart, here’s where we hunt for long and short triggers:
Long Trigger: Break above 110,513.92. We need a strong reaction at this level—price could hit it early or late, so stay patient for confirmation.
Short Trigger: Break below 101,421.65. Same vibe—watch for a clean reaction to tweak the trigger for optimal entry.
Pro Tip: These levels are based on past key zones, but time outweighs price. Wait for a reaction to nail the best entry. Patience is your edge! 🙌
Bitcoin Dominance (BTC.D): Altcoin Watch
As BTC dips, BTC.D (Bitcoin’s market share) is climbing, meaning altcoins are taking a bigger beating. Don’t touch altcoin buys until the BTC.D upward trendline breaks. They haven’t moved yet—you might miss the first 10-100%, but with confirmation, we’ll catch the 1,000-5,000% waves together. 😏
Shorting? If you’re shorting, altcoins are juicier than BTC—sharper, cleaner drops with more confidence. Patience, patience, patience—it’s the name of the game.
Final Thoughts
My quieter updates lately? Blame the geopolitical chaos, not me slacking . I’m hustling to keep you in the loop with clear, actionable insights. here, we live by No FOMO, no hype, just reason. Protect your capital—max 1% risk per trade, no exceptions. Want a risk management guide to level up? Drop a comment! If this analysis lit a spark, hit that boost—it keeps me going! 😊 Got a pair or setup you want next? Let me know in the comments. Stay sharp, fam! ✌️
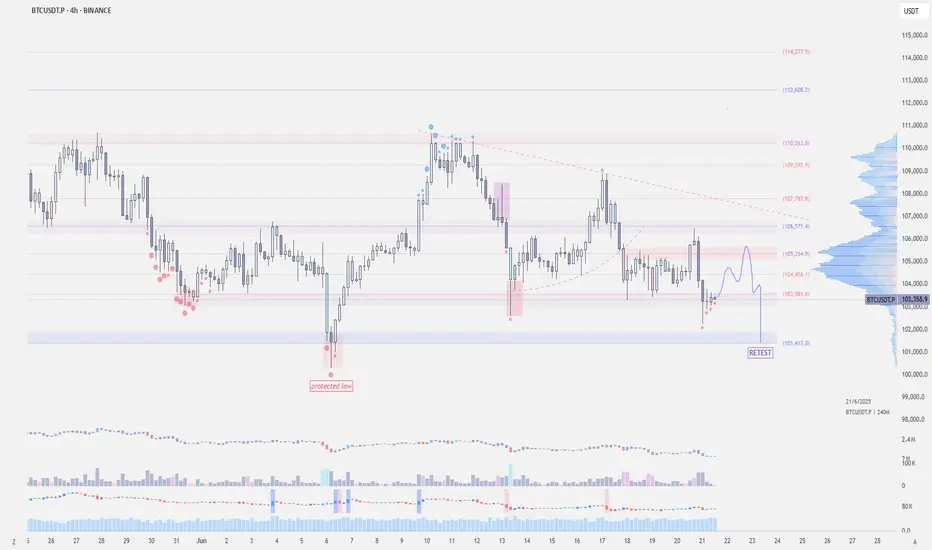
$BTC - Protected LowBINANCE:BTCUSDT | 1D
Price got strongly rejected at 106.5k
It deviated below the 4-hour mini-range. We now need to see a reclaim of 105–105.1k. If not, a retest of the value area low at 101.4k is likely.
100k remains to be the protected low, and it would be critical if we won't get a valid retest at 101.4k
local resistance: 105-105.5k
local support: 101.4k
protected low: 100k
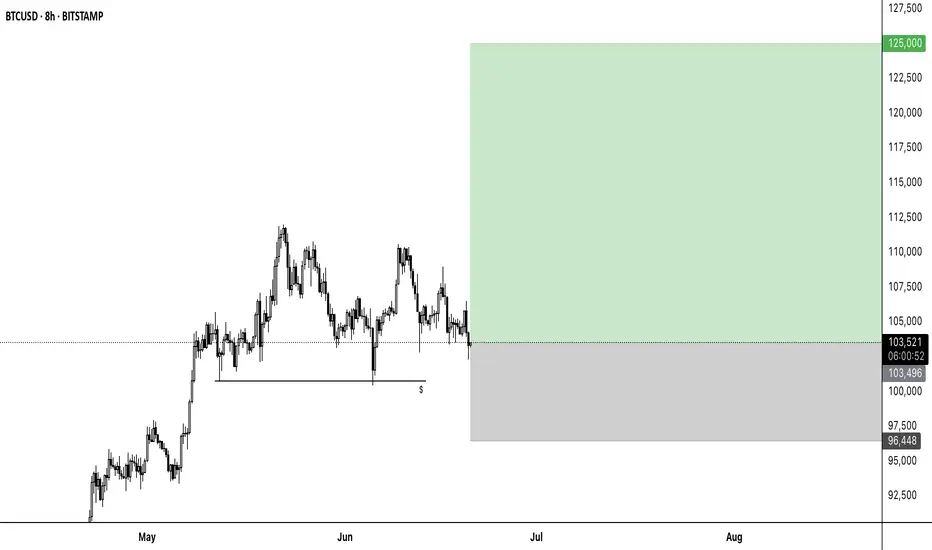
BTC to 125000📈 BTCUSD Long Setup – Maximum Fear Often Marks the Bottom
Timeframe: 8H
Entry: ~103,500
SL: 96,448
TP: 125,000
RR: ~3:1
🧠 Market Sentiment:
The current environment is dominated by extreme fear – sentiment is heavily bearish, and interest from retail investors is strikingly low. Most market participants appear to be short or sitting in hedged positions, which ironically sets the stage for a potential short squeeze if price breaks to the upside.
🔍 Technical Context:
BTC has been ranging for weeks – support has held repeatedly.
Liquidity has been swept below previous lows – possible spring formation.
A reclaim of the 104k–105k zone could act as a launchpad.
Setup anticipates a contrarian move against the prevailing bearish bias
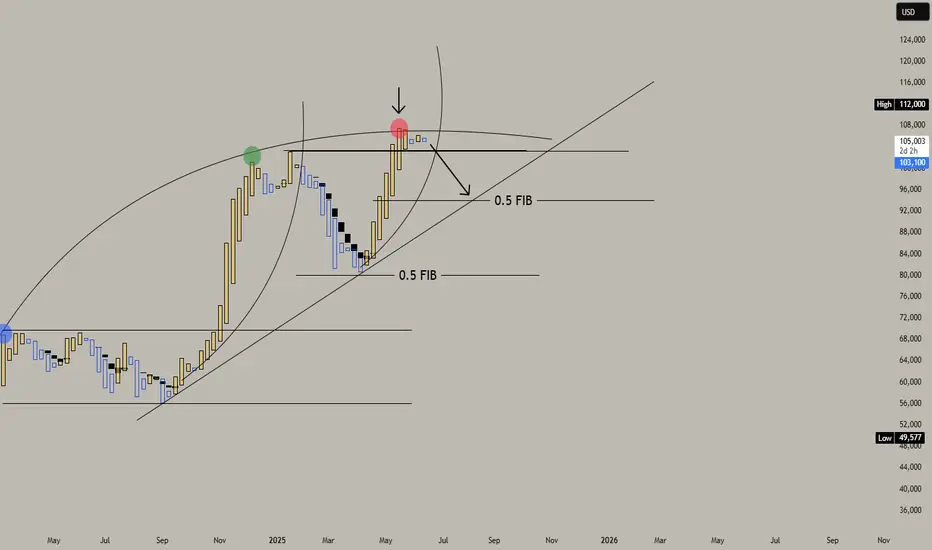
BTC, will hibernate for a few weeks from here to sub 100k.BTC rise has been impressive the last few weeks with market triggering excitement after hitting a series of ATH and finally punching the elusive100k levels, and pushing it further to 110k as a bonus.
But like with any overheated parabolic move, a cool down will need to transpire eventually. And that season is ripe now for the king of coins.
From the diagram we are seeing some curve fitting price action, with horizontal ranging at the upper channel -- indicating a bull saturation scenario.
A corrective phase to 0.5 fib levels maybe expected in the next few weeks. It did the same behavior last time. This hibernation would be healthy in the long run - and it needed to happen.
Spotted at 104k.
Target sub 100k levels / or 0.5 fib at 94k.
TAYOR.
Trade safely.
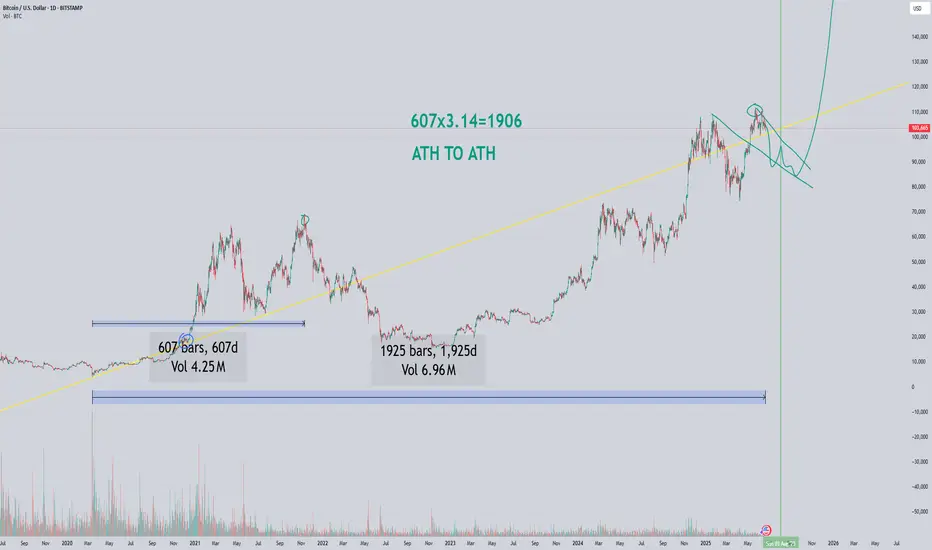
FROM ATH TO ATH BTC FRACTAL use 3.14The graph is fractal and cyclical. I used the number pi to predict where the atx plus might be, taking into account the fractals for bitcoin from previous ideas and the idea for xrp, where the number pi worked perfectly.
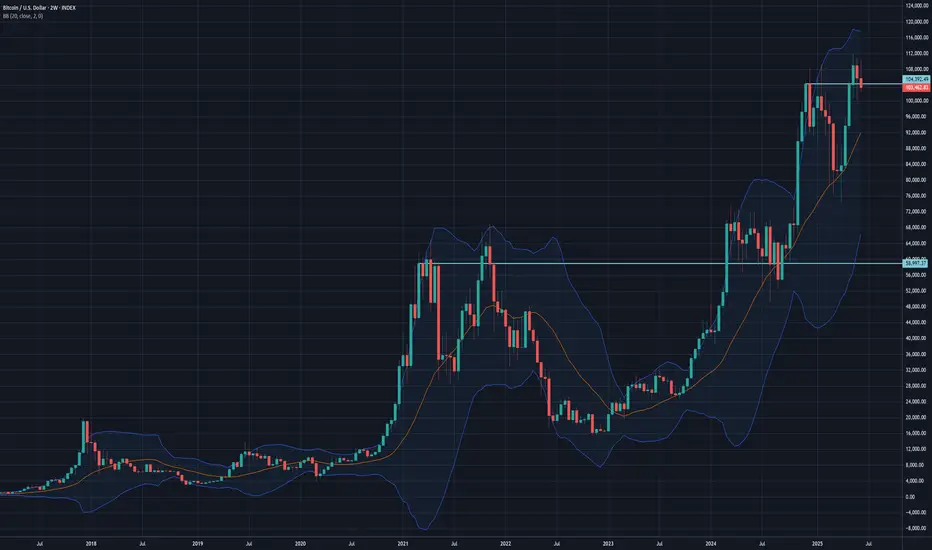
btcusd two weeks trump time scale bearishTrump TACO time scale two weeks looks reasonable time scale
2W candle of #Bitcoin closing this weekend.
If CRYPTOCAP:BTC will not hold the 104000 - game over we visit margin call level of Saylor's Strategy 60 000 and most possibly lower 30 000
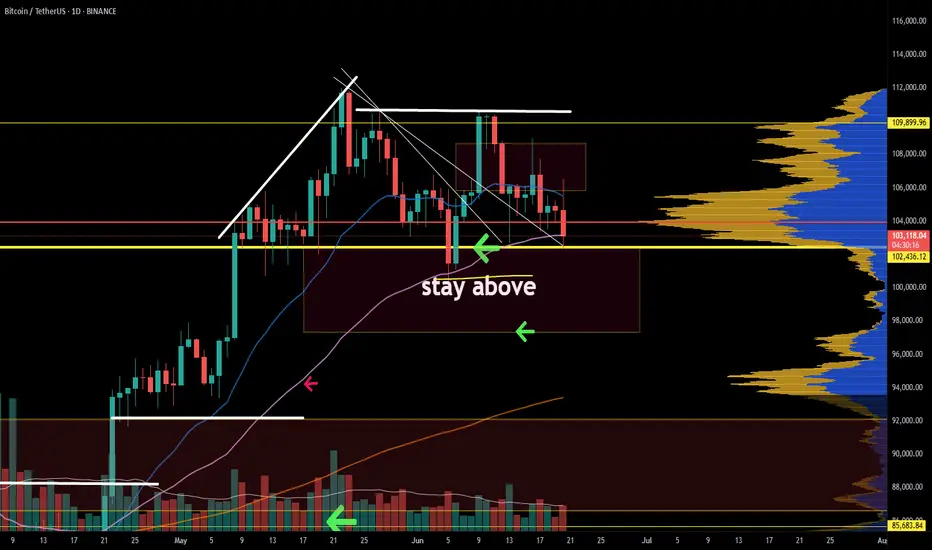
Become Rich Trading Bitcoin Strategy Simplified Correction NullIs this a shakeout or a rejection?
A rejection implies no bullish action short-term thus lower prices. It is still early on the current move.
A shakeout implies a bear-trap and bullish action soon to follow, as soon as the shakeout is complete.
Daily and weekly close
Let's be fair and honest, it is too early to say. To determine if the current move is either a rejection or a shakeout we have to wait for the close today.
Price action
Why are these two in question? Because the daily session moved higher today reaching $106,500 followed by lower prices. The low hit $102,309, lower than 13-June but higher than 5-June, a higher low. More information can be acquired once the trading session closes but, we can move ahead and see what the chart has to say based on other signals.
The volume is low on the bearish side, on all sides. The higher low so far is strong. As long as $102,000 holds Bitcoin is ultra-hyper bullish, very strong. Even if we are considering the short-term it doesn't matter, if the action is happening above this level the bulls are wining and that's what we have.
If the action is happening above $100,000 we already know what this means and this level is not in question right now. Being price oriented that is why I say is still early, do you agree?
So, more shakeouts, more sideways, more retrace—a non-event; short-term noise.
We are looking for the next major move, not the next $1,000 drop.
Market conditions do not change
Rest easy, Bitcoin will continue bullish even if it wicks below 100K. As long as it trades above this level, or the $100,000 to $102,000 price range, the action is safe (coming from the bulls).
If the week closes above this range but starts red next week and goes below, no need to panic because the week can start red just to recover and this would only be a continuation of the shakeout; we take information from the weekly close and not the intra-week action makes sense?
Questions —Leave a comment
So, what is your take?
Just let me know truly, what is your belief?
Do you think Bitcoin is bearish or bullish?
It can be looked at in many different ways.
The bull market
The trend is bullish, mid- to long-term. The action is happening above 100K.
The altcoins market is weak but we all know from the bottom we grow, we are entering the summer now... Ahhh, the beautiful summer, bring the heat. With the summer prices tend to grow.
You can call it a relief rally but that will be only the start. The relief will turn into a major bullish wave and this wave will transform into a major bull run.
Motivation
I love you again wishing you the best forever more.
You deserve the best now and always.
Keep at it and keep trying, persistence is the key. As long as we continue to trade, in the end we are sure to win.
Invest in Crypto, it is very easy.
Think of all the people that joined us (the market) 10 years ago. What are their holdings worth now? Millions upon millions... Now, think of yourself 10 years into the future. Put whatever money in you can afford and watch it grow.
The way to riches is not through frugality or savings, the way to riches is through buying and investing. This is the right market for us. It is fast, it is volatile, it is young; just like most of us. If not young of age, we are young at heart.
Namaste.

BTC has made the perfect market conditions for a trade. BTC setup is very clear. Why? Because the structure is clear. The current price is an inflection point; both bears and bulls are watching to make their next move. May the strongest of the two prevail. 95k or 110k?
Full TA: Link in the BIO
HelenP. I Bitcoin can correct to trend line and start move upHi folks today I'm prepared for you Bitcoin analytics. In this chart, we can observe how the price developed a gradual upward trend, respecting the trend line as dynamic support multiple times. After each interaction with this line, the price showed a consistent pattern of rebounding and continuing its upward movement. Recently, the price faced a notable correction, which pushed it back toward this trend line once again, a critical zone that has proven its relevance as a support area. Upon touching the line, the market reacted with a bounce, signaling that buyers are still active and defending the structure. The price began to climb again, regaining some momentum, though it hasn’t yet managed to break the previous highs. Now BTCUSD is hovering near the ascending trend line, preparing for what could be another retest. If the trend holds, we may see a short-term decline toward this line, followed by a bullish rebound. I expect the price to push higher from this level, targeting the resistance zone near 108300, which also acted as a rejection area in the past. If you like my analytics you may support me with your like/comment ❤️
Disclaimer: As part of ThinkMarkets’ Influencer Program, I am sponsored to share and publish their charts in my analysis.

Bitcoin may rebound from support line of wedge and start to growHello traders, I want share with you my opinion about Bitcoin. Initially, the price was trading inside a well-defined range, moving sideways with repeated rejections from both support and resistance. After several attempts to stay above the support zone, BTC finally broke down and sharply declined below the 104000 level, entering the buyer zone. However, the decline was short-lived. Price quickly rebounded from the lower boundary and formed a strong bullish candle, suggesting that buyers were still active. After this recovery, BTC began forming a wedge pattern, with a gradually narrowing structure between the resistance line and the ascending support line. This kind of price action typically signals a buildup of pressure and potential breakout. Currently, BTC is once again testing the support line of the wedge and hovering near the buyer zone, where it previously reversed. This level has proven significant and is now being retested. Given the current structure, the wedge formation, and price behavior near the support, I expect BTC to rebound from this zone and start climbing back toward the upper resistance area. My current TP 1 is set at 106800 points, which aligns with the mid-level of the previous impulse zone and the inner resistance of the wedge. Please share this idea with your friends and click Boost 🚀
Disclaimer: As part of ThinkMarkets’ Influencer Program, I am sponsored to share and publish their charts in my analysis.

Bitcoin Strategic Interval – Latency & Asymmetric Bias.⊢
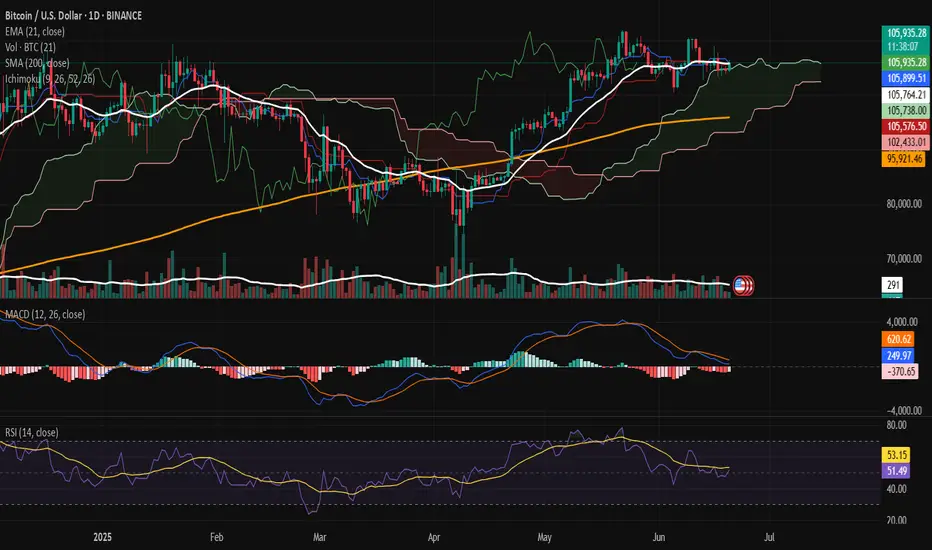
⟁ BTC/USD – Binance – (CHART: 1D) – (June 20, 2025).
⟐ Analysis Price: $106,025.88.
⊢
⨀ I. Temporal Axis – Strategic Interval – (1D):
▦ EMA21 – ($105,772.44):
∴ The price remains fractionally above EMA21, retaking the short-term reactive axis;
∴ Despite prior rejection, current candle shows renewed traction with a solid close above;
∴ The slope is flat–rising, signaling the potential reactivation of local trend continuation.
✴️ Conclusion: EMA21 is tentatively reclaimed – a short-term bullish signal under close scrutiny.
⊢
▦ SMA200 – ($95,921.92):
∴ Long-term structure preserved: price maintains a wide buffer over SMA200;
∴ The moving average exhibits a healthy upward slope, uninterrupted since Q4 2023;
∴ No technical threat detected to the macro-trend structure.
✴️ Conclusion: SMA200 acts as the primary institutional defense line. No stress present.
⊢
▦ Ichimoku Cloud – (105,899 | 105,738 | 102,433 | 105,576 | 106,025):
∴ Price is nestled precisely within the flat upper cloud band – a known zone of consolidation;
∴ Span A and B are beginning to flatten, suggesting temporary exhaustion of momentum;
∴ Chikou remains above price – confirming trend integrity.
✴️ Conclusion: Ichimoku signals a pause, not a break – directional clarity pending.
⊢
▦ MACD (12,26,9) – (Histogram: -364.87 | MACD: 257.20 | Signal: 622.06):
∴ Bearish histogram remains negative, but shrinking for three sessions;
∴ MACD line curling upward with initial convergence to Signal line;
∴ Reversal signal forming but not yet triggered.
✴️ Conclusion: Early signs of MACD cross; confirmation requires follow-through.
⊢
▦ RSI – (53.17 | Avg: 51.74):
∴ RSI reclaims neutral-positive zone, stabilizing above 50;
∴ Structure shows divergence fading, with momentum recovering slowly;
∴ Still far from exhaustion thresholds.
✴️ Conclusion: RSI favors the bulls with cautious optimism.
⊢
▦ Volume (Last 5 Days):
∴ Volume remains muted, averaging 110–120k Bitcoin/day;
∴ No aggressive buy or sell pressure confirmed;
∴ Current move lacks conviction – suggests passive spot activity.
✴️ Conclusion: Price is advancing without volume confirmation – fragility persists.
⊢
🜎 Strategic Insight – Technical Oracle:
∴ Structural trend remains intact and undisturbed on the macro scale;
∴ Short-term bullish reclaim of EMA21 within the cloud, but momentum and volume still lag;
∴ Absence of conviction demands validation from price action or macro catalyst.
⊢
∫ II. On-Chain Intelligence – (Source: CryptoQuant):
▦ 🝰 Exchange Inflow Mean - (MA7):
∴ Metric sits near historic lows (≈0.4 BTC), denoting multi-week suppression of inflows;
∴ Correlates directly with reduced sell-side pressure from whales and institutions;
∴ Price structure remains unchallenged by inflow spikes – consistent with strategic holding.
✴️ Conclusion: Absence of fear or distribution among large holders – bullish backdrop intact.
⊢
▦ 🜍 Estimated Leverage Ratio – (Current: 0.259):
∴ Leverage steadily increasing, now entering historical danger zone;
∴ Elevated risk of cascade liquidations on any sharp downside move;
∴ Suggests the current rally is not organically fueled by spot demand.
✴️ Conclusion: Price structure is leveraged, not grounded – risk of synthetic instability.
⊢
▦ 🝗 Exchange Reserves - (Binance) – (≈544.5K BTC):
∴ Continuous net outflows – multi-month drain confirmed;
∴ Reflects silent accumulation or self-custody migration;
∴ No exchange-driven supply pressure visible.
✴️ Conclusion: Structural supply depleting – passive bullish signal.
⊢
▦ ⚒ Miners’ Position Index - (MPI) – (-1.1):
∴ Readings below 0 indicate minimal miner distribution;
∴ Suggests miners are confident, or at least not forced to sell at current levels;
∴ Historically coincides with market support zones.
✴️ Conclusion: Miner behavior aligned with trend preservation – not resistance.
⊢
▦ 🜚 Funding Rate - (All Exchanges) – (+0.003):
∴ Rates mildly positive, indicating slight dominance of long positioning;
∴ No excessive funding imbalance – healthy sentiment baseline;
∴ Reflects controlled bullish bias with no speculative overheating.
✴️ Conclusion: Longs exist, but not in a way that endangers trend integrity.
⊢
🜎 Strategic Insight – On-Chain Oracle:
∴ On-chain metrics echo the technical chart: structurally sound, short-term vulnerable;
∴ Long-term holders remain disengaged from distribution behavior;
∴ The system is healthy, but carries hidden leverage that may trigger volatility.
⊢
⧉ III. Contextvs Macro–Geopoliticvs – Interflux Economicus:
▦ 🇺🇸 United States – Federal Axis & Risk Channels:
∴ Treasury Yield Curve remains slightly positive (+0.44%), removing short-term recession signal;
∴ 10Y yield elevated at 4.42% – reflects sustained inflation resistance and risk demand;
∴ Fed has signaled no rate cuts before September – QT policy remains;
∴ Speculative expectations for only 1–2 cuts in 2025;
∴ Trump administration signals potential military action in Iran, igniting geopolitical risk premium.
✴️ Conclusion: U.S. monetary regime is steady–tight; geopolitical volatility injects asymmetric risk into crypto valuations.
⊢
▦ 🇨🇳 China – Internal Stimulus & Soft Deflation:
∴ Industrial Production slows to +5.8% YoY – weakest in 6 months;
∴ Retail sales climb to +6.4% YoY due to stimulus programs ("618 event", consumption vouchers);
∴ PPI remains deflationary (-3.3% YoY), compressing industrial margins;
∴ Fiscal revenue down -0.3% YTD – signals internal fragility despite easing efforts.
✴️ Conclusion: China is applying targeted stimulus, but lacks decisive global impact – neutral crypto flow effect.
⊢
▦ 🇪🇺 European Union – Disinflation & Rate Reversal:
∴ HICP inflation falls to 1.9% – below ECB’s 2.0% target;
∴ ECB cuts deposit rate by 25bps – now 2.00%;
∴ PMI Composite remains below 50 – economic contraction underway;
∴ ECB forward guidance signals data-dependence and hesitation for further cuts.
✴️ Conclusion: Europe is easing rates amidst stagnation – weak driver for global risk flows.
⊢
🜎 Strategic Insight – Interflux Macro Oracle:
∴ U.S. tight policy + Iran tension = dual pressure point on risk assets;
∴ China’s mild stimulus is not yet globally inflationary – no volatility trigger;
∴ EU drifts silently – supportive, but irrelevant to Bitcoin in current configuration;
∴ Global system is stable in appearance, but tactically charged beneath – setup aligns with Bitcoin volatility potential.
⊢
IV. ♝ Market Sentiment - Media & Institutional Lens:
▦ The Block – Corporate Stockpiling Thesis:
∴ Ongoing accumulation of Bitcoin by public and private entities continues across Q2;
∴ Institutional wallets showing strategic DCA behavior – interpreted as positioning for either macro easing or geopolitical hedge;
∴ Unlike past cycles, no major corporate selloffs have been detected.
✴️ Conclusion: Institutional base remains in passive accumulation – potential catalyst insulation.
⊢
▦ CoinDesk – Sentiment Report – BTC at $92K Risk Threshold:
∴ Despite price climbing above $106K, analysts caution of technical rejection scenarios;
∴ Zones near $92K identified as high-liquidity, high-reaction clusters;
∴ Chart analysis frames current movement as vulnerable if macro catalysts turn hawkish.
✴️ Conclusion: Sentiment remains cautiously bullish but alert to correction windows.
⊢
▦ InfoMoney – U.S. Military Risk – Iran Strike Potential:
∴ Reported internal briefing of U.S. military planning toward Iranian targets;
∴ Trump’s media team leveraging geopolitical strength posture to influence sentiment;
∴ Markets (Dow Futures) showing pre-market decline on the headline.
✴️ Conclusion: Bitcoin holds narrative premium under geopolitical fear – but risk surge remains volatile.
⊢
🜎 Strategic Insight – Media Oracle:
∴ The crypto narrative is suspended between structural trust (institutional accumulation) and external fear (macro-political instability);
∴ Bitcoin presently benefits from asymmetric narrative positioning — but lacks transactional confirmation;
∴ Media flows suggest that sentiment will pivot swiftly if Powell’s tone confirms further hawkish stance or if Iran tension escalates.
⊢
⊢
⚜️ Magister Arcanvm (𝟙⟠) – Vox Primordialis!
⚖️ Wisdom begins in silence. Precision unfolds in strategy.
⊢
⌘ Codicillus Silentii – Strategic Note:
∴ The 1D reclaim of EMA21 inside the Ichimoku flat cloud reflects a market in suspended potential, where trend continuation and failure share equal weight;
∴ On-chain dynamics remain structurally undisturbed, yet veiled in a fragile layer of leveraged positioning;
∴ Exchange reserves continue their descent, detaching the market from traditional sell-side threat, but increasing reliance on thin liquidity zones;
∴ Macro vectors (Fed policy + Middle East tension) hover as dual shadows, capable of igniting volatility without prelude;
∴ Institutional accumulation remains active, but no longer decisive - the market awaits external ignition, not internal strength;
∴ Sentiment is asymmetrically bullish, yet explicitly unconfirmed in transactional volume and price aggression;
∴ The system is quiet - not because it is resolved, but because it is observing itself. This is a moment of ritual latency.
⊢
⌘ Market Status – Tactical Mode:
✴️ Strategic Position: “Structurally Bullish – Tactically Suspended”;
✴️ Primary Mode: “Observation Priority”;
✴️ Tactical Stance:
∴ No active positioning expansion without confirmation beyond Ichimoku flat zone;
∴ Watch for MACD confirmation and volume acceleration;
∴ Monitor geopolitical escalation and Powell’s tone – both capable of shifting structural balance.
✴️ Directional Bias: Neutral–Bullish, contingent upon validation;
✴️ Key Zone of Collapse Risk: $92,000;
✴️ Ascent Gate: $110,800 + (confirmation threshold).
⊢
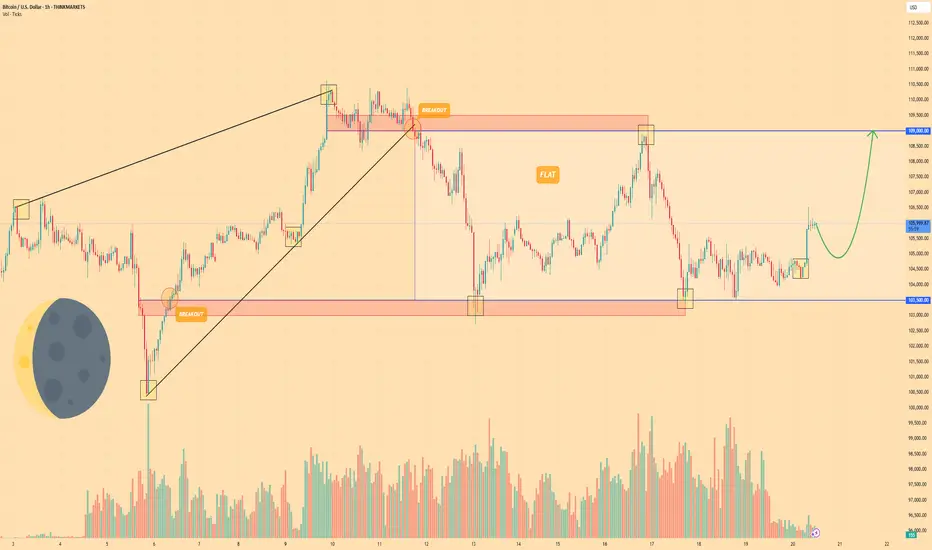
BITCOIN - Price can continue grow inside flat to $109000 levelHi guys, this is my overview for BTCUSD, feel free to check it and write your feedback in comments👊
A few days ago, the price entered a wedge, declining below the $103500 level and then making a strong impulse up.
Next, price broke $103500 level one more time and rose to resistance line of wedge, after which started to decline.
BTC broke $109000 level and started to trades inside a flat, where it declined to support level and then bounced up.
Price rose to resistance level, which is top part of flat, and then at once dropped back and started trading close.
But some time later, price bounced from this level and started to grow, and even now it continues to grow.
So, I think that BTC can make a small correction movement and then continue to grow to $109000 level.
If this post is useful to you, you can support me with like/boost and advice in comments❤️
Disclaimer: As part of ThinkMarkets’ Influencer Program, I am sponsored to share and publish their charts in my analysis.
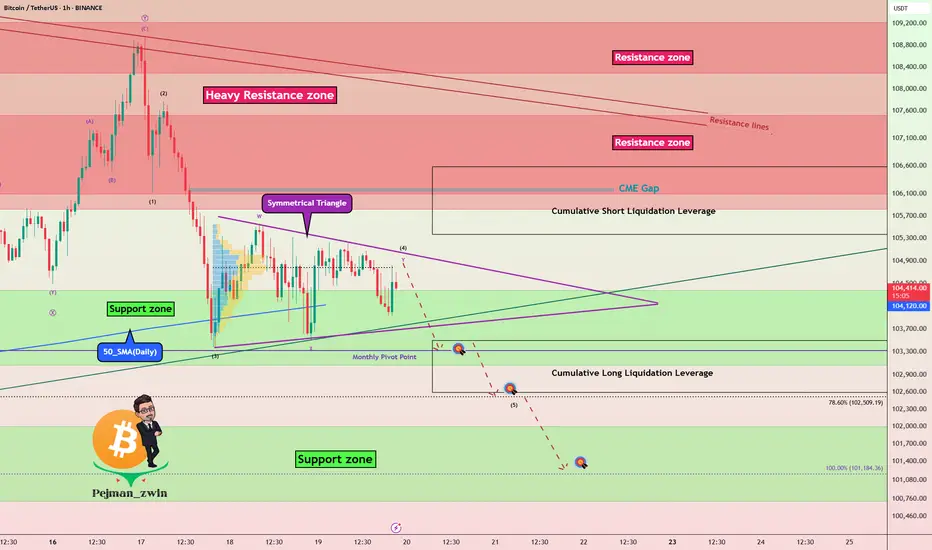
BTC - Key Battle Between Bulls and Bears – Symmetrical TriangleBitcoin ( BINANCE:BTCUSDT ) is currently consolidating within a Symmetrical Triangle , showing indecision among Bulls and Bears around the Support zone($104,380-$103,060) and just above the 50_SMA (Daily) .
From an Elliott Wave perspective, the current range may represent a WXY corrective structure . The market seems to be waiting for a breakout direction , potentially aiming to complete wave 5 after this correction.
The Monthly Pivot Point($103,300) and the presence of significant Cumulative Liquidation Leverage Zones (both Long and Short ) are key liquidity magnets to watch in the short term .
I expect Bitcoin to re-attack the Support zone($104,380-$103,060) AFTER breaking the lower line of the Symmetrical Triangle Pattern and decline to the targets I have outlined on the chart.
Note: Stop Loss: $106,703 = Worst Stop Loss(SL)
Please respect each other's ideas and express them politely if you agree or disagree.
Bitcoin Analyze (BTCUSDT), 1-hour time frame.
Be sure to follow the updated ideas.
Do not forget to put a Stop loss for your positions (For every position you want to open).
Please follow your strategy and updates; this is just my Idea, and I will gladly see your ideas in this post.
Please do not forget the ✅' like '✅ button 🙏😊 & Share it with your friends; thanks, and Trade safe.