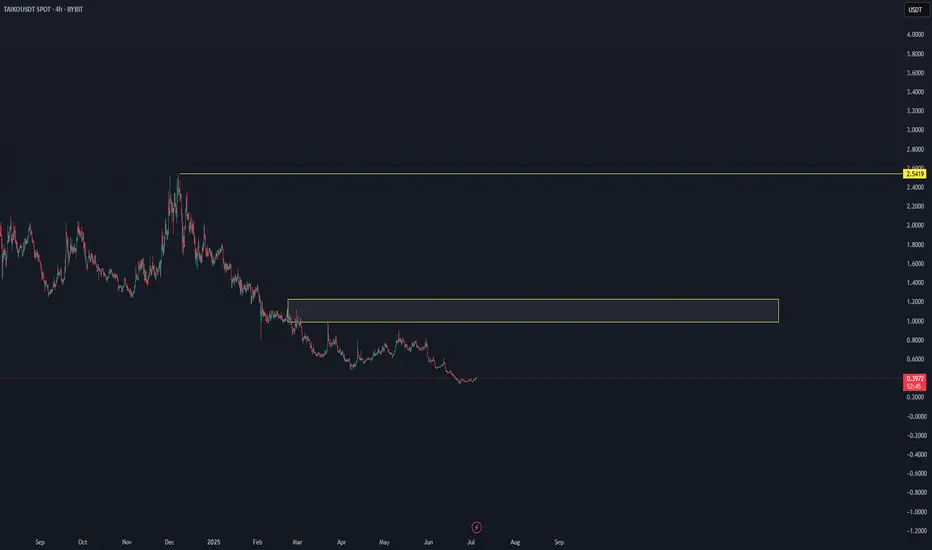
TAIKO/USDT NEW INCREASE VIEWThe latest data shows that this coin is entering a new uptrend, which can be confirmed in the coming time frames, see the last update.
In trading, it's about building a real, confirmed trend, starting with building and holding levels.
The keys are: Start of a new cycle, start of new smart money
This coin is at the first level of scan, and time frames should confirm if it's an interesting coin or not. Until now, there is no confirmation; only the first scan shows it can be interesting.
* This coin is a high-risk coin.
BTC-M
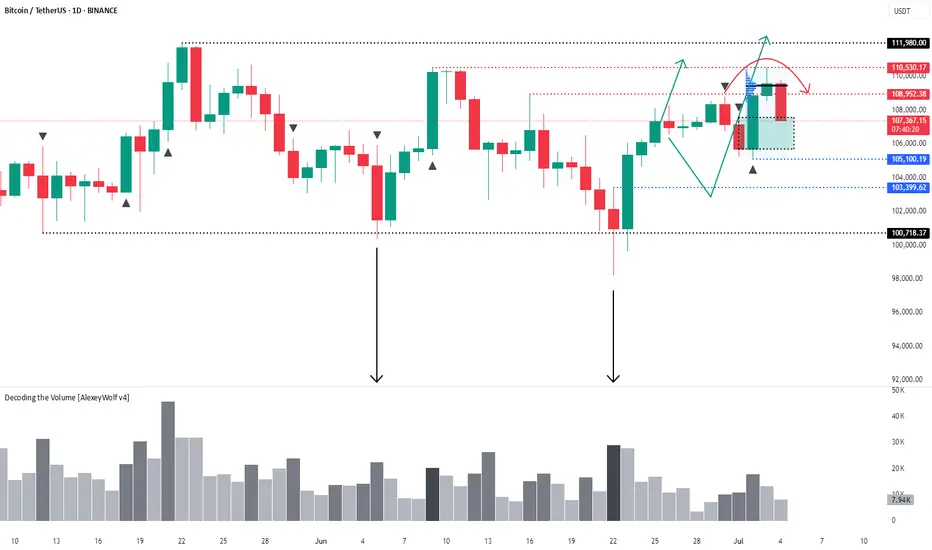
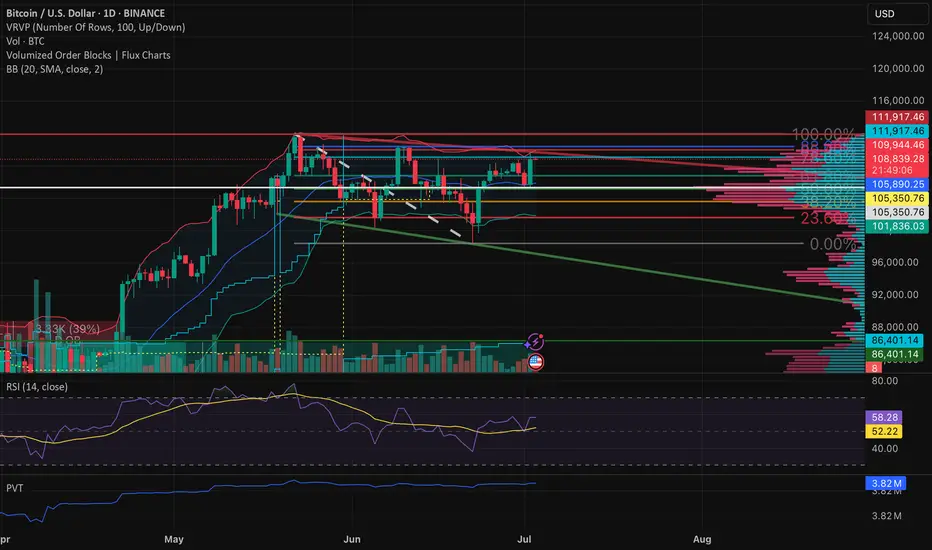
Final move by the bears? Bulls lining up for ATHHi traders and investors!
Buyers have reached the first target at 108,952.
On Binance spot, BTC missed the second target (110,530.17) by just 99 cents.
Is this a setup for a breakout and a run toward a new ATH?
So far, the price action looks like a level manipulation around 108,952: volume in all 3 bars interacting with this level is concentrated above it.
Just below lies a buyer zone (107,500 – 105,100).
I am watching for buyer reaction once the price reaches this area.
This analysis is based on the Initiative Analysis concept (IA).
Wishing you profitable trades!
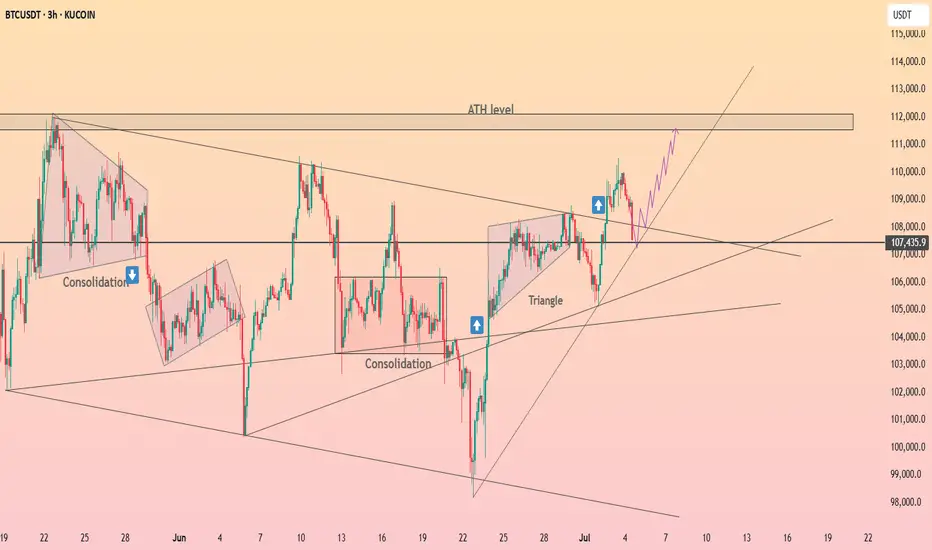
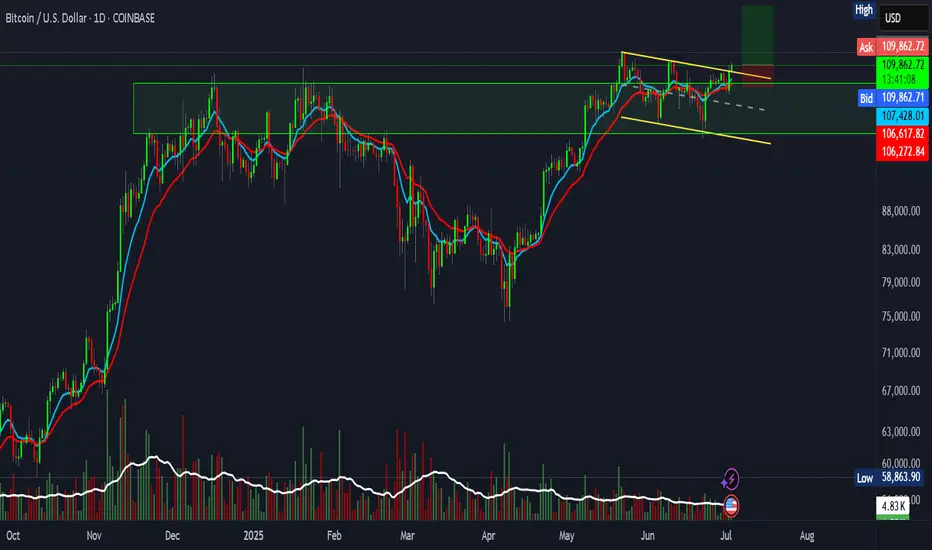
HolderStat┆BTCUSD retesting of the trend lineKUCOIN:BTCUSDT has pushed above 107,000 and reclaimed key levels after breaking from triangle and consolidation zones. Structure supports a move toward the 112,000 resistance zone (ATH). Higher lows and strong rallies continue to define the trend.
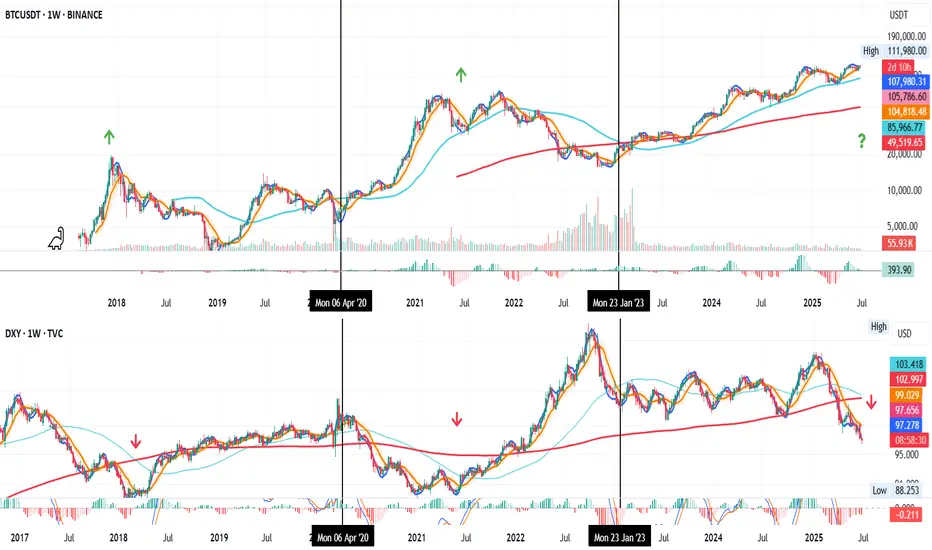
BTC vs DXY – Macro Setup at a Crossroads
Looking at BTC and DXY on the weekly, we’ve seen 3 key periods so far. In the first two, the pattern was clear: BTC went up, DXY went down.
Now we’re in the third period: what’s next?
👉 Has the move already played out?
👉 Is it happening now?
👉 Has DXY bottomed and BTC topped, or will DXY go lower while BTC climbs?
Macro conditions may help guide us.
BTC looks strong — supported by ETF inflows, on-chain strength, and institutional demand.
DXY looks weak — with softer economic data and rising expectations for rate cuts.
In my view, tariffs are likely to weigh heavier on DXY than BTC, favoring more upside for BTC.
The recent Big Beautiful Bill could also add fuel to BTC while adding pressure on DXY.
Always take profits and manage risk.
Interaction is welcome.
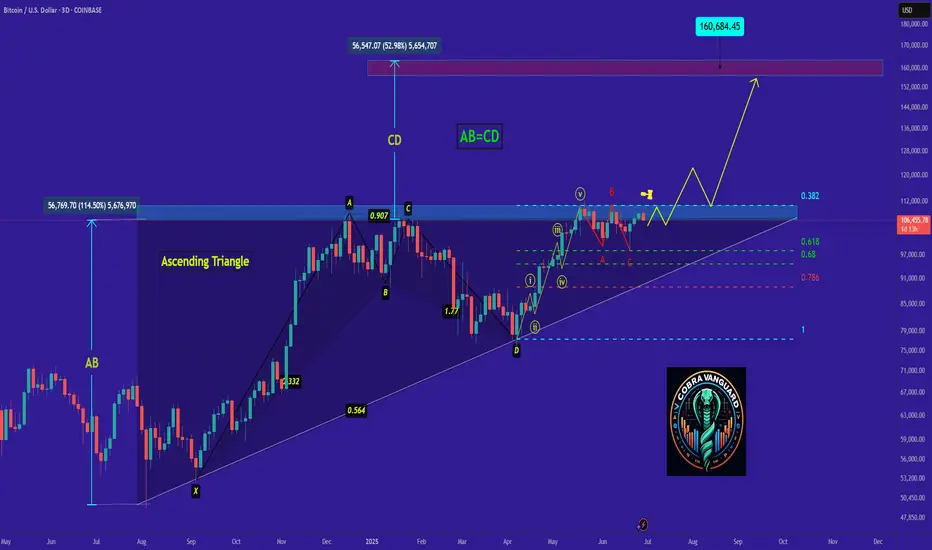
"BTC - Time to buy again!" (Update)Bitcoin is now at a point where it cannot be ignored! In my view, the bullish wave has started after the corrective wave ended. This wave could continue until it breaks the ascending triangle, then with a slight correction, push the price upward again. The current period and the coming days could be crucial in determining the market's trend.
Best regards CobraVanguard.💚
ETH could be about to rip into a short-term rallyWhile the stock market has seen surprising upside in the past weeks (presumably due to pricing in rate cuts / a more positive liquidity picture / high expectations for Q2), crypto has lagged behind. I don't believe anything significantly above current prices - no matter in which market - is sustainable for now, but we can certainly milk it for whatever it's worth.
Notably, BTC has shown way more resilience and dominance in the current cycle so far. This makes sense in a high interest environment. However, within the bias of the markets pricing in expectations for rate cuts and as such more liquidity, we could also assume that demand for assets other than "safe havens" would now increase as well, leading us to the biased conclusion that we could see altcoins wildly outperforming BTC over the next weeks.
Indeed, if we look at the BTC chart, technicals such as VWAP stddevs show significantly less potential for upside if compared to ETH in the current moment in time. We therefore would focus on ETH at this point (as money flow seems to cycle BTC->ETH->Others).
PLEASE NOTE: SL and TP are not accurate. This is not a precise trading idea. Please use your own judgement in accordance with your trading style.
A Comprehensive Analysis !!!This market has shown disregard for technical patterns, and every time the price approaches historically significant levels, it reveals its true intentions and disappoints us. This cycle tends to repeat.
In my opinion, we’re likely to see one more drop in Bitcoin’s price. After that, instead of continuing the expected downtrend from the pattern, the price could break the descending formation and experience a strong upward move.
Stay Awesome , CobraVanguard.
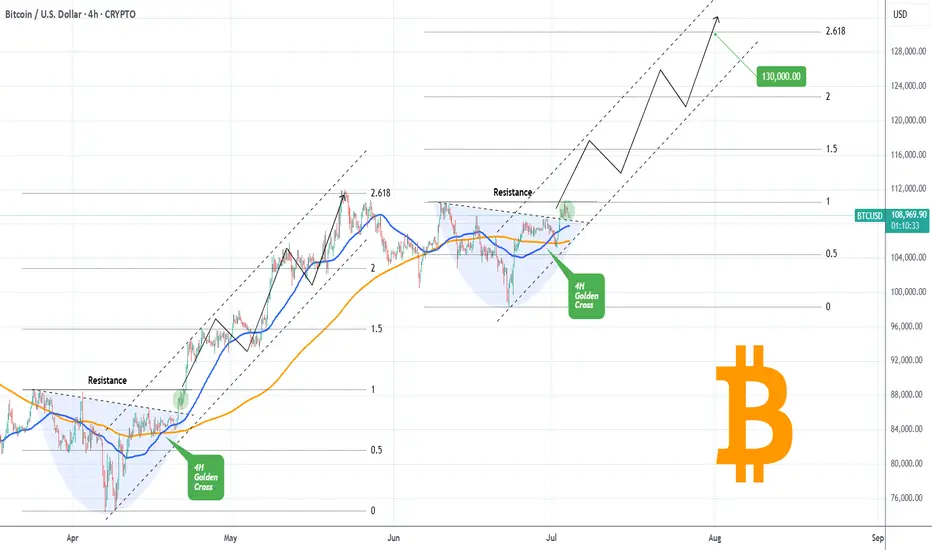
BITCOIN Golden Cross going to slingshot it to $130kBitcoin (BTCUSD) has completed a Golden Cross on the 4H time-frame and is attempting to keep the 4H MA50 (blue trend-line) as Support. If successful, it has high probabilities of staging a Channel Up similar to April - May, which peaked on the 2.618 Fibonacci extension.
So far, the bases of those to fractals are virtually identical, with a Lower Highs trend-line initially acting as a Resistance, which broke and on the current one it is testing the final Resistance (dotted trend-line).
This is the green circle, which on April 21 staged a quick consolidation before breaking aggressively upwards. If the pattern continues to repeat itself, we can get $130k (Fib 2.618 ext) at the end of the Channel Up.
Do you think it will? Feel free to let us know in the comments section below!
-------------------------------------------------------------------------------
** Please LIKE 👍, FOLLOW ✅, SHARE 🙌 and COMMENT ✍ if you enjoy this idea! Also share your ideas and charts in the comments section below! This is best way to keep it relevant, support us, keep the content here free and allow the idea to reach as many people as possible. **
-------------------------------------------------------------------------------
💸💸💸💸💸💸
👇 👇 👇 👇 👇 👇
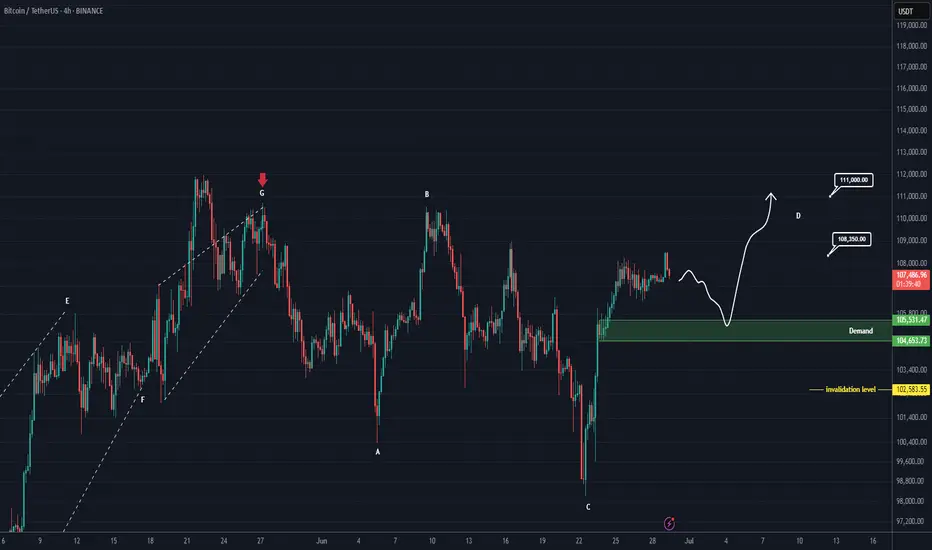
Bitcoin New Update (4H)This analysis is an update of the analysis you see in the "Related publications" section
If we were to publish an update for Bitcoin, wave D could move toward higher levels.
After hitting the green zone and gaining momentum, it could once again move upward to liquidate short positions.
In this update, we've naturally raised and revised the invalidation level.
The new targets have been marked on the chart.
A daily candle closing below the invalidation level would invalidate this analysis.
For risk management, please don't forget stop loss and capital management
Comment if you have any questions
Thank You
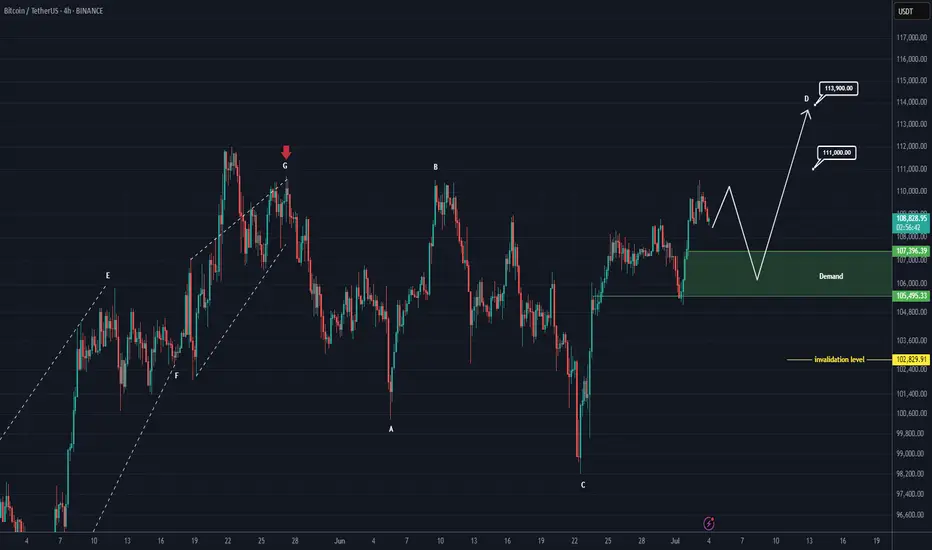
BTC Analysis (4H)This analysis is an update of the analysis you see in the "Related publications" section
Since the red arrow was placed on the chart, Bitcoin's bullish phase has ended and it has entered a corrective phase. This correction appears to be forming a Diametric pattern, and we are currently in the middle of wave E.
After interacting with the demand zone, the price may move toward the specified targets.
A daily candle closing below the invalidation level will invalidate this analysis.
For risk management, please don't forget stop loss and capital management
Comment if you have any questions
Thank You
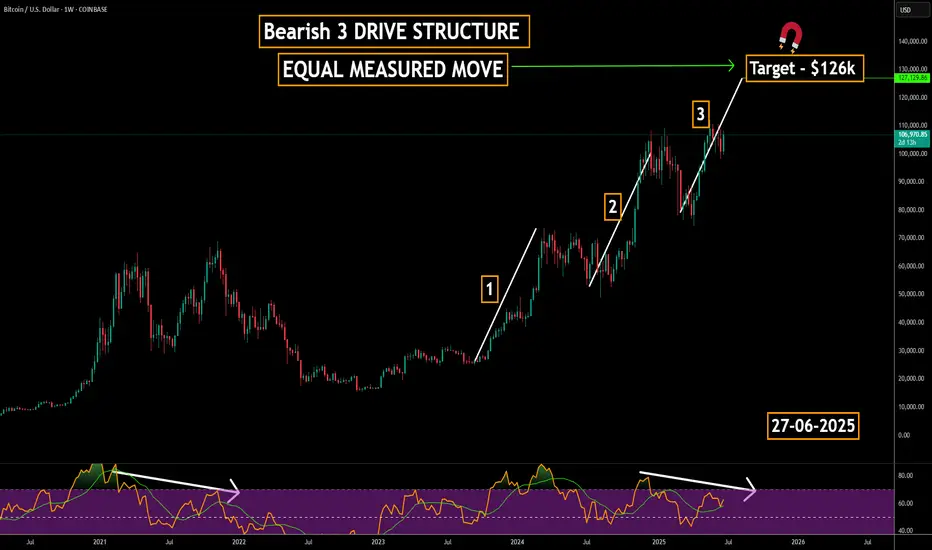
MACRO 3-Drive Pattern on Bitcoin | Major Reversal Ahead?Is Bitcoin completing a massive 3-drive structure on the macro chart?
Three clear pushes higher, each with fading momentum, are flashing a major reversal signal.
This could be the final phase before a long-term shift — are you ready for what’s next?
📚 3-Drive Structure Trading Strategy — Full Breakdown
The 3-Drive Pattern is a powerful reversal-based price structure used to spot major turning points in trending markets. It works by identifying three consecutive drives (or pushes) in one direction, typically ending with exhaustion and a high-probability reversal.
Each drive forms a new high or low, but with weakening momentum — especially visible using RSI, MACD, or volume divergence.
🔍 What is the 3-Drive Pattern?
3 consecutive higher highs (or lower lows)
Each drive followed by a shallow pullback
Momentum weakens on each push (divergence forms)
Fibonacci symmetry often present:
- Drive extensions: 127.2%–161.8%
- Pullbacks: usually 61.8%
📉 Bearish 3-Drive (Reversal from Uptrend):
Drive 1: Price makes a higher high with strong momentum
Drive 2: Another higher high, weaker strength
Drive 3: Final high with clear divergence
Reversal: Entry when price breaks below structure
🎯Entry Criteria:
Wait for all 3 drives to form
Confirm with divergence on Drive 3
Use a confirmation candle or structure break
Stop-loss: just beyond the 3rd drive’s high
🎯 Targets:
Conservative: Return to Drive 2 base
Aggressive: Full trend reversal (50%–100% Fib retracement)
🧠 Pro Tips:
Best on 4H, 1D, 3D or 1w timeframes
Confirm with RSI, MACD, or volume divergence
Combine with key S/R or supply-demand zones
💡 Summary:
The 3-Drive pattern is one of the most reliable reversal structures when combined with divergence and Fibonacci symmetry. It's especially powerful at market exhaustion zones and works best with confirmation-based entries.
BTC Setup: 2.7 R:R"Bitcoin Poised for New Uptrend After Bull Flag Breakout Retest"
Bitcoin appears ready to begin a new uptrend after successfully retesting the breakout from a bull flag pattern and completing consolidation above key support.
This setup offers a 2.7:1 risk-to-reward ratio, with the following trade parameters:
Entry: $109,965.79
Stop Loss: $106,300
Target: $120,000
BTC - Will the Bearish Channel continue?Market Context
After a strong impulsive rally earlier in the year, BTC has been trading within a descending channel on the daily timeframe. This corrective structure suggests a period of consolidation and redistribution, as price oscillates between the channel's boundaries. The repeated rejection from the upper trendline and the inability to break through key highs reinforce the bearish bias in this structure.
Buy Side Liquidity Sweep Potential
Price is currently positioned just beneath a relatively clean swing high, sitting above the mid-range of the channel. This high represents a clear area of Buy Side Liquidity—stop losses from short positions and pending breakout orders from longs are likely clustered there. An engineered sweep of this high would serve as a strategic move for larger participants to collect liquidity before driving price lower.
Fair Value Gap as a Pivot Point
Beneath current price lies a Fair Value Gap—a visible inefficiency formed during a fast upward move earlier in the structure. This Gap remains unfilled and offers a compelling target for price once the Buy Side Liquidity Sweep occurs. It represents a logical zone for price to rebalance before deciding on continuation or reversal. Should price break below the Gap cleanly, it would confirm the bearish intent and potentially accelerate toward the lower bounds of the channel.
Channel Continuation Structure
The overall geometry of the channel remains intact, and the price respecting both upper and lower boundaries strengthens the likelihood of a continuation toward the downside. If the Buy Side Liquidity Sweep and subsequent rejection occur, the market could be poised for another leg lower—possibly seeking the next structural support closer to 90,000 or even toward the lower extremities of the channel around 80,000–82,000.
Final Thoughts
This chart reflects classic price delivery behavior: corrective structure, engineered liquidity sweeps, and the magnetic pull of inefficiencies like Fair Value Gaps. Whether you’re actively trading or simply observing, this is a clean, educational setup to learn from.
If this breakdown helped you see the market a bit clearer, I’d really appreciate a like. And feel free to share your thoughts or counterviews in the comments—your insights make the analysis even more valuable.

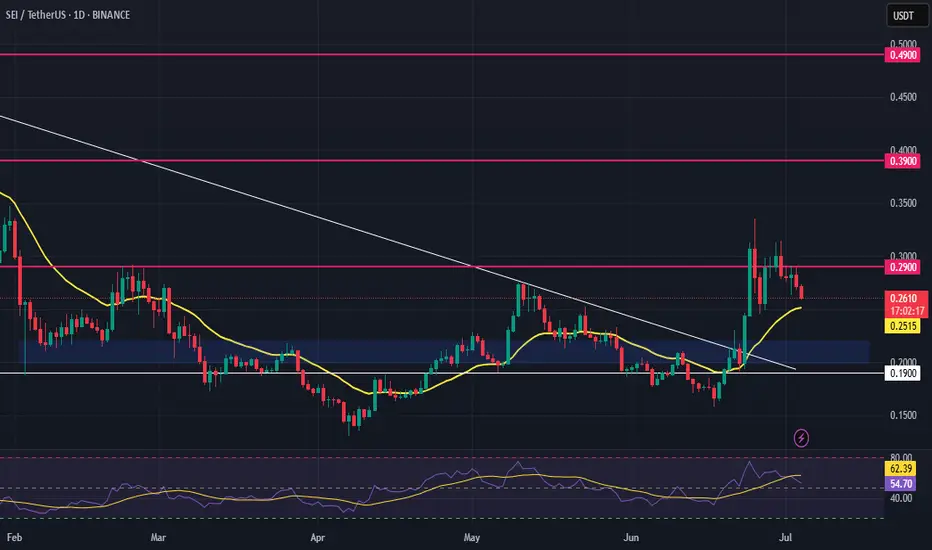
SEI Long – Breakout with Relative Strength & Trend ContinuationSEI is showing strong relative strength and has just broken out of recent structure. We’re watching for a higher low to form above the $0.22 zone, confirming trend continuation and unlocking upside liquidity.
📌 Trade Setup:
• Entry Zone: Around $0.22
• Take Profit Targets:
o 🥇 $0.29
o 🥈 $0.39
o 🥉 $0.49
• Stop Loss: Daily close below $0.19
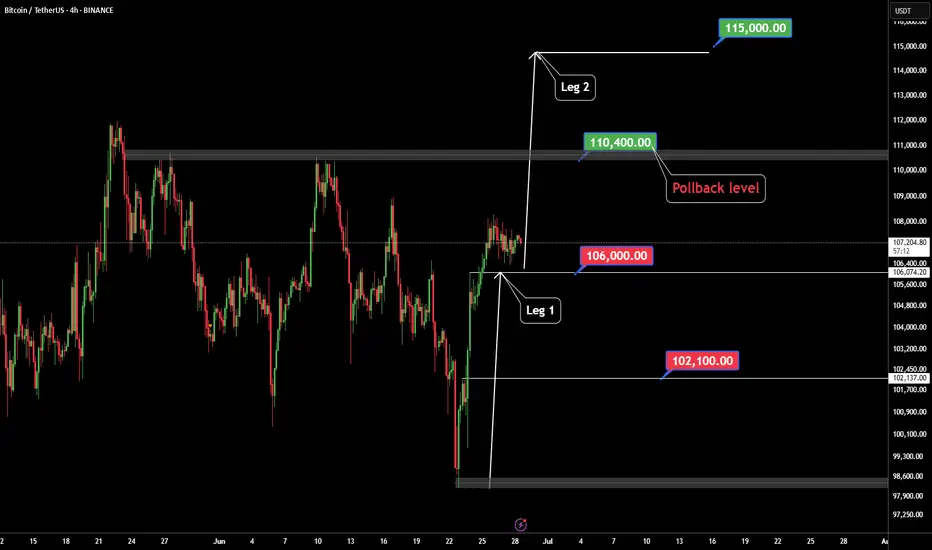
BTC Leg2 115KBINANCE:BTCUSDT major movement from base 98K S to 106K $.BTC want to next movement to 115K $ but in middle of way 110K $ level there are sellers.
Support: 106.000 - 102.000
Resistance: 110.400 - 115.000
⚠️Control Risk Management
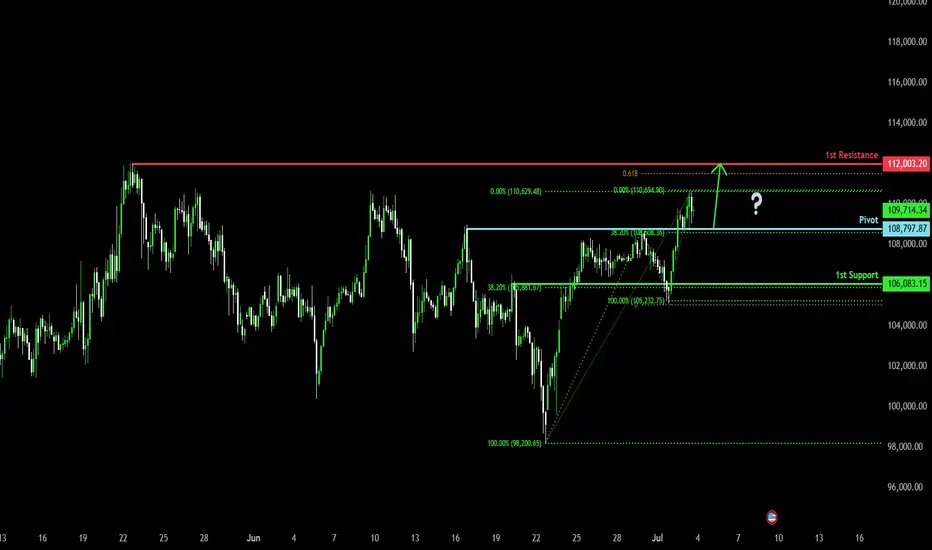
Bullish bounce for the Bitcoin?The price is falling towards the pivot which is a pullback support and could bounce to the 1st resistance.
Pivot: 108,797.87
1st Support: 106,083.15
1st Resistance: 112,003.20
Risk Warning:
Trading Forex and CFDs carries a high level of risk to your capital and you should only trade with money you can afford to lose. Trading Forex and CFDs may not be suitable for all investors, so please ensure that you fully understand the risks involved and seek independent advice if necessary.
Disclaimer:
The above opinions given constitute general market commentary, and do not constitute the opinion or advice of IC Markets or any form of personal or investment advice.
Any opinions, news, research, analyses, prices, other information, or links to third-party sites contained on this website are provided on an "as-is" basis, are intended only to be informative, is not an advice nor a recommendation, nor research, or a record of our trading prices, or an offer of, or solicitation for a transaction in any financial instrument and thus should not be treated as such. The information provided does not involve any specific investment objectives, financial situation and needs of any specific person who may receive it. Please be aware, that past performance is not a reliable indicator of future performance and/or results. Past Performance or Forward-looking scenarios based upon the reasonable beliefs of the third-party provider are not a guarantee of future performance. Actual results may differ materially from those anticipated in forward-looking or past performance statements. IC Markets makes no representation or warranty and assumes no liability as to the accuracy or completeness of the information provided, nor any loss arising from any investment based on a recommendation, forecast or any information supplied by any third-party.
BTC – Holding or Rolling?BTC has pushed up from the late June low and is now testing the 78.6% Fibonacci retracement zone from the prior downswing. Price is currently sitting around 109.5K–110K, directly in a high-confluence rejection area. This level aligns with the top of the recent range, 78.6% retracement, Bollinger Band resistance, and the zone where the last breakdown began.
While the move resembles a double bottom or W-pattern on first glance, structure invalidates the bullish case:
The second low was lower than the first, breaking symmetry.
The second high is still lower than the June high near 111.9K.
RSI made a lower high while price made a higher high — classic momentum divergence.
Volume has not increased meaningfully on the bounce, suggesting a lack of strong buyer commitment.
Until BTC reclaims and holds above 111.9K on strong volume, this looks like a lower high inside a broader downtrend.
Short Setup Thesis
Entry Zone:
109.5K–110.5K (zone of rejection, aligned with 78.6% Fib and prior supply)
Stop Loss Zone:
Above 112K–113K (a full reclaim of prior highs would invalidate the setup)
Target Zones:
TP1: 102K–100K (local support range and prior consolidation area)
TP2: 97K–95K (Fibonacci cluster and volume shelf)
TP3: 91K–88K (structure low and potential sweep zone)
Break Trigger / Confirmation:
A daily close below 106K–105K would confirm bearish continuation. Weak retests into this zone would provide additional short entry opportunities.
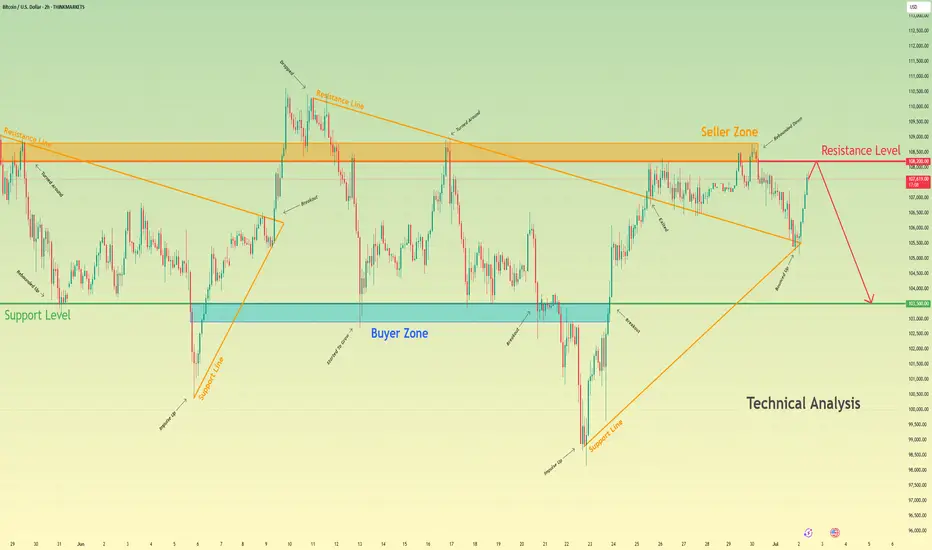
Bitcoin will drop from resistance level and fall to 103500 levelHello traders, I want share with you my opinion about Bitcoin. Some days ago, price entered the pennant, where it turned around from the seller zone, which coincided with the resistance level, and dropped to the 103500 support level. Then it bounced and tried to grow, but soon failed and dropped below the 103500 support level, which coincided with the buyer zone and reached the support line of the pennant. Following this movement, BTC experienced an upward impulse, breaking the 103,500 support level and subsequently exiting the pennant pattern, before rising to the resistance level. Price broke this level and then started to decline inside another pennant pattern. In this pattern, the price dropped top 103500 support level again and then tried to bounce back, but failed and continued to decline. In a short time, it fell to the support level, broke it, and then fell to the support line of the pennant. Next, BTC turned around and repeated an impulse up to the resistance line of the pennant and exited from this pattern. Then it rose to the seller zone, where it rebounded from it and fell, but recently it rebounded and started to grow. Now, I expect that price will reach the resistance level and then drop to the 103500 support level. For this case, this level is my TP. Please share this idea with your friends and click Boost 🚀
Disclaimer: As part of ThinkMarkets’ Influencer Program, I am sponsored to share and publish their charts in my analysis.
HolderStat┆BTCUSD ready to break through the resistanceBINANCE:BTCUSDT has completed another consolidation breakout and is coiling near key resistance. The price action points toward a move to 114,000 if the 102,000 level holds and volume confirms the continuation trend.
BTC BIG SHORT!We did a mirror retest, and many other signals also point to a sharp decline, indicating numerological codes 69/96.
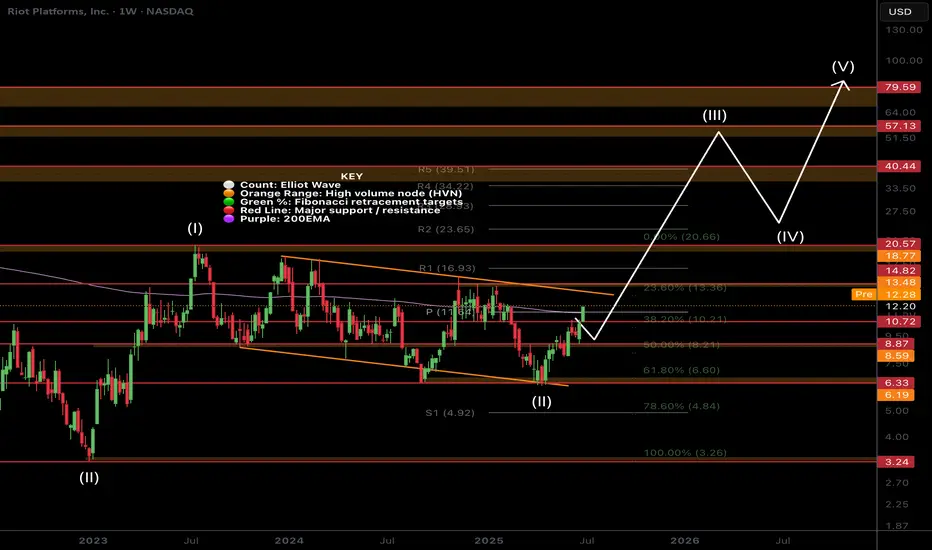
$RIOT Continues to Follow PathNASDAQ:RIOT Is sticking closely to the plan testing the bottom and top of the channel multiple times.
Price closing above the weekly 200EMA and weekly pivot Friday will be a very bullish signal. As we have over 4 tests of the upper boundary resistance there is a high probability we break through and continue higher in a high degree wave 3.
Initial targets are the weekly R5 pivot at $39 and all time high at range at $79.
Price tested the .618 Fibonnaci retracement in a complex correction for wave 2.
Analysis is invalidated below the channel support.
Safe trading
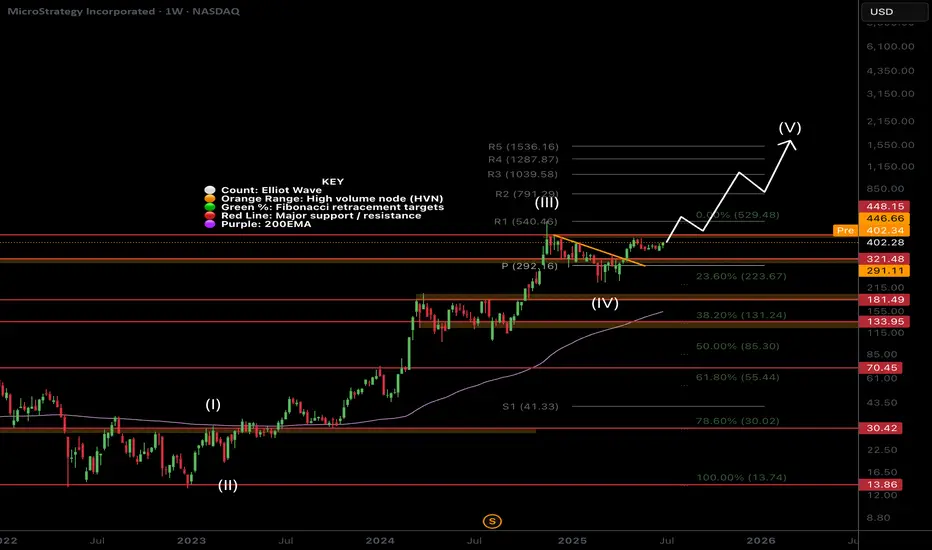
$MSTR Megatrend Continuation?NASDAQ:MSTR is market leader in the CRYPTOCAP:BTC strategic reserves strategy and has set the benchmark.
After a nearly 20x rally profit take is exceptive, price has held up extremely well through the last 6 months only dropping to the .236 Fibonacci retracement and weekly pivot. As Bitcoin continues into price discovery expect the MSTR rally to continue with renewed tailwinds.
It is an extremely hated stock as well as its collection of yield baring derivatives. The keeps the social mood / sentiment low which could prove further tailwind for growth.
I am looking at a terminal target this cycle of around $1500 at the R5 weekly pivot.
Safe trading
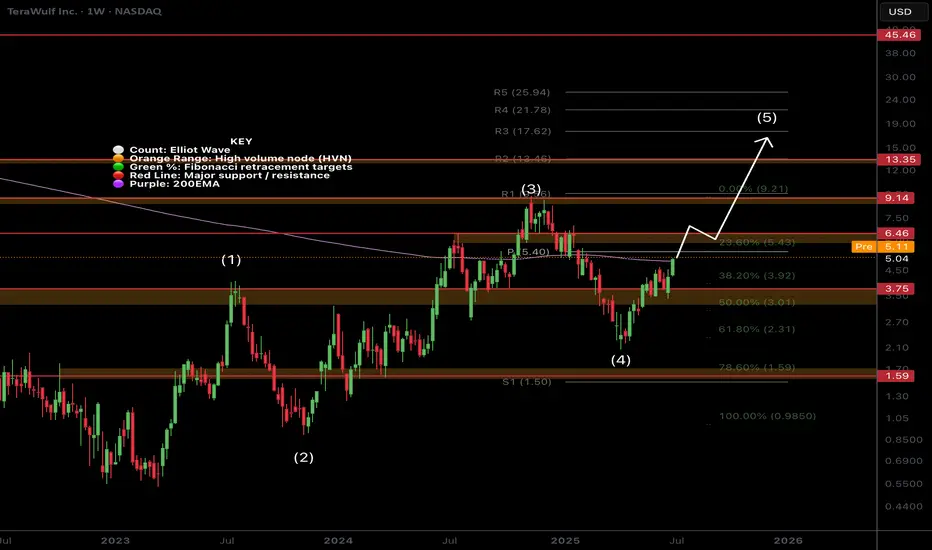
$WULF Critical Resistance!NASDAQ:WULF has had a great come back but has just hit a triple sword resistance: weekly 200EMA, weekly pivot and High Volume Node where I expect it to struggle for a while!
Are CRYPTOCAP:BTC miners the new altcoins?
Bullish continuation through these resistances will flip them to support and demonstrate fundamental resilience on an improving macro economic background overcoming technical analysis.
Long term tailwind potential can be as high a10x from here but more realistic targets are the R3 weekly pivot $17 and R5 weekly pivot at $25.
Analysis is invalidated below the high degree wave (4) of a leading (or ending) diagonal Elliot Wave pattern.
Safe trading