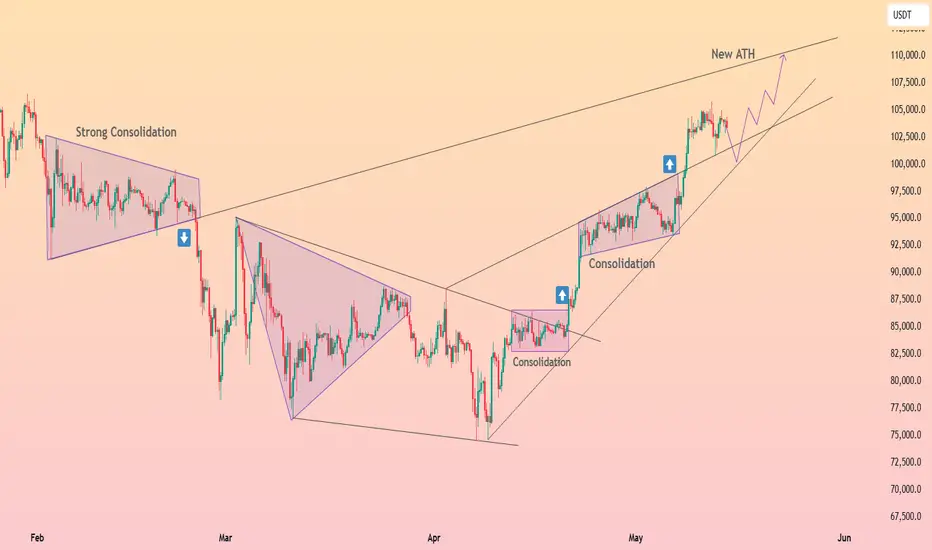
HolderStat┆BTCUSD channel run to 115kAfter February’s strong consolidation wedge cracked, Bitcoin price rebounded, carving a fresh ascending channel that sits snug on wedge support above 100 k. Each mini‑consolidation has resolved higher, and the current leg projects into the 112‑115 k new‑ATH rail drawn on the chart. Pullbacks toward 100‑102 k are structurally healthy so long as the lower trend‑line stays intact, keeping the broader BTC breakout narrative alive.
BTC-M
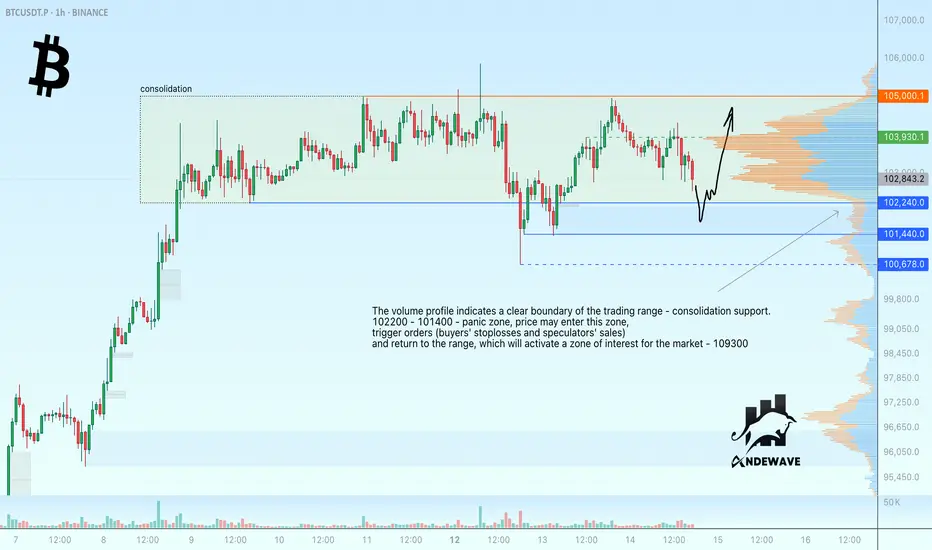
Bitcoin ready to test support before risingThe volume profile indicates a clear boundary of the trading range - consolidation support as a target for the current local movement.
102200 - 101400 - panic zone, price may enter this zone, provoke bids (buyers' stoplosses and speculators' sales) and return to the range, which will activate a zone of interest for the market - 103930.
Scenario: the price is trading inside the consolidation with clear boundaries - support and resistance. The price is aiming for the support within a bullish trend. False breakdown of support may trigger a rebound and growth. Target 103930 - 105000
Technical Analysis – Bitcoin (BTC/USD) 1H Chart + TRADE PLANThe chart displays a symmetrical triangle pattern, which is a neutral continuation pattern often leading to a breakout in the direction of the prevailing trend.
The current price action is at the apex of the triangle, suggesting an imminent breakout.
The price is currently testing the lower trendline support, with a visible weakening momentum.
Indicators Analysis:
VMC Cipher B Divergences: Showing bearish momentum with continued red wave dominance and lack of significant bullish divergence.
RSI (14): Bearish territory at 32.51, approaching oversold but no bullish divergence visible.
Money Flow Index (MFI): At 28.90, indicating weak buying pressure, leaning toward bearish continuation.
Stochastic Oscillator (14, 3, 3): In the oversold zone (1.49), which could indicate a short-term bounce is possible, but not confirmed by other indicators.
Volume:
Note that the chart mentions volume data is unavailable. Confirmation on volume spikes during breakout is essential to validate any move.
Scenarios and Targets
Scenario 1 – Bullish Breakout (Less probable based on current conditions)
Break above triangle resistance (approx. 102,300 USD).
Target 1: 107,500 USD (Measured move from triangle height).
Target 2: 115,500 USD (Extended target based on historical breakout levels and Fibonacci projection).
Confirmation needed: Clear breakout with high volume and RSI recovery above 50.
Scenario 2 – Bearish Breakdown (More probable currently)
Break below triangle support (approx. 101,300 USD).
Immediate Target 1: 97,000 USD (Measured move from triangle height).
Target 2: 93,500 USD (Previous major support zone).
Confirmation needed: Hourly candle close below support zone and breakdown with increased volume, RSI falling below 30, Stochastic remaining oversold.
Trading Plan
Bias: Bearish unless invalidated by bullish breakout confirmation.
Entry Strategy:
Aggressive short entry: On hourly candle close below 101,300 USD.
Conservative short entry: On confirmation below 101,000 USD with volume spike.
Stop-Loss:
Above 102,500 USD, invalidating the bearish thesis.
Take-Profit Zones:
TP1: 97,000 USD
TP2: 93,500 USD
Risk Management:
Max risk per trade: 1-2% of portfolio.
Monitor closely for fakeouts at the apex; symmetrical triangles are prone to false moves.
Alternative Strategy:
If bullish breakout occurs above 102,500 USD with RSI reclaiming 50, switch to a long setup with:
Stop Loss: Below 101,000 USD
TP1: 107,500 USD
TP2: 115,500 USD
Current indicators, price behavior, and chart pattern favor a bearish scenario.
Key to execution is waiting for confirmed breakout direction with volume confirmation, especially near the critical apex zone.
Stay adaptive, as symmetrical triangles can break either way, and false breakouts are common.

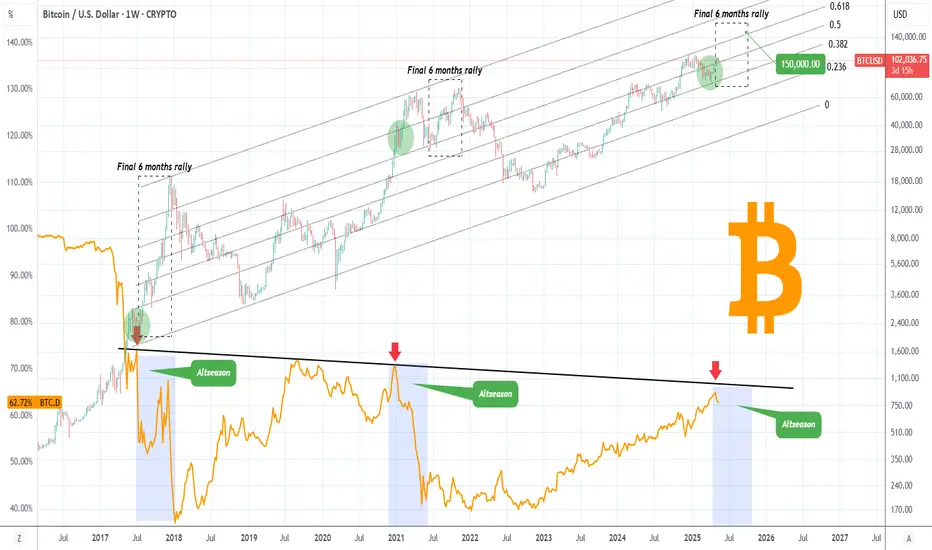
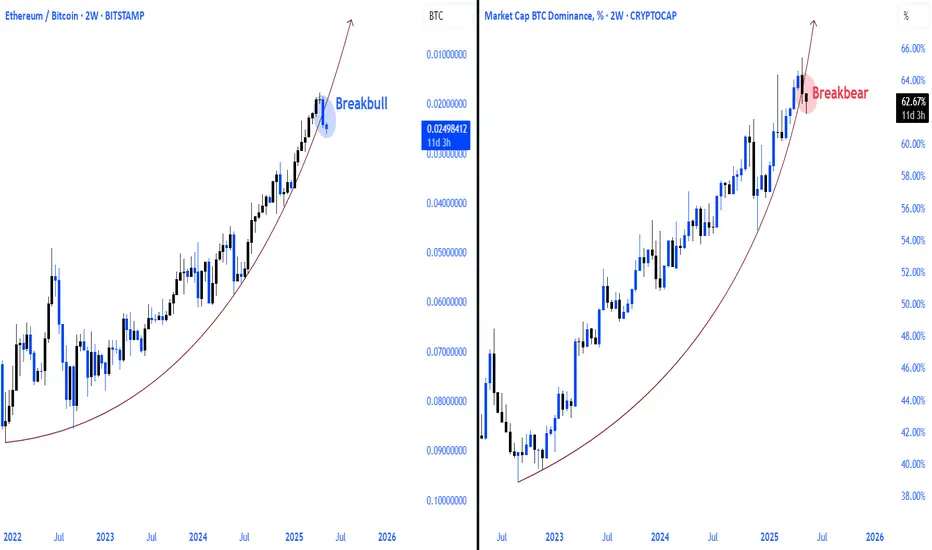
BITCOIN 's 'Final 6 months rally' kickstarts the Altseason!This isn't the first time we show you this chart but it couldn't be more relevant than today. We have established on previous analyses how Bitcoin (BTCUSD) has most likely started the final rally of its Cycle, historically the parabolic rally of the last 6 months of the Bull Cycle that ends with its Top.
The addition of today's analysis is that with Bitcoin Dominance (orange trend-line) approaching its 8-year Lower Highs trend-line, this 'Final 6 months rally' of BTC is what technically also starts the Altseason. This is when lower cap coins see massive gains compared to the high cap ones.
At the same time, we get one more confirmation of why a $150k BTC Target is realistic, as by the end of 2025, this price would still be on the 0.618 Fibonacci level of the 8-year Fib Channel Up, a rather 'bad case' scenario based on this pattern.
So what do you think? Will BTC's Final 6 months rally spark a massive Altseason too? Feel free to let us know in the comments section below!
-------------------------------------------------------------------------------
** Please LIKE 👍, FOLLOW ✅, SHARE 🙌 and COMMENT ✍ if you enjoy this idea! Also share your ideas and charts in the comments section below! This is best way to keep it relevant, support us, keep the content here free and allow the idea to reach as many people as possible. **
-------------------------------------------------------------------------------
💸💸💸💸💸💸
👇 👇 👇 👇 👇 👇
btc . may . w3 . thuin retrospect
- SHORT towards 2pm (UTC+2) . into wOpen + fib resis - was the TOD
- compounding LONG gave a new avg LONG
entry . 102586
sl . 100017
tp1 . 104576
tp2 . 105871
for bullish continuation, price around 2pm needs to be a support zone.
if we see it the other way around, we could rotate to lower prices.
if price breaks out above 102586, we TRAP NEW SHORTS - which came in at 102100 . 20mil vol . push price back into 0.75% weekly range for tp1

ETHEREUM → Consolidation. Which way will the distribution go?BINANCE:ETHUSDT.P has moved into a consolidation phase after the distribution phase. Focus on the 2414-2725 range. A retest of support is possible during the current phase. Despite the bullish trend, there are risks of a reversal...
ETH has been a fairly unprofitable project over the past few years, with the price hitting one bottom after another. While Bitcoin and altcoins were flying high, ETH has only shown itself to be a bull in the last few days.
In the current phase, the focus is on the consolidation boundaries, as well as the 2550 level. If the bulls keep the market above 2550, then the coin could strengthen to 2725, which would be a positive sign for us that buyers are interested in continued growth.
If ETH continues its correction towards support at 2414, then we will need to monitor the market's reaction to this level. I remain skeptical about ETH due to its weak long-term performance despite a strong fundamental backdrop.
Resistance levels: 2550, 2725
Support levels: 2414, 2260
Further movement will determine the price's exit from consolidation: a breakdown of support means a fall, a breakout of resistance means growth. But the current scenario is trading within the range. If ETH trades near 2725 and forms a pre-breakout consolidation, then we will have a chance for growth.
The opposite scenario is if the price falls below 2550 and begins to test 2414. In this case, sticking to the support level and numerous retests will indicate that the bull market has exhausted its strength and we can expect a correction to 2260-2065.
Best regards, R. Linda!

101K to 110KMorning folks,
So, since Monday situation barely has changed. As we said - retracement should be small and we pointed 101K support area. 98K is also nice but it is a kind of vital area for this setup.
Now you could see everything goes great. Market is moving out of 101K.
Here is two shapes might be - immediate upside action by butterfly, or still, a bit deeper retracement in a way of "222" Buy. But anyway market has to stay above 98K to keep this scenario valid.
So let's see. By far everything looks very accurate and predictable.

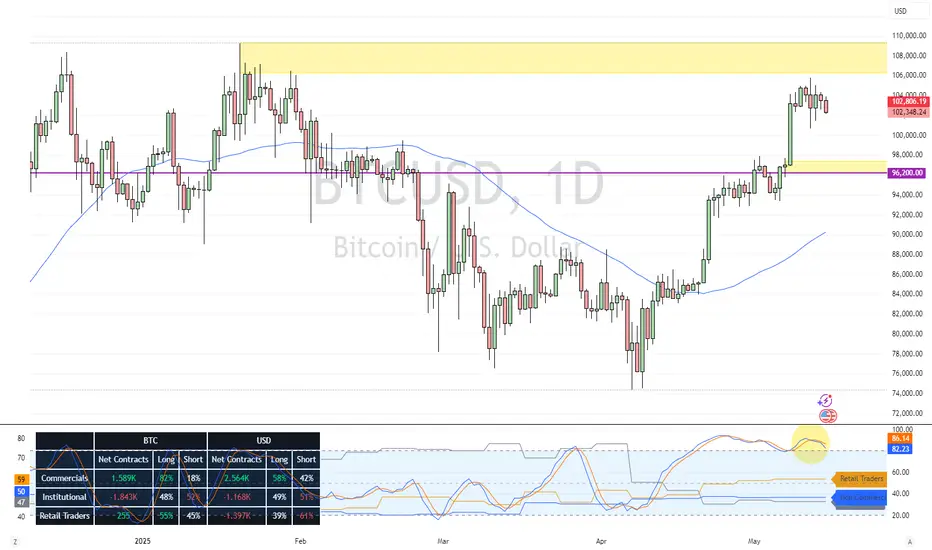
Bitcoin Will Like Decline: Institutional Traders are SellingFenzoFx—Bitcoin is overbought, as indicated by the Stochastic Oscillator. Meanwhile, 52 percent of institutional traders are holding sell positions.
If resistance between $106,000 and $109,000 holds, the price may drop toward $96,000.
BTC (Y25.P2.E1) Have 2 scenariosHi Traders,
I won't use words as the charts do the job if you can read charts.
Scenario #1, price moves up from here
Scenario #2, price sweeps the lows for liquidity. A fractal is aligned with it.
I'm looking to enter the trade big at the lows with Avwap, EMAs and liquidity making a strong case.
Here are short term levels based on our approach.
All the best,
Regards,
S.SAri
BTC (Y25.P2.E2). Ideal scenarioHi Traders,
As per the chart, the VAH is the main resistance so another dip might be the catalyst required to break through it.
Difficult to say if we sweep the highs first at 106k range for liquidity for a nice short or sweep the lows first.
All the Best
SSari
SMALLER TIME FRAME
in a range to trade
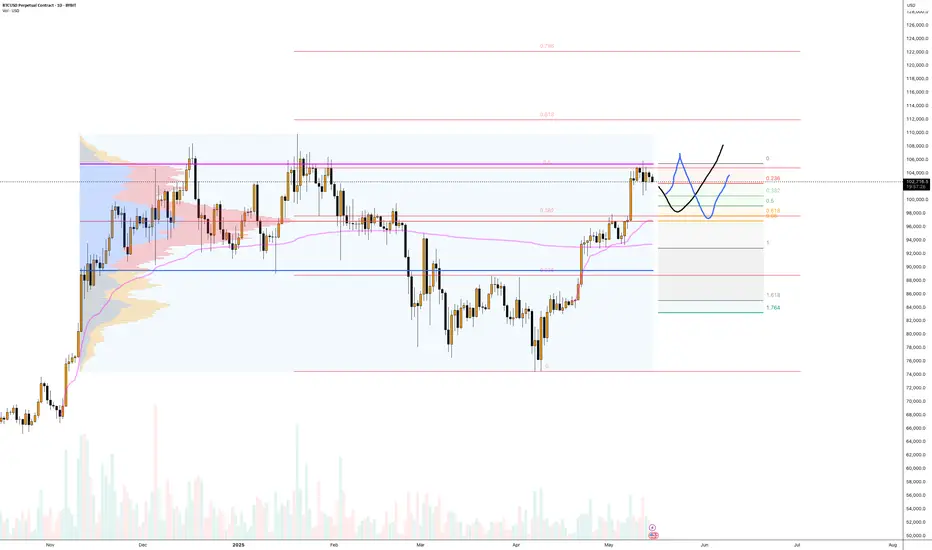
Momentum Fades: Is Bitcoin Poised for a Pullback to Rebalance?Given the recent easing of US-China tariff tensions 🇺🇸🇨🇳, we’re observing a notable rotation of capital into equities 📈. This shift is lending strength to the US dollar 💵, which in turn has exerted downward pressure on Bitcoin’s price action. After a strong momentum-driven rally 🚀, Bitcoin is now showing early signs of weakness, suggesting a potential consolidation or a measured pullback.
With equity markets—particularly tech stocks—appearing overextended 🏦, a retracement seems likely. Since Bitcoin remains closely correlated with the tech sector, a synchronized pullback across both asset classes is a plausible scenario. I’m closely monitoring for a counter-trend opportunity, specifically eyeing a short entry should we see a decisive break in market structure 🔍.
It’s important to note that this setup is highly dependent on price action confirming the thesis as outlined in the accompanying video. If the anticipated conditions do not materialize, this trade idea will be promptly invalidated. ⚠️
Disclaimer:
This analysis is for informational purposes only and does not constitute financial advice. Trading cryptocurrencies and equities involves significant risk. Please conduct your own research and consult with a professional advisor before making any investment decisions. 📊

Eth/Btc vs Bitcoin Dominance Ethbtc parity and bitcoin dominance parabolic curve breakout occurred. bitcoin dominance down ethbtc will start the up process
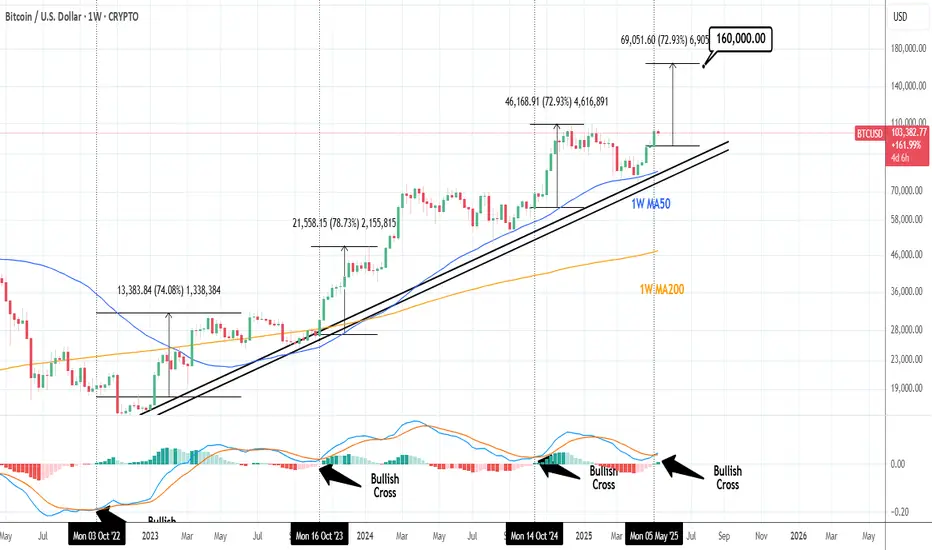
BTCUSD: The 1W MACD Bullish Cross eyes $160k.Bitcoin is on excellent bullish levels on its 1D technical outlook (RSI = 67.904, MACD = 4228.900, ADX = 24.411) and even better on 1W where the MACD just formed a Bullish Cross. All such formations since October 2022 led to at least a + 72.93% rally from the moment of the formation. This suggests that Bitcoin's next high on this Channel Up pattern can be around $160,000.
## If you like our free content follow our profile to get more daily ideas. ##
## Comments and likes are greatly appreciated. ##
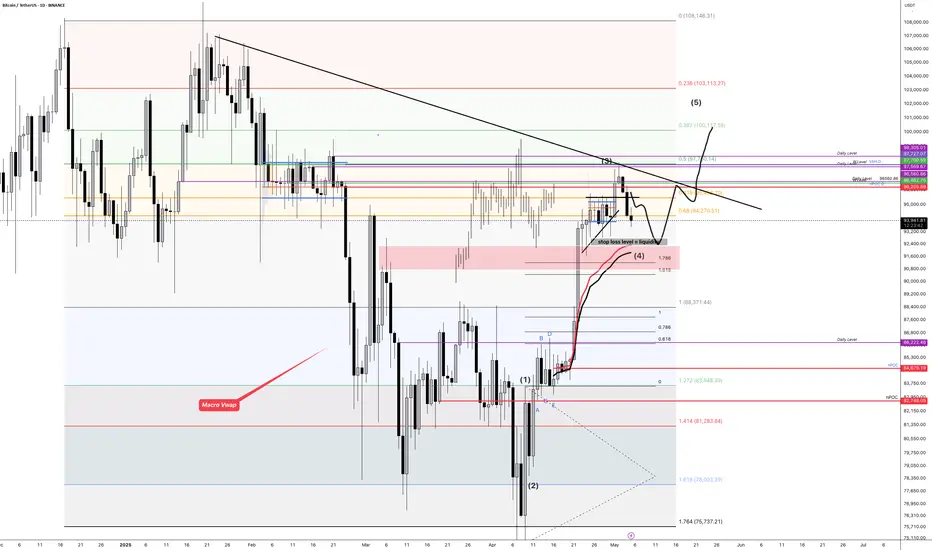
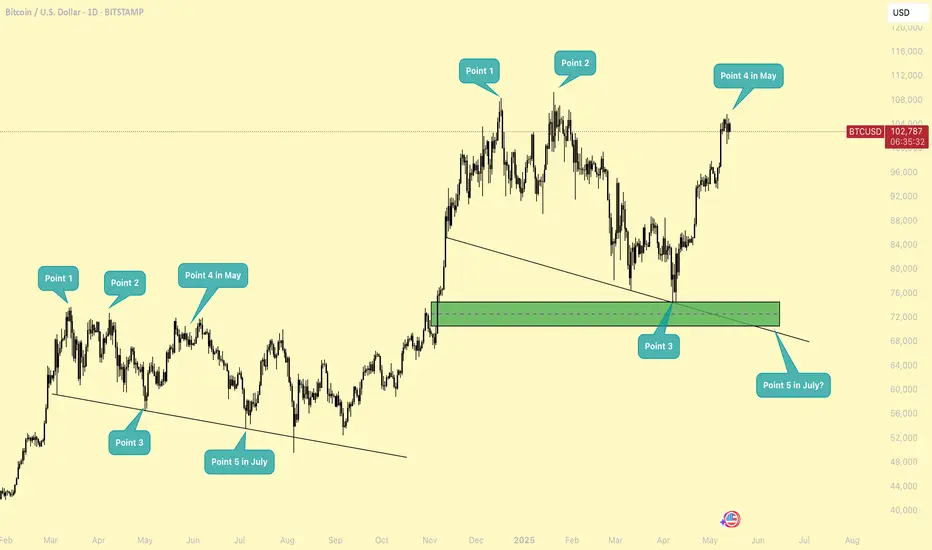
BTC - Will we repeat last year price action?Bitcoin (BTC) has recently been trading within a relatively wide range, fluctuating between the $108,000 and $74,000 levels. Over the past several months, the asset experienced a notable decline from its local high of $108,000 down to a low of around $74,000. However, since reaching that bottom, BTC has been on a recovery trajectory, climbing back up toward the $106,000 region as of May. This rebound has brought renewed optimism to the market, but the key question now arises: is this upward momentum sustainable, or is it merely another temporary relief rally within a larger consolidation phase?
To evaluate the potential sustainability of this move, it is insightful to compare the current price action with that of exactly one year ago. In the same May period last year, BTC was also trading within a defined range, between $73,000 and $56,000. The pattern that unfolded then may offer clues as to what might happen next.
At that time, Bitcoin formed a double top, a classic technical pattern that often signals weakening bullish momentum. This structure developed over two distinct peaks, let's call them Point 1 and Point 2. Following the double top formation, the market began to retrace, initiating a decline that led to the creation of Point 3. This low established a key trendline, marking the beginning of a longer-term structural setup.
After bouncing from Point 3, BTC managed to rally once more, approaching a new all-time high but falling just short. This rally formed what can be referred to as Point 4, and notably, this occurred in May, exactly where we are now on the calendar. However, this attempt to break to new highs ultimately failed. The market lost momentum, and BTC turned downward once again, culminating in another test of the established trendline. This next low, which we can label Point 5, occurred in July and served as the third touchpoint of the trendline, reinforcing its significance.
Fast forward to the present, and it appears that Bitcoin may be following a similar structural path. The current price action suggests that Points 1, 2, and 3 have already been formed in recent months. The bounce that we’re witnessing now could potentially be developing into Point 4, mirroring the rally seen last May. If history were to repeat or even slightly rhyme, we may be approaching a local high, after which the market could face renewed downward pressure.
Such a move would align with a third touch of the longer-term trendline, potentially occurring in the coming months, perhaps around July, just as it did the previous year. Furthermore, this prospective downside move would also serve to close a daily Fair Value Gap (FVG) that has remained largely unfilled, a technical factor that many traders are currently watching.
In summary, while the recent price recovery in Bitcoin is encouraging, a closer examination of past market structure and recurring seasonal patterns suggests caution. The market may be setting up for a local high in May, followed by a potential retracement that would once again validate key support levels and trendlines. Whether this scenario plays out in full remains to be seen, but the parallels with last year’s behavior are worth noting for any trader or investor closely monitoring the charts.
Thanks for your support.
- Make sure to follow me so you don't miss out on the next analysis!
- Drop a like and leave a comment!
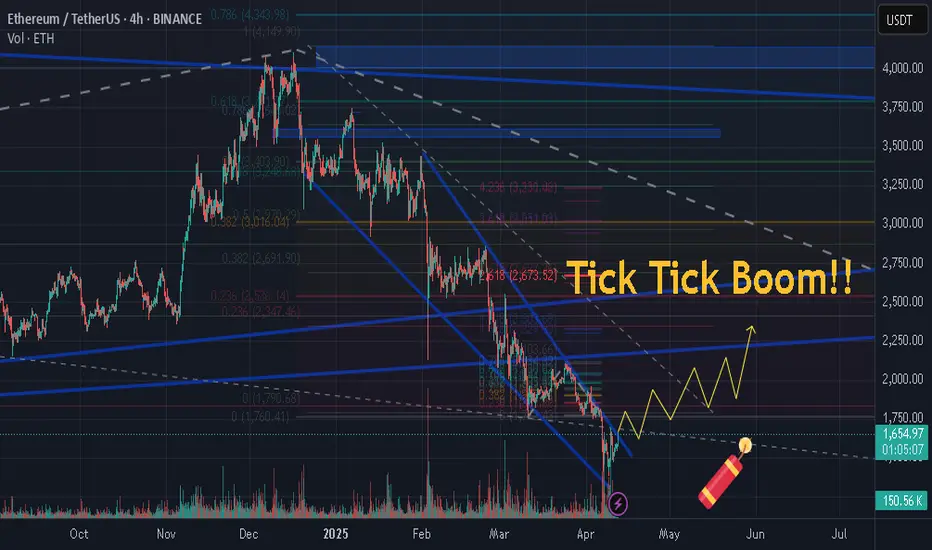
I see ETH break the trend lineETH owner buy enough coin in their wallet with breaking the descend line.
DOGE (Dogecoin)–Pullback Opportunity Amid Market-Wide ResistanceWith the total crypto market cap stalling at a major resistance zone, many altcoins — including DOGE — are due for a healthy retracement after recent strong moves. This sets up a potential buy-the-dip opportunity as DOGE returns to key support near $0.20.
🔹 Entry Zone:
$0.20 (next major support zone after recent rally)
🎯 Take Profit Targets:
🥇 $0.23 – $0.24
🥈 $0.30 – $0.31
🛑 Stop Loss:
Just below $0.18 (invalidates the support-based long idea)
