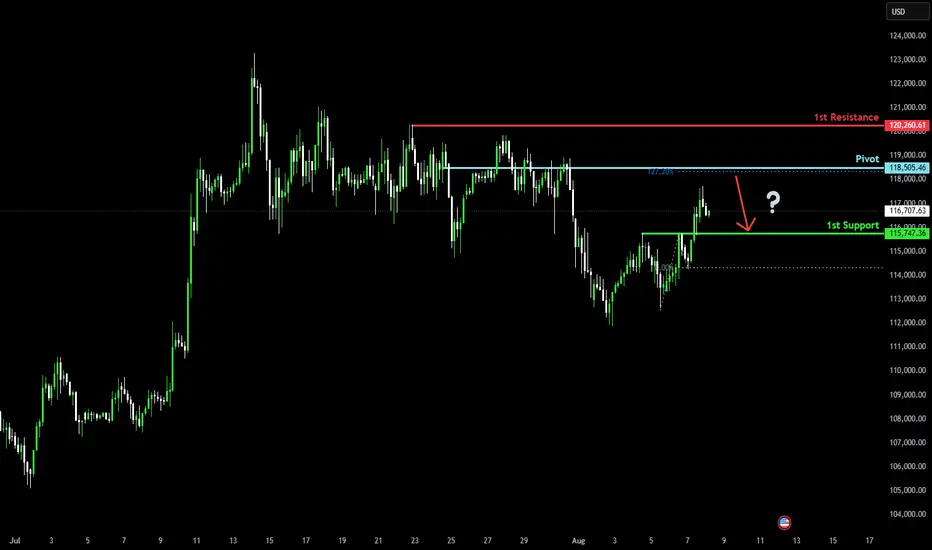
Bearish reversal off 127.2% Fibonacci resistance?The Bitcoin (BTC/USD) is rising towards the pivot and could reverse to the 1st support which acts as a pullback support.
Pivot: 118,505.46
1st Support: 115,747.36
1st Resistance: 120,26.61
Risk Warning:
Trading Forex and CFDs carries a high level of risk to your capital and you should only trade with money you can afford to lose. Trading Forex and CFDs may not be suitable for all investors, so please ensure that you fully understand the risks involved and seek independent advice if necessary.
Disclaimer:
The above opinions given constitute general market commentary, and do not constitute the opinion or advice of IC Markets or any form of personal or investment advice.
Any opinions, news, research, analyses, prices, other information, or links to third-party sites contained on this website are provided on an "as-is" basis, are intended only to be informative, is not an advice nor a recommendation, nor research, or a record of our trading prices, or an offer of, or solicitation for a transaction in any financial instrument and thus should not be treated as such. The information provided does not involve any specific investment objectives, financial situation and needs of any specific person who may receive it. Please be aware, that past performance is not a reliable indicator of future performance and/or results. Past Performance or Forward-looking scenarios based upon the reasonable beliefs of the third-party provider are not a guarantee of future performance. Actual results may differ materially from those anticipated in forward-looking or past performance statements. IC Markets makes no representation or warranty and assumes no liability as to the accuracy or completeness of the information provided, nor any loss arising from any investment based on a recommendation, forecast or any information supplied by any third-party.
BTC-USD
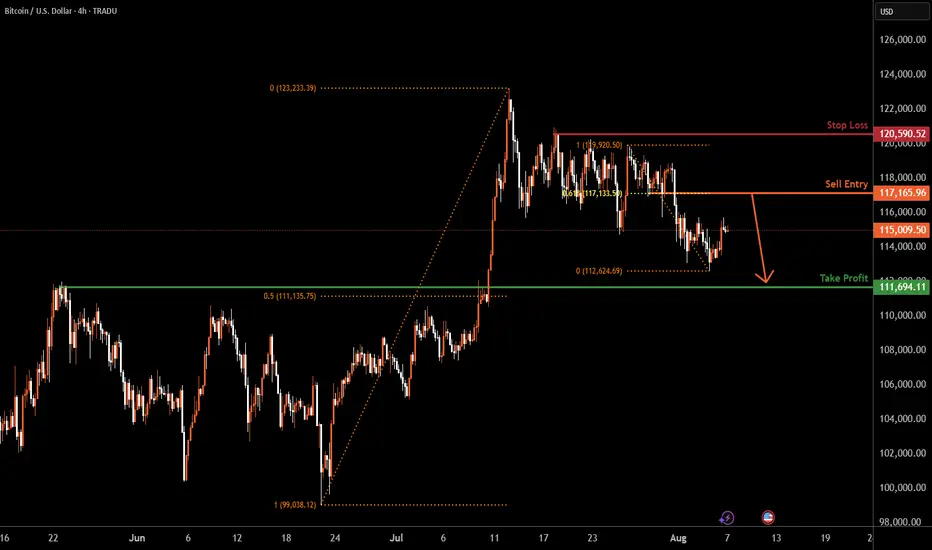
BITCOIN H4 | Heading into 61.8% Fibonacci resistanceBased on the H4 chart analysis, we could see the price rise to the sell entry at 117,165.96, which is a pullback resistance that aligns with the 61.8% Fibonacci retracement and could drop from this level to our take profit.
Stop loss is at 120,590.52, which is a pullback resistance.
Take profit is at 111,694.11, which is a pullback support that is slightly above the 50% Fibonacci retracement.
High Risk Investment Warning
Trading Forex/CFDs on margin carries a high level of risk and may not be suitable for all investors. Leverage can work against you.
Stratos Markets Limited (tradu.com ):
CFDs are complex instruments and come with a high risk of losing money rapidly due to leverage. 65% of retail investor accounts lose money when trading CFDs with this provider. You should consider whether you understand how CFDs work and whether you can afford to take the high risk of losing your money.
Stratos Europe Ltd (tradu.com ):
CFDs are complex instruments and come with a high risk of losing money rapidly due to leverage. 66% of retail investor accounts lose money when trading CFDs with this provider. You should consider whether you understand how CFDs work and whether you can afford to take the high risk of losing your money.
Stratos Global LLC (tradu.com ):
Losses can exceed deposits.
Please be advised that the information presented on TradingView is provided to Tradu (‘Company’, ‘we’) by a third-party provider (‘TFA Global Pte Ltd’). Please be reminded that you are solely responsible for the trading decisions on your account. There is a very high degree of risk involved in trading. Any information and/or content is intended entirely for research, educational and informational purposes only and does not constitute investment or consultation advice or investment strategy. The information is not tailored to the investment needs of any specific person and therefore does not involve a consideration of any of the investment objectives, financial situation or needs of any viewer that may receive it. Kindly also note that past performance is not a reliable indicator of future results. Actual results may differ materially from those anticipated in forward-looking or past performance statements. We assume no liability as to the accuracy or completeness of any of the information and/or content provided herein and the Company cannot be held responsible for any omission, mistake nor for any loss or damage including without limitation to any loss of profit which may arise from reliance on any information supplied by TFA Global Pte Ltd.
The speaker(s) is neither an employee, agent nor representative of Tradu and is therefore acting independently. The opinions given are their own, constitute general market commentary, and do not constitute the opinion or advice of Tradu or any form of personal or investment advice. Tradu neither endorses nor guarantees offerings of third-party speakers, nor is Tradu responsible for the content, veracity or opinions of third-party speakers, presenters or participants.
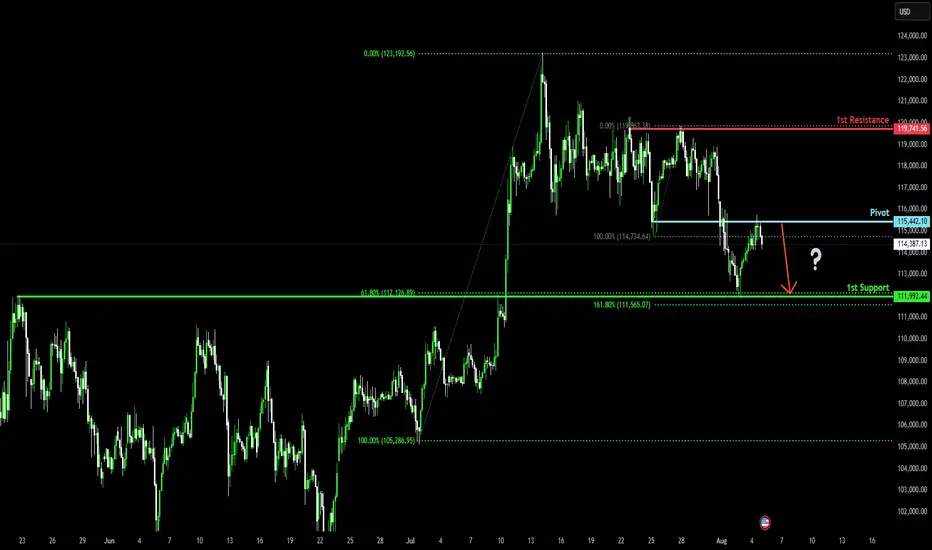
Bearish drop?Bitcoin (BTC/USD) has rejected off the pivot and could drop to the 1st support, which aligns with the 61.8% Fibonacci retracement.
Pivot: 115,442.10
1st Support: 111,992.44
1st Resistance: 119,741.56
Risk Warning:
Trading Forex and CFDs carries a high level of risk to your capital and you should only trade with money you can afford to lose. Trading Forex and CFDs may not be suitable for all investors, so please ensure that you fully understand the risks involved and seek independent advice if necessary.
Disclaimer:
The above opinions given constitute general market commentary, and do not constitute the opinion or advice of IC Markets or any form of personal or investment advice.
Any opinions, news, research, analyses, prices, other information, or links to third-party sites contained on this website are provided on an "as-is" basis, are intended only to be informative, is not an advice nor a recommendation, nor research, or a record of our trading prices, or an offer of, or solicitation for a transaction in any financial instrument and thus should not be treated as such. The information provided does not involve any specific investment objectives, financial situation and needs of any specific person who may receive it. Please be aware, that past performance is not a reliable indicator of future performance and/or results. Past Performance or Forward-looking scenarios based upon the reasonable beliefs of the third-party provider are not a guarantee of future performance. Actual results may differ materially from those anticipated in forward-looking or past performance statements. IC Markets makes no representation or warranty and assumes no liability as to the accuracy or completeness of the information provided, nor any loss arising from any investment based on a recommendation, forecast or any information supplied by any third-party.
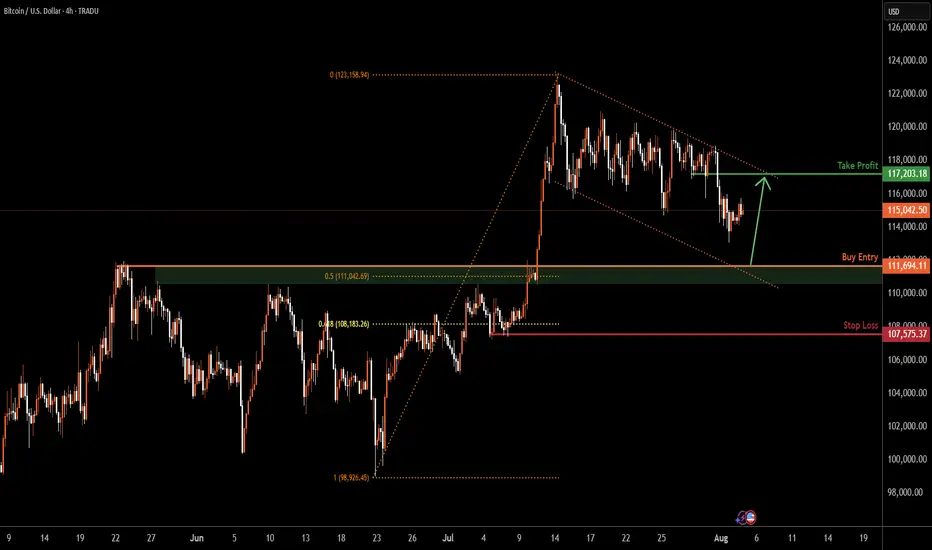
BITCOIN H4 | Bullish bounce offBTC/USD is falling towards the buy entry, which is a pullback support that is slightly above the 50% Fibonacci retracement and could bounce from this level to our take profit.
Buy entry is at 111,694.11, which is a pullback support that is slightly above the 50% Fibonacci retracement.
Stop loss is at 107,575.37, which is a pullback support that is slightly below the 61.8% Fibonacci retracement.
Take profit is at 117,203.18, which is a pullback resistance.
High Risk Investment Warning
Trading Forex/CFDs on margin carries a high level of risk and may not be suitable for all investors. Leverage can work against you.
Stratos Markets Limited (tradu.com ):
CFDs are complex instruments and come with a high risk of losing money rapidly due to leverage. 65% of retail investor accounts lose money when trading CFDs with this provider. You should consider whether you understand how CFDs work and whether you can afford to take the high risk of losing your money.
Stratos Europe Ltd (tradu.com ):
CFDs are complex instruments and come with a high risk of losing money rapidly due to leverage. 66% of retail investor accounts lose money when trading CFDs with this provider. You should consider whether you understand how CFDs work and whether you can afford to take the high risk of losing your money.
Stratos Global LLC (tradu.com ):
Losses can exceed deposits.
Please be advised that the information presented on TradingView is provided to Tradu (‘Company’, ‘we’) by a third-party provider (‘TFA Global Pte Ltd’). Please be reminded that you are solely responsible for the trading decisions on your account. There is a very high degree of risk involved in trading. Any information and/or content is intended entirely for research, educational and informational purposes only and does not constitute investment or consultation advice or investment strategy. The information is not tailored to the investment needs of any specific person and therefore does not involve a consideration of any of the investment objectives, financial situation or needs of any viewer that may receive it. Kindly also note that past performance is not a reliable indicator of future results. Actual results may differ materially from those anticipated in forward-looking or past performance statements. We assume no liability as to the accuracy or completeness of any of the information and/or content provided herein and the Company cannot be held responsible for any omission, mistake nor for any loss or damage including without limitation to any loss of profit which may arise from reliance on any information supplied by TFA Global Pte Ltd.
The speaker(s) is neither an employee, agent nor representative of Tradu and is therefore acting independently. The opinions given are their own, constitute general market commentary, and do not constitute the opinion or advice of Tradu or any form of personal or investment advice. Tradu neither endorses nor guarantees offerings of third-party speakers, nor is Tradu responsible for the content, veracity or opinions of third-party speakers, presenters or participants.
Bearish reversal?The Bitcoin (BTC/USD) is rising towards the pivot and could reverse to the 1st support.
Pivot: 117,036.07
1st Support: 111,931.87
1st Resistance: 121,138.50
Risk Warning:
Trading Forex and CFDs carries a high level of risk to your capital and you should only trade with money you can afford to lose. Trading Forex and CFDs may not be suitable for all investors, so please ensure that you fully understand the risks involved and seek independent advice if necessary.
Disclaimer:
The above opinions given constitute general market commentary, and do not constitute the opinion or advice of IC Markets or any form of personal or investment advice.
Any opinions, news, research, analyses, prices, other information, or links to third-party sites contained on this website are provided on an "as-is" basis, are intended only to be informative, is not an advice nor a recommendation, nor research, or a record of our trading prices, or an offer of, or solicitation for a transaction in any financial instrument and thus should not be treated as such. The information provided does not involve any specific investment objectives, financial situation and needs of any specific person who may receive it. Please be aware, that past performance is not a reliable indicator of future performance and/or results. Past Performance or Forward-looking scenarios based upon the reasonable beliefs of the third-party provider are not a guarantee of future performance. Actual results may differ materially from those anticipated in forward-looking or past performance statements. IC Markets makes no representation or warranty and assumes no liability as to the accuracy or completeness of the information provided, nor any loss arising from any investment based on a recommendation, forecast or any information supplied by any third-party.

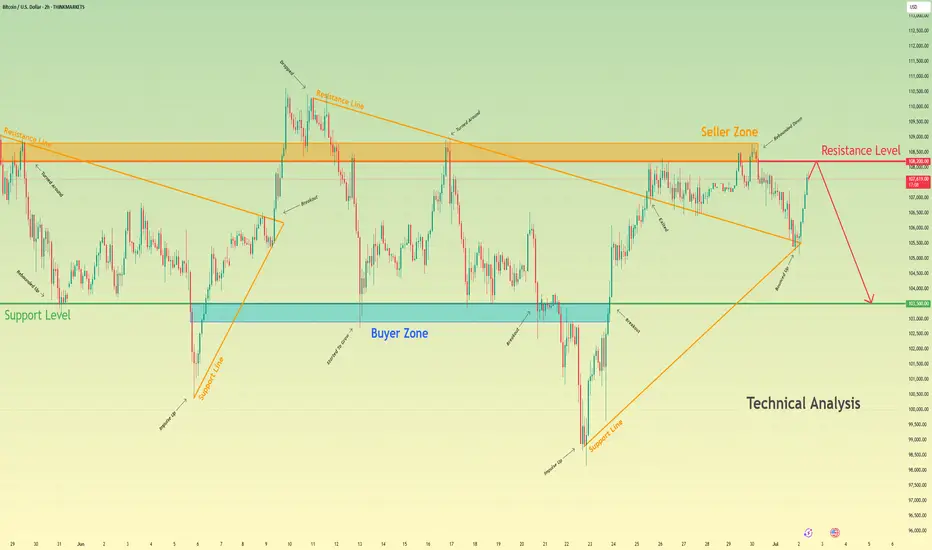
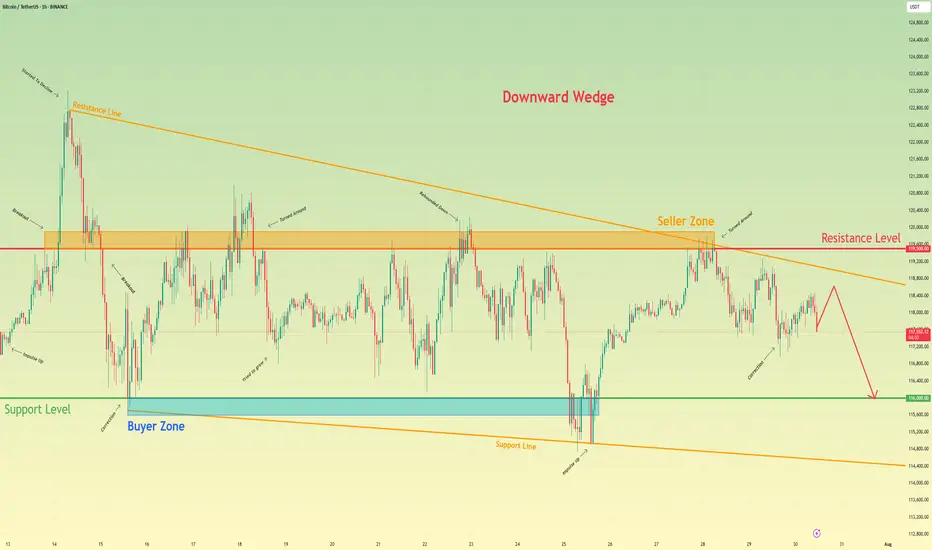
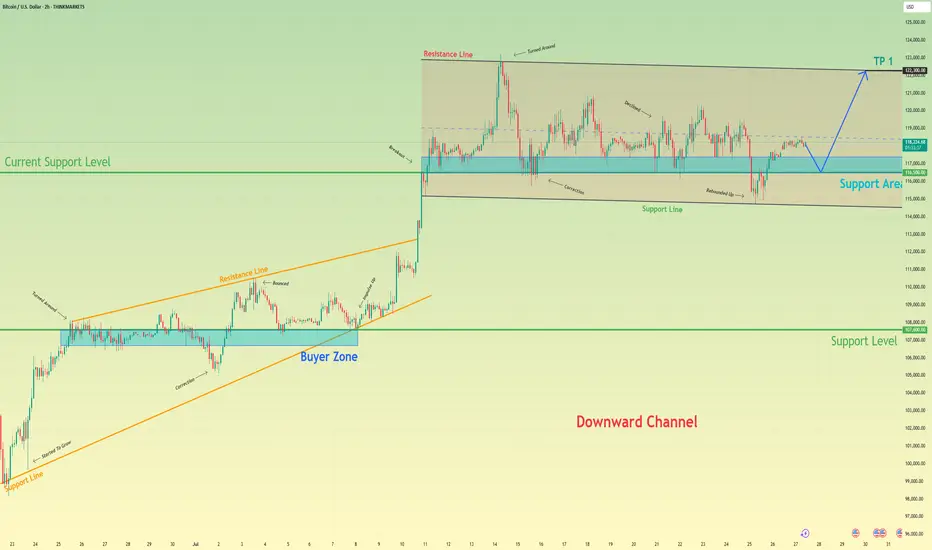
Bitcoin will continue to decline to support levelHello traders, I want share with you my opinion about Bitcoin. Following a period of a broad downward trend, bitcoin's price action has been channeled into a large downward wedge, a pattern that signifies converging volatility and a period of consolidation before an eventual decisive move. This market action is taking place between two critical, well-established zones: a major seller zone capping rallies around the 119500 resistance level and a significant buyer zone providing support near 116000. Recently, an upward rebound attempted to test the upper boundary of this wedge but was met with strong selling pressure from the seller zone, confirming its validity as a formidable barrier. The price is now correcting downwards after this rejection. The primary working hypothesis is a short scenario, anticipating that the bearish momentum from this recent failure will continue to drive the price lower. While a minor bounce or retest of local resistance is possible, the path of least resistance within the pattern's structure is now towards its lower boundary. Therefore, the TP is strategically set at the 116000 level. Please share this idea with your friends and click Boost 🚀
Disclaimer: As part of ThinkMarkets’ Influencer Program, I am sponsored to share and publish their charts in my analysis.
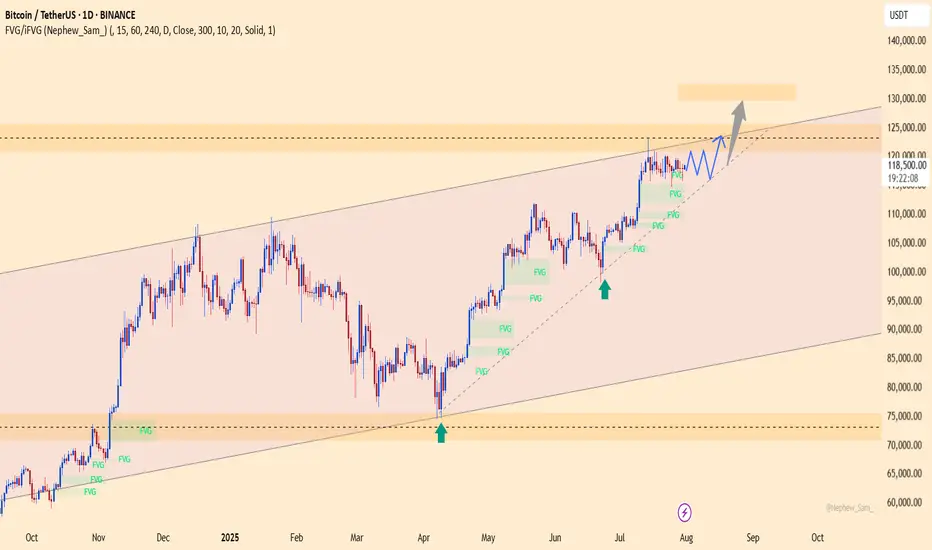
BTC defies expectations –Absorbs 9 billion USD, aiming for 130K?BTCUSDT maintains its bullish momentum despite Galaxy Digital offloading 80,000 BTC (worth ~9 billion USD). Price only saw a slight dip before bouncing back quickly, signaling strong demand and a more mature market sentiment.
Citi analysts point to ETF inflows and retail participation as the primary drivers of BTC’s rally, even as investors remain cautious ahead of the Fed’s rate decision.
On the daily chart, BTC continues to trade within an ascending channel, with the 116,200 zone acting as a potential buy area on any pullback. The next target is set at 129,500 USDT, aligning with the channel’s upper boundary and technical resistance.
Suggested strategy: Look to buy near 116,200–117,000. Target 129,500. Stop-loss below 115,000.
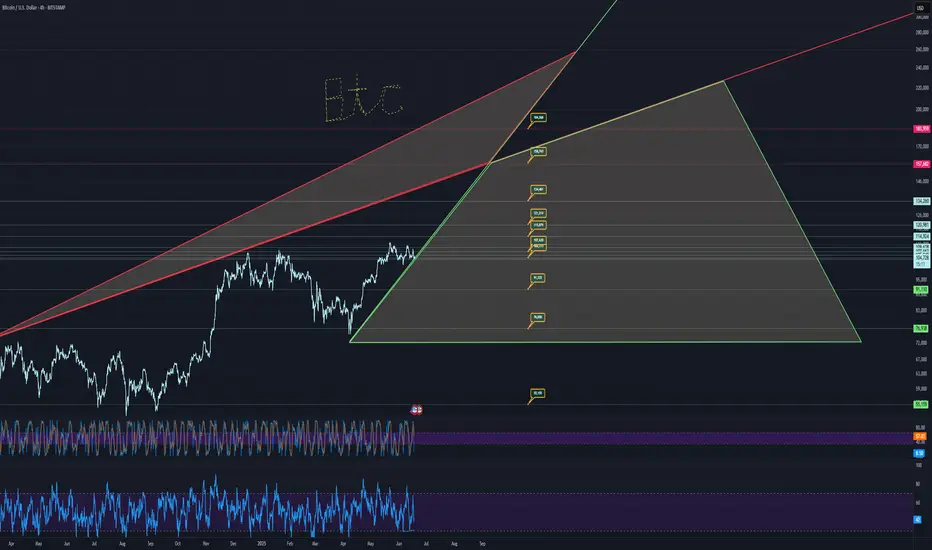
BTC USD 180K BIG HOW?Trends and price targets is how, but realistically, it looks like 134k in the short term.
Drop is wicked if it were to occur, takes price to literally 12k, which you want to go all in if that occurs.
55k is another drop zone.
Otherwise, it looks fairly bullish.
buy zone marked in green,
sell in red.
watch the trends
and price targets are pretty accurate usually.
good luck!!
Custom charts by request.
Bullish bounce off swing low support?The Bitcoin (BTC/USD) is falling towards the pivot and could bounce to the 1st resistance.
Pivot: 115,415.51
1st Support: 113,466.96
1st Resistance: 120,573.43
Risk Warning:
Trading Forex and CFDs carries a high level of risk to your capital and you should only trade with money you can afford to lose. Trading Forex and CFDs may not be suitable for all investors, so please ensure that you fully understand the risks involved and seek independent advice if necessary.
Disclaimer:
The above opinions given constitute general market commentary, and do not constitute the opinion or advice of IC Markets or any form of personal or investment advice.
Any opinions, news, research, analyses, prices, other information, or links to third-party sites contained on this website are provided on an "as-is" basis, are intended only to be informative, is not an advice nor a recommendation, nor research, or a record of our trading prices, or an offer of, or solicitation for a transaction in any financial instrument and thus should not be treated as such. The information provided does not involve any specific investment objectives, financial situation and needs of any specific person who may receive it. Please be aware, that past performance is not a reliable indicator of future performance and/or results. Past Performance or Forward-looking scenarios based upon the reasonable beliefs of the third-party provider are not a guarantee of future performance. Actual results may differ materially from those anticipated in forward-looking or past performance statements. IC Markets makes no representation or warranty and assumes no liability as to the accuracy or completeness of the information provided, nor any loss arising from any investment based on a recommendation, forecast or any information supplied by any third-party.

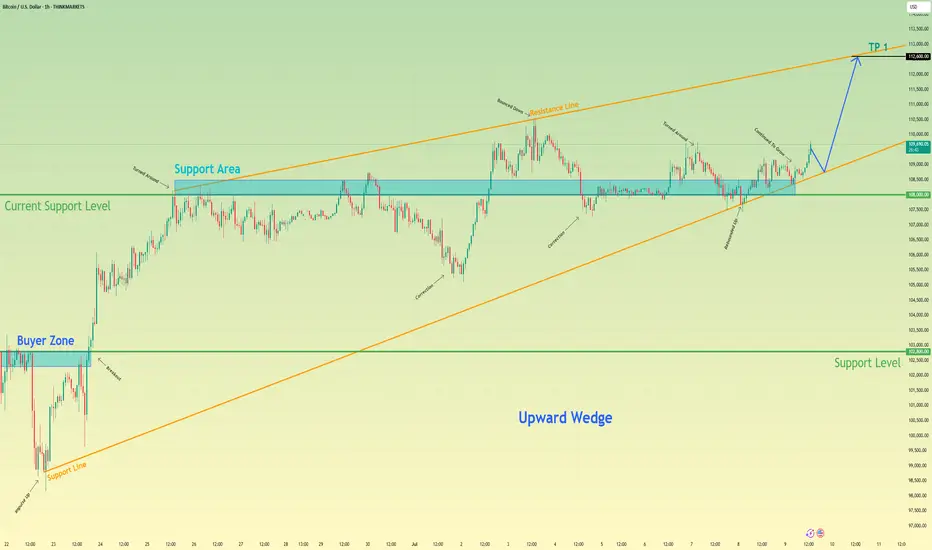
Bitcoin will rebound up from support area to resistance lineHello traders, I want share with you my opinion about Bitcoin. After a strong upward trend that originated from the buyer zone and evolved through an upward wedge, bitcoin executed a decisive breakout, shifting the market into a new, higher-value market phase. This powerful move has since led to an extended period of wide consolidation within a well-defined horizontal channel, a classic sign of the market pausing to absorb the prior impulse and build cause for its next major leg. Currently, the asset's price action is rotating within this structure, defined by a key support area around 116500 and an upper resistance line. Having been rejected from the top, the price is now completing another downward correction and is approaching the channel's foundational support for a crucial test. The primary working hypothesis is a long scenario, predicated on the proven resilience of this support level. A confirmed upward rebound from this 116500 zone would signal that the accumulation within the channel is continuing and likely to resolve upwards. Therefore, the tp is logically and strategically placed at 122300, as this level not only coincides perfectly with the channel's upper resistance line but also represents the completion of the internal rotation, setting the stage for a potential continuation of the larger uptrend. Please share this idea with your friends and click Boost 🚀
Disclaimer: As part of ThinkMarkets’ Influencer Program, I am sponsored to share and publish their charts in my analysis.
Bullish continuation?The Bitcoin (BTC/USD) has bounced off the pivot and could rise to the 1st resistance.
Pivot: 116,724.27
1st Support: 111,336.90
1st Resistance: 123,341.37
Risk Warning:
Trading Forex and CFDs carries a high level of risk to your capital and you should only trade with money you can afford to lose. Trading Forex and CFDs may not be suitable for all investors, so please ensure that you fully understand the risks involved and seek independent advice if necessary.
Disclaimer:
The above opinions given constitute general market commentary, and do not constitute the opinion or advice of IC Markets or any form of personal or investment advice.
Any opinions, news, research, analyses, prices, other information, or links to third-party sites contained on this website are provided on an "as-is" basis, are intended only to be informative, is not an advice nor a recommendation, nor research, or a record of our trading prices, or an offer of, or solicitation for a transaction in any financial instrument and thus should not be treated as such. The information provided does not involve any specific investment objectives, financial situation and needs of any specific person who may receive it. Please be aware, that past performance is not a reliable indicator of future performance and/or results. Past Performance or Forward-looking scenarios based upon the reasonable beliefs of the third-party provider are not a guarantee of future performance. Actual results may differ materially from those anticipated in forward-looking or past performance statements. IC Markets makes no representation or warranty and assumes no liability as to the accuracy or completeness of the information provided, nor any loss arising from any investment based on a recommendation, forecast or any information supplied by any third-party.

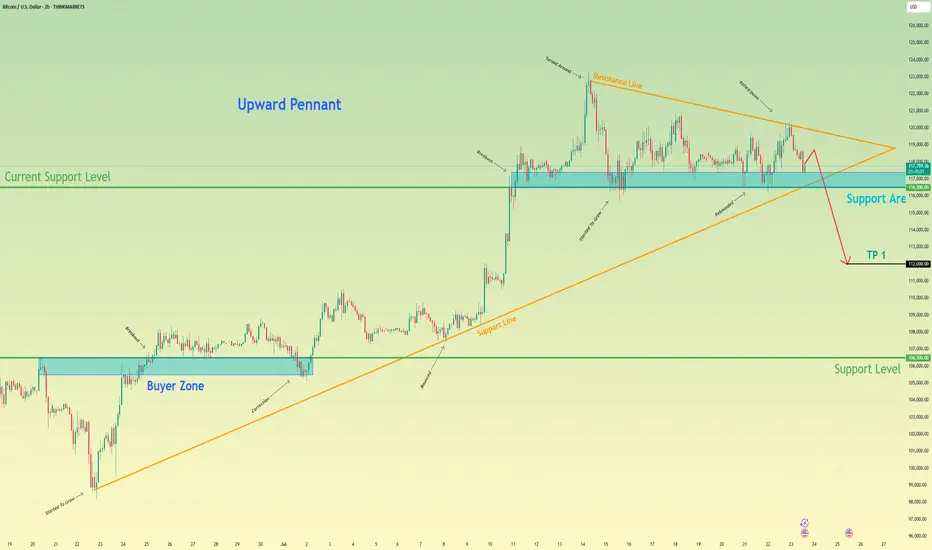
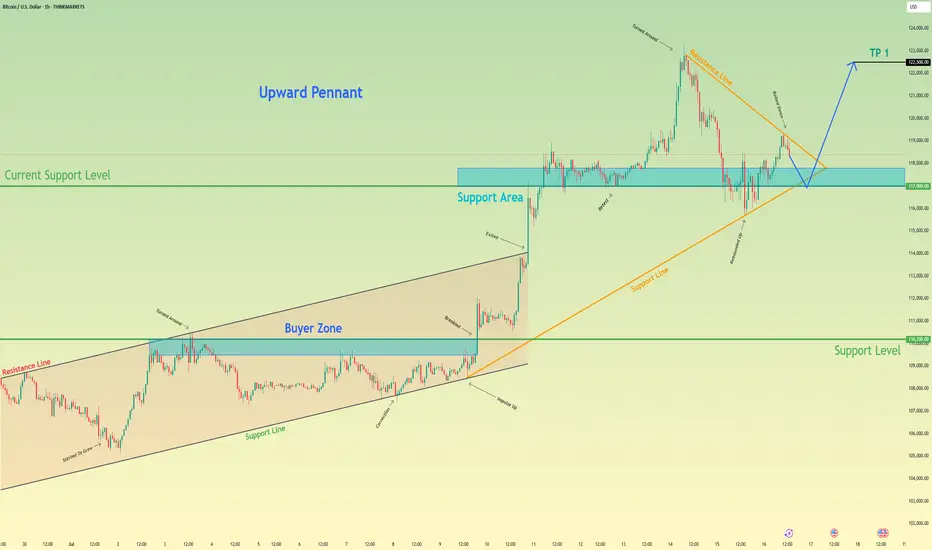
Bitcoin can start to decline and break support levelHello traders, I want share with you my opinion about Bitcoin. After completing a powerful upward impulse that originated from the buyer zone near 106500, the price action for BTC has transitioned into a corrective market phase. This consolidation has taken the form of an upward pennant, characterised by a narrowing trading range that suggests a significant directional move is forthcoming. Currently, the asset is undergoing a sequence of downward corrections within the pennant, exerting repeated pressure on the critical demand zone between 116500 and 117400. The importance of this zone is amplified by its confluence with the lower trend line of the formation itself. The primary working hypothesis is a bearish resolution, anticipating that persistent selling pressure will culminate in a decisive breakdown of this support. This event would act as a bearish breakout from the pennant, providing strong confirmation for the continuation of the downward impulsive momentum and shifting the local market structure. Therefore, the take-profit level is logically positioned at the 112000 mark. Please share this idea with your friends and click Boost 🚀
Disclaimer: As part of ThinkMarkets’ Influencer Program, I am sponsored to share and publish their charts in my analysis.
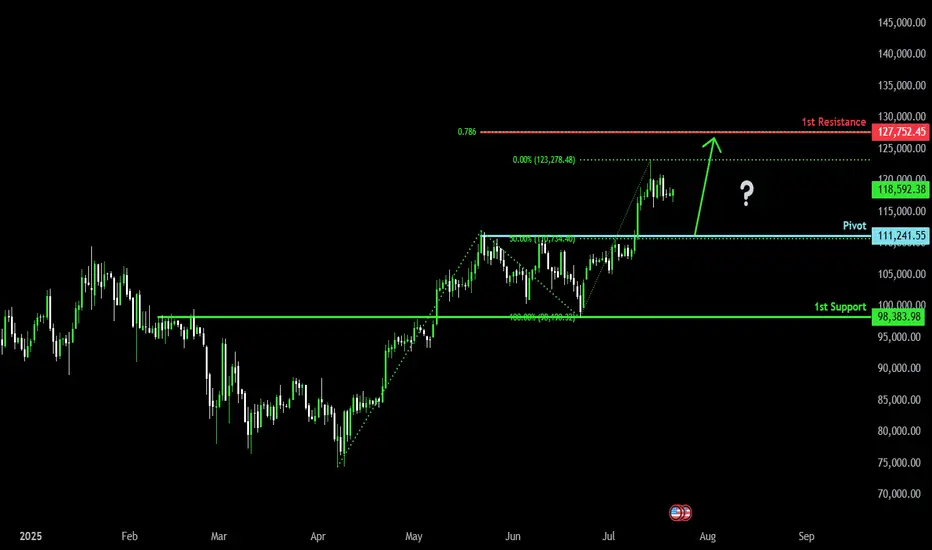
Bullish bounce?The Bitcoin (BTC/USD) is falling toward the pivot and could bounce to the 1st resistance.
Pivot: 111,241.55
1st Support: 98,383.98
1st Resistance: 127,752.45
Risk Warning:
Trading Forex and CFDs carries a high level of risk to your capital and you should only trade with money you can afford to lose. Trading Forex and CFDs may not be suitable for all investors, so please ensure that you fully understand the risks involved and seek independent advice if necessary.
Disclaimer:
The above opinions given constitute general market commentary, and do not constitute the opinion or advice of IC Markets or any form of personal or investment advice.
Any opinions, news, research, analyses, prices, other information, or links to third-party sites contained on this website are provided on an "as-is" basis, are intended only to be informative, is not an advice nor a recommendation, nor research, or a record of our trading prices, or an offer of, or solicitation for a transaction in any financial instrument and thus should not be treated as such. The information provided does not involve any specific investment objectives, financial situation and needs of any specific person who may receive it. Please be aware, that past performance is not a reliable indicator of future performance and/or results. Past Performance or Forward-looking scenarios based upon the reasonable beliefs of the third-party provider are not a guarantee of future performance. Actual results may differ materially from those anticipated in forward-looking or past performance statements. IC Markets makes no representation or warranty and assumes no liability as to the accuracy or completeness of the information provided, nor any loss arising from any investment based on a recommendation, forecast or any information supplied by any third-party.
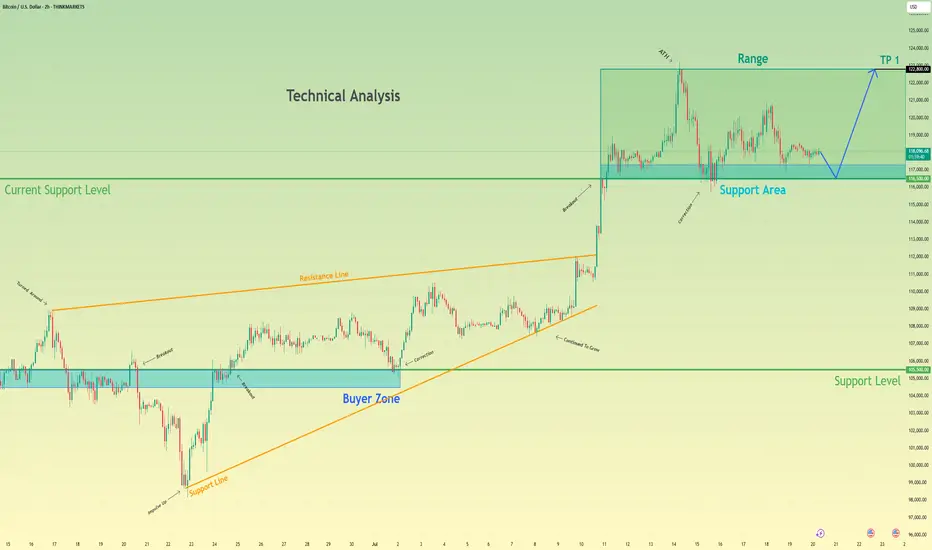
Bitcoin may bounce up from support area to 122800 pointsHello traders, I want share with you my opinion about Bitcoin. Analyzing the broader market context on the BTC chart, the past price action has carved out two significant technical structures: a wide trading range and a larger upward wedge pattern. The formation of this wedge indicates a generally positive market sentiment, though the narrowing price swings suggest a decrease in upward momentum. The foundation of the current structure was established around the buyer zone of 105500 - 104500, a level that has historically proven to be a robust floor. This historical behavior provides a critical reference for our hypothesis. Currently, we are observing bitcoin's price action closely, interacting with the current support area, located between 116500 and 117300. The character of the movement here is largely corrective and consolidative, pointing to a state of temporary equilibrium. This consolidation near the lower boundary of the wedge is a pivotal point. My thinking is that a final, brief dip to thoroughly test the 116500 - 117300 support area is a high-probability scenario. Such a move would effectively absorb remaining sell-side liquidity before a reversal. We can then anticipate an impulsive move upwards across the range. Therefore, the logical take-profit for this long position is set at 122800 points, as this level marks the upper resistance of the range and a natural target. Please share this idea with your friends and click Boost 🚀
Disclaimer: As part of ThinkMarkets’ Influencer Program, I am sponsored to share and publish their charts in my analysis.
Bitcoin may exit of pennant and then rebound up of support areaHello traders, I want share with you my opinion about Bitcoin. Earlier, the price was moving inside an upward channel, respecting both the resistance and support boundaries. After reaching the buyer zone (110200–109500 points), BTC made a strong impulse up, breaking out of the channel and entering a new phase of growth. This breakout led to the formation of a bullish pennant, which often signals a continuation of the uptrend. Right now, the price is testing the support area between 117000 and 117800, which previously acted as a breakout zone and now serves as a current support level (117000). The structure shows that this level has already worked as a rebound zone multiple times. In my opinion, BTC may continue the correction toward this support area, potentially exiting the pennant to the downside for a short-term pull-back. After that, I expect a new upward movement, targeting the next local high. That’s why I set my TP at 122500 points, which is just below the recent ATH. Given the impulse move, strong support zone, breakout from the channel, and the bullish pennant pattern, I remain bullish and expect BTC to resume its upward trend soon. Please share this idea with your friends and click Boost 🚀
Disclaimer: As part of ThinkMarkets’ Influencer Program, I am sponsored to share and publish their charts in my analysis.
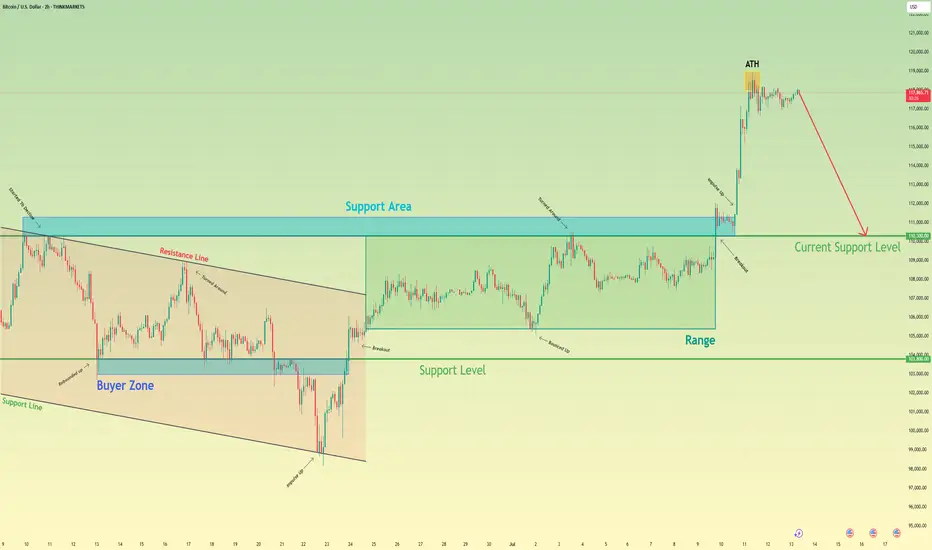
Bitcoin may make correction movement to support levelHello traders, I want share with you my opinion about Bitcoin. Price recently printed a new ATH at 118800 points and then began to show signs of correction. Before this breakout, the price was stuck in a long downward channel, where it bounced inside the buyer zone (103000–103800) several times and reversed upward. After the final breakout, BTC entered a range phase between the support level (103800) and the support area (110300–111300), building energy before the massive move. Once the price escaped this range, a strong impulse up followed, pushing BTC above all major levels and reaching a new high. However, after hitting the ATH, the price started to stall and consolidate. Currently, we can see signs of weakness at the top — the structure is forming lower highs and looks unstable, which may indicate a potential retracement. Now the price is trading above the support area, but I expect a corrective move back toward the current support level at 110300. This level aligns with the top of the previous range and now acts as strong demand. That’s why I’ve set my TP at 110300 level — right at the beginning of potential buyer interest. Please share this idea with your friends and click Boost 🚀
Disclaimer: As part of ThinkMarkets’ Influencer Program, I am sponsored to share and publish their charts in my analysis.
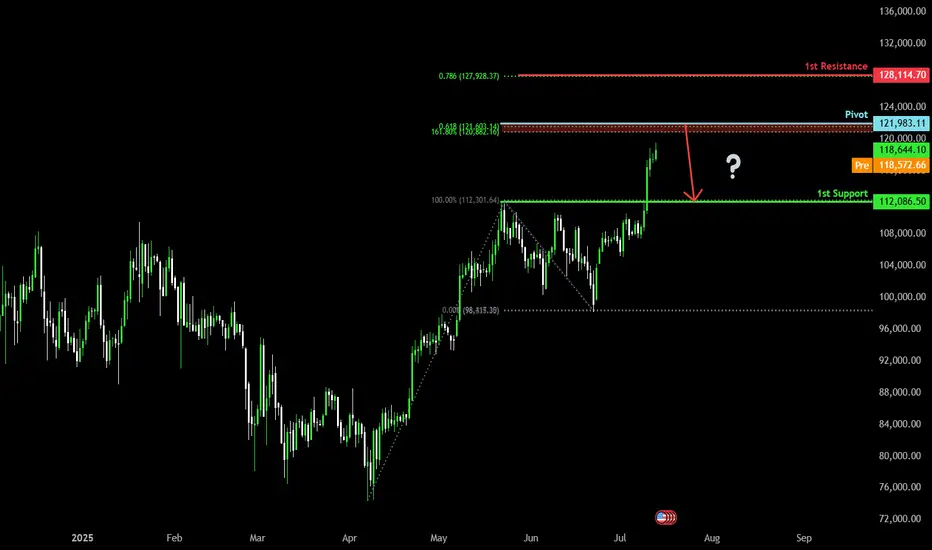
Bearish reversal off Fibonacci confluence?The Bitcoin (BTC/USD) is rising towards the pivot and could reverse to the 1st support which is a pullback support.
Pivot: 121,983.11
1st Support: 112,086.50
1st Resistance: 128,114.70
Risk Warning:
Trading Forex and CFDs carries a high level of risk to your capital and you should only trade with money you can afford to lose. Trading Forex and CFDs may not be suitable for all investors, so please ensure that you fully understand the risks involved and seek independent advice if necessary.
Disclaimer:
The above opinions given constitute general market commentary, and do not constitute the opinion or advice of IC Markets or any form of personal or investment advice.
Any opinions, news, research, analyses, prices, other information, or links to third-party sites contained on this website are provided on an "as-is" basis, are intended only to be informative, is not an advice nor a recommendation, nor research, or a record of our trading prices, or an offer of, or solicitation for a transaction in any financial instrument and thus should not be treated as such. The information provided does not involve any specific investment objectives, financial situation and needs of any specific person who may receive it. Please be aware, that past performance is not a reliable indicator of future performance and/or results. Past Performance or Forward-looking scenarios based upon the reasonable beliefs of the third-party provider are not a guarantee of future performance. Actual results may differ materially from those anticipated in forward-looking or past performance statements. IC Markets makes no representation or warranty and assumes no liability as to the accuracy or completeness of the information provided, nor any loss arising from any investment based on a recommendation, forecast or any information supplied by any third-party.
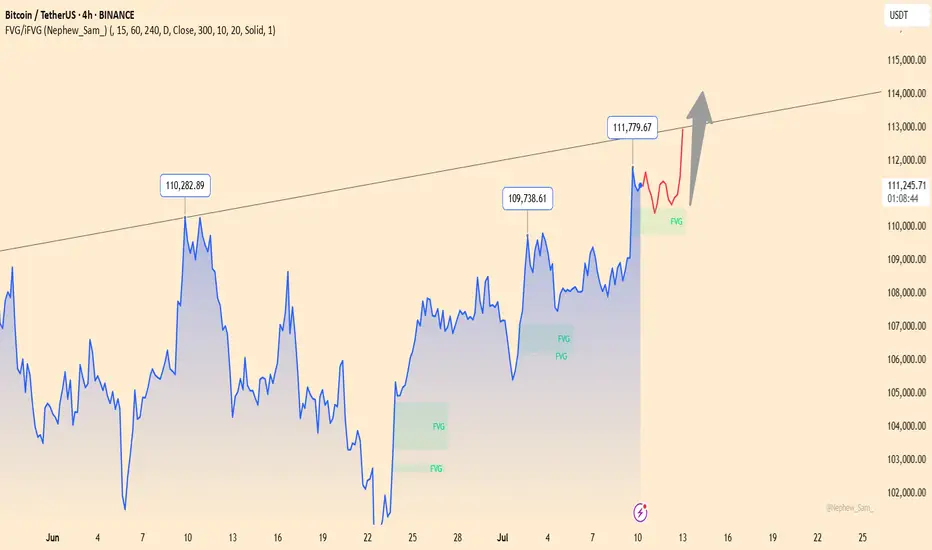
BTCUSDT – Bullish Momentum MaintainedBitcoin is maintaining a solid bullish structure after breaking out of its recent accumulation zone and filling the FVG gap around $110,400. On the H4 chart, BTCUSDT has just completed a successful retest near the dynamic support zone and is now aiming for the potential resistance at $112,949 – where it intersects with a long-term trendline. A breakout above this level could signal the start of a new expansion phase.
Major news from yesterday regarding new capital inflows into several approved spot Bitcoin ETFs, combined with rising expectations of a Fed rate cut later in Q3, are fueling strong buying momentum. This rally could gain even more strength if crypto markets continue to attract liquidity.
Bitcoin can rebound up from support line of upward wedgeHello traders, I want share with you my opinion about Bitcoin. In this chart, we can see how the price dropped from the 102800 support level, which coincided with the buyer zone, and later entered to wedge upward. In this pattern, price made an impulse up from the support line of the wedge pattern and broke the 102800 support level, after making a retest, and continued to move up. Bitcoin rose to the current support level, which coincided with a support area and even entered this area, but soon turned around and fell below. Next, price rose to this area again and then made a correction movement, after which it turned around and made an impulse up to the resistance line of the wedge, breaking the 108000 level. After this movement, the price bounced from this line and fell back to the current support level, where it some time traded in the support area. Later price rebounded and continued to move up. Now, I expect that BTC can correct to support line of the wedge and then rise to the resistance line of this pattern. That's why I set my TP at the 112600 points, which coincided with this line. Please share this idea with your friends and click Boost 🚀
Disclaimer: As part of ThinkMarkets’ Influencer Program, I am sponsored to share and publish their charts in my analysis.
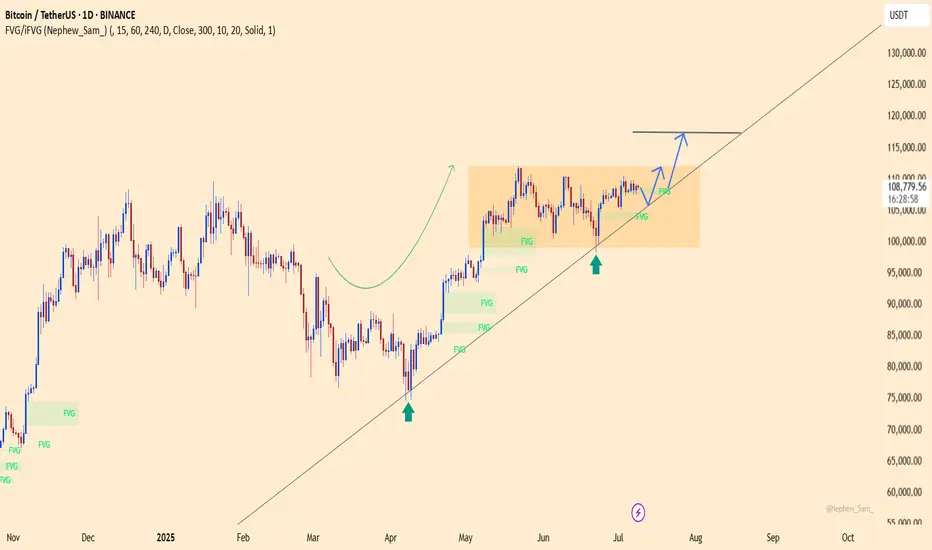
BTCUSDT – Calm Before the BreakoutBitcoin is holding firmly above the ascending trendline, consolidating within the accumulation range of $98,000 to $117,000. The current structure suggests that buyers remain in control, especially after a strong rebound from the $98,450 support zone.
In terms of news, BTC has been slightly affected by market concerns over new U.S. tariffs. However, on-chain data still shows strong accumulation around the $108,000 level. If this base holds, BTCUSDT could break out toward the $117,424 target in the near term. Conversely, if the trendline fails, the $98,000 level will be the final stronghold for the bulls.
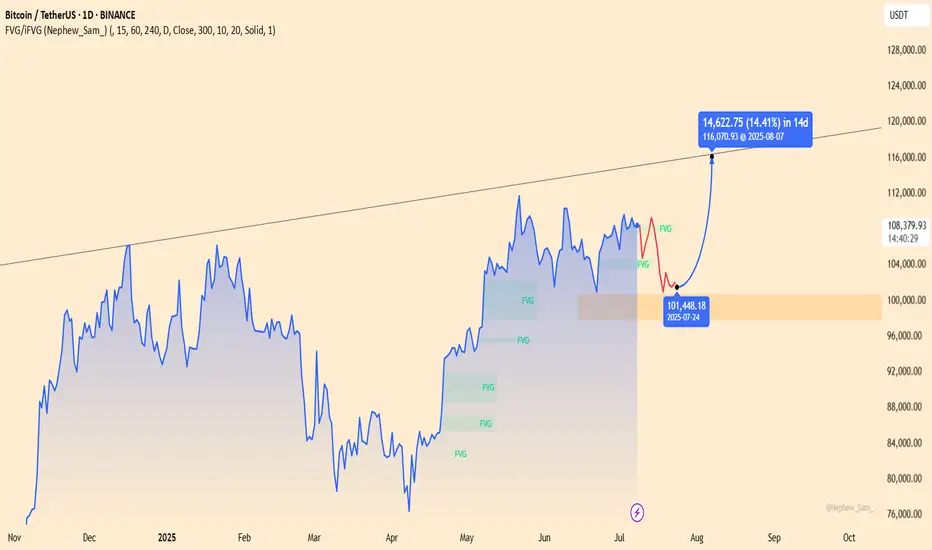
BTCUSDT – Ready to Launch from Accumulation Zone?BTCUSDT is consolidating around the $101,000 FVG zone – a previously strong launchpad. Price structure remains bullish, forming higher lows and showing a healthy throwback pattern.
If the $101,448 level holds, the next target could be $116,000 – a potential 14% rally in two weeks.
Fundamentals support the upside: expectations of Fed rate cuts and renewed ETF inflows are fueling fresh momentum for Bitcoin.
Still, watch for price action confirmation – and always manage your risk!
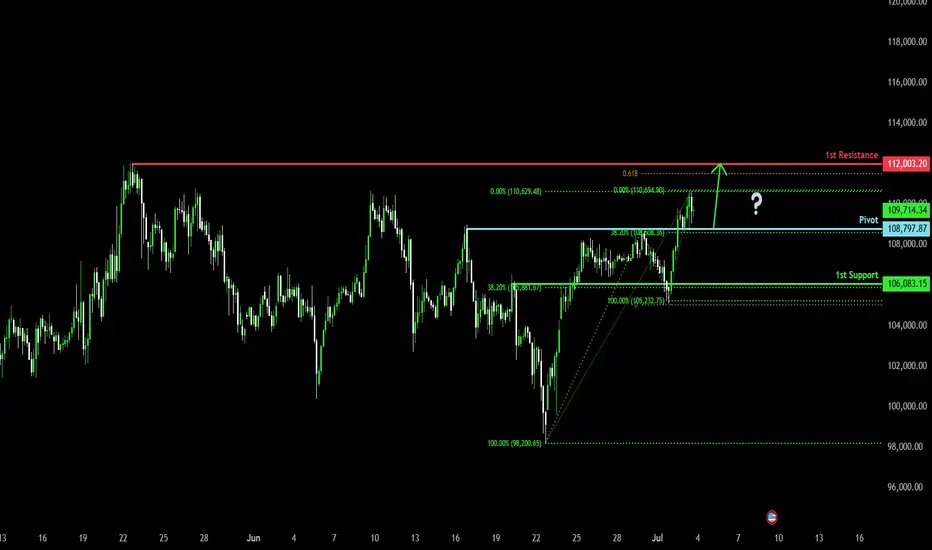
Bullish bounce for the Bitcoin?The price is falling towards the pivot which is a pullback support and could bounce to the 1st resistance.
Pivot: 108,797.87
1st Support: 106,083.15
1st Resistance: 112,003.20
Risk Warning:
Trading Forex and CFDs carries a high level of risk to your capital and you should only trade with money you can afford to lose. Trading Forex and CFDs may not be suitable for all investors, so please ensure that you fully understand the risks involved and seek independent advice if necessary.
Disclaimer:
The above opinions given constitute general market commentary, and do not constitute the opinion or advice of IC Markets or any form of personal or investment advice.
Any opinions, news, research, analyses, prices, other information, or links to third-party sites contained on this website are provided on an "as-is" basis, are intended only to be informative, is not an advice nor a recommendation, nor research, or a record of our trading prices, or an offer of, or solicitation for a transaction in any financial instrument and thus should not be treated as such. The information provided does not involve any specific investment objectives, financial situation and needs of any specific person who may receive it. Please be aware, that past performance is not a reliable indicator of future performance and/or results. Past Performance or Forward-looking scenarios based upon the reasonable beliefs of the third-party provider are not a guarantee of future performance. Actual results may differ materially from those anticipated in forward-looking or past performance statements. IC Markets makes no representation or warranty and assumes no liability as to the accuracy or completeness of the information provided, nor any loss arising from any investment based on a recommendation, forecast or any information supplied by any third-party.
Bitcoin will drop from resistance level and fall to 103500 levelHello traders, I want share with you my opinion about Bitcoin. Some days ago, price entered the pennant, where it turned around from the seller zone, which coincided with the resistance level, and dropped to the 103500 support level. Then it bounced and tried to grow, but soon failed and dropped below the 103500 support level, which coincided with the buyer zone and reached the support line of the pennant. Following this movement, BTC experienced an upward impulse, breaking the 103,500 support level and subsequently exiting the pennant pattern, before rising to the resistance level. Price broke this level and then started to decline inside another pennant pattern. In this pattern, the price dropped top 103500 support level again and then tried to bounce back, but failed and continued to decline. In a short time, it fell to the support level, broke it, and then fell to the support line of the pennant. Next, BTC turned around and repeated an impulse up to the resistance line of the pennant and exited from this pattern. Then it rose to the seller zone, where it rebounded from it and fell, but recently it rebounded and started to grow. Now, I expect that price will reach the resistance level and then drop to the 103500 support level. For this case, this level is my TP. Please share this idea with your friends and click Boost 🚀
Disclaimer: As part of ThinkMarkets’ Influencer Program, I am sponsored to share and publish their charts in my analysis.