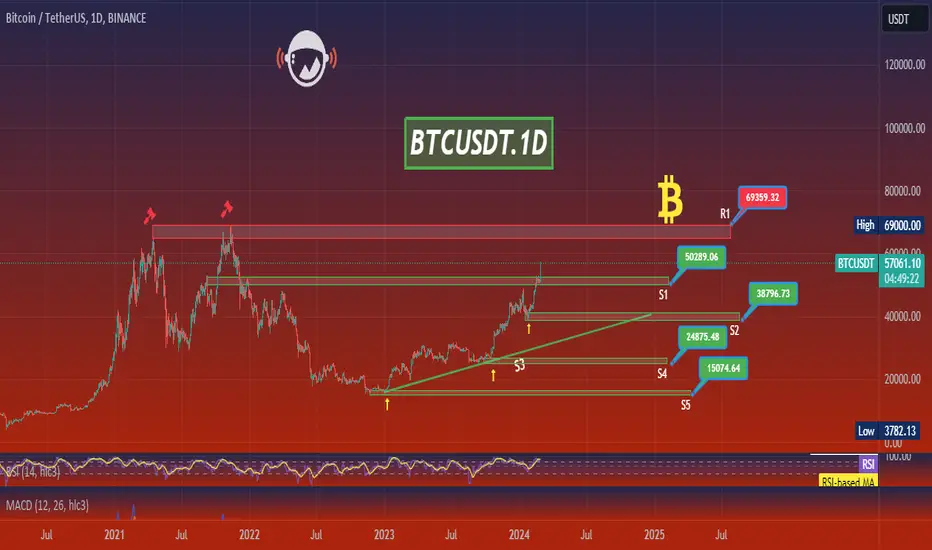
BTCUSDT.1DBased on the provided market data, Bitcoin (BTC) is currently trading at $57,147 against USDT.
In the 4-hour chart, the Relative Strength Index (RSI) is at 88.21, which is significantly above the 70 threshold, indicating that the asset is currently overbought. The Moving Average Convergence Divergence (MACD) is at 1330.0, indicating bullish momentum. However, the Bollinger Band (Bb4h) at 57346.0 suggests that BTC is nearing its upper limit. The resistance levels are at $57,500, $59,400, and $60,400, while the support levels are at $49,012, $48,000, and $45,900.
On the daily chart, the RSI is at 87.16, still indicating overbought conditions. The MACD is at 2316.0, suggesting bullish momentum. The Bollinger Band (Bb1d) is at 57416.0, indicating that BTC is trading near its upper limit. Resistance levels are at $57,600, $64,000, and $65,300, while support levels are at $50,830, $41,419, and $36,600.
Lastly, on the 7-day chart, the RSI is at 84.24, suggesting the asset is overbought. The MACD is at 5383.0, indicating strong bullish momentum. The Bollinger Band (Bb7d) is at 57500.0, which means BTC is trading near its upper limit. Resistance levels are at $64,200, $69,400, and $72,300, while support levels are at $42,250, $29,900, and $25,900.
In conclusion, the market data suggests that BTC is currently overbought and trading near its upper limit across different time frames. This could indicate that a price correction might be imminent. However, the strong bullish momentum reflected in the MACD values across all time frames suggests that the upward trend might continue.
Please note that this analysis is based on historical data and does not guarantee future performance. It is always recommended to do your own research before making any investment decisions.
Btc-usdt
USDT DominanceGood morning friends,
Been taking a look into a lot of charts on the 3M lately.
Keeping my views.
Trade thirsty!

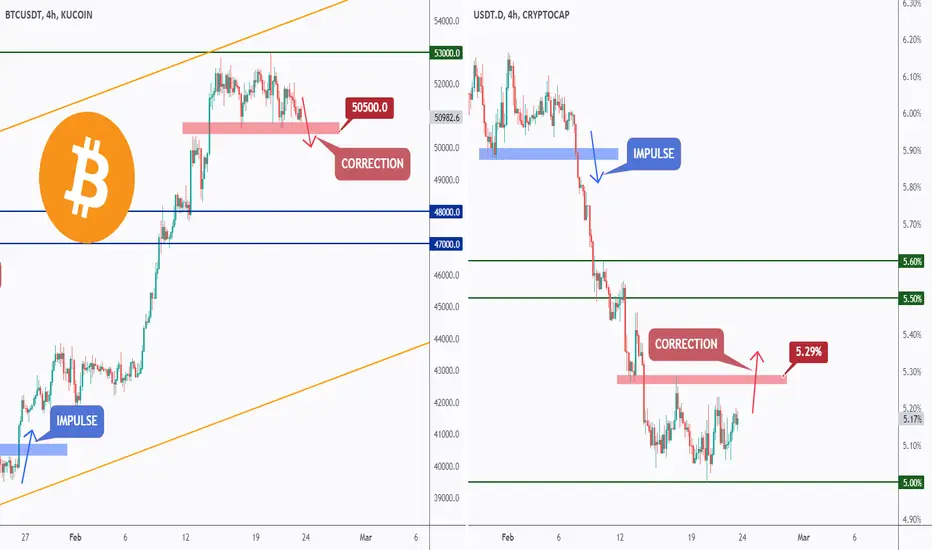
📌BTC vs USDT.D - Who Follows Whom? 👀Hello TradingView Family / Fellow Traders. This is Richard, also known as theSignalyst.
I always keep an eye on USDT.D to gauge the overall crypto market sentiment.
📚 Today, I want to demonstrate the correlation between BTC and USDT.D:
- Last month, BTC broke above the previous major high (shown in blue), while USDT.D broke the previous major low and initiated an impulse movement.
- BTC is currently fluctuating within a narrow range around the $53,000 resistance level, while USDT.D is hovering around the 5% support level and the round number.
- BTC is expected to maintain its bullish trend unless it breaks below the last major low at $50,500, which would correspond to USDT.D dropping below 5.29%.
And so on... the picture is self-explanatory.
The question is... Who Follows Whom?
📚 Always follow your trading plan regarding entry, risk management, and trade management.
Good luck!
All Strategies Are Good; If Managed Properly!
~Rich
Bitcoin can grow from support area to resistance line of wedgeHello traders, I want share with you my opinion about Bitcoin. Looking at the chart, we can see how the price some days ago started to trades in the range, where firstly it declined to the support level, which coincided with the buyer zone and bottom part of the range. After this, the price rebounded up and rose to 48950 points, but then it turned around and started to decline. As well, the price entered to upward wedge, where it fell to the support line, thereby exiting from the range and breaking the 41700 level, but soon BTC turned around and started to move up. Soon, the price broke the 41700 level and later made little correction to the support line of the wedge, after which Bitcoin made a strong upward impulse to the resistance line, breaking the current support level, which coincided with the support area. But a not long time ago it rebounded and now the price trades near the support level in the support area inside the wedge. In my mind, BTC can decline to the support level and then rebound up to the resistance line of the wedge. For this reason, I set my target at the 54000 level, which coincided with the resistance line. Please share this idea with your friends and click Boost 🚀

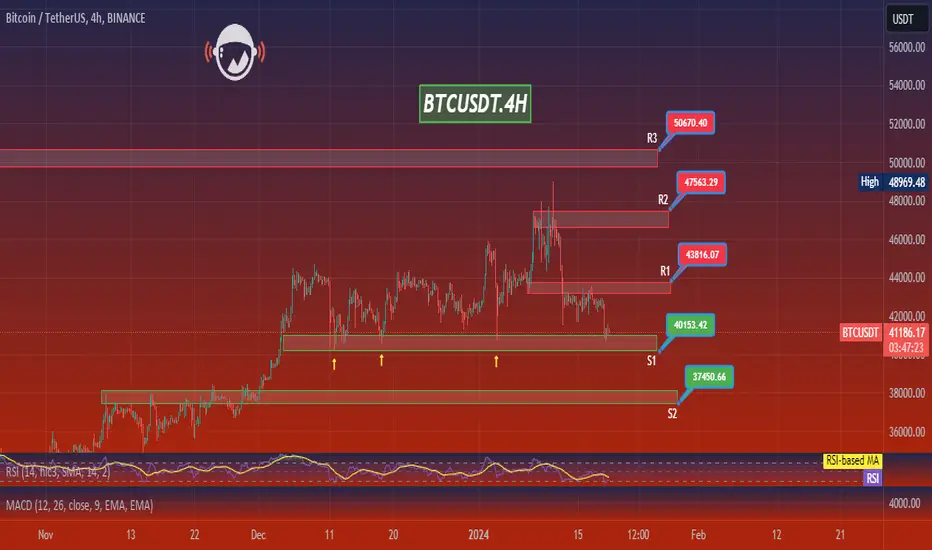
Bitcoin: Fake Out Signal - Watch Out Bears!Bitcoin has been trading within a well-defined range since a week. A few days ago, the range has set a clear low around 50.600$. My expectation is, in case the yellow support area will fail, that BTC will make a fake out to trick the bears.
Longer-term time frames are still overly bullish, so the path of least resistance is up at this point. Ideally, we will see an hourly oversold reading on the RSI, which would further strengthen the bullish fake-out case.

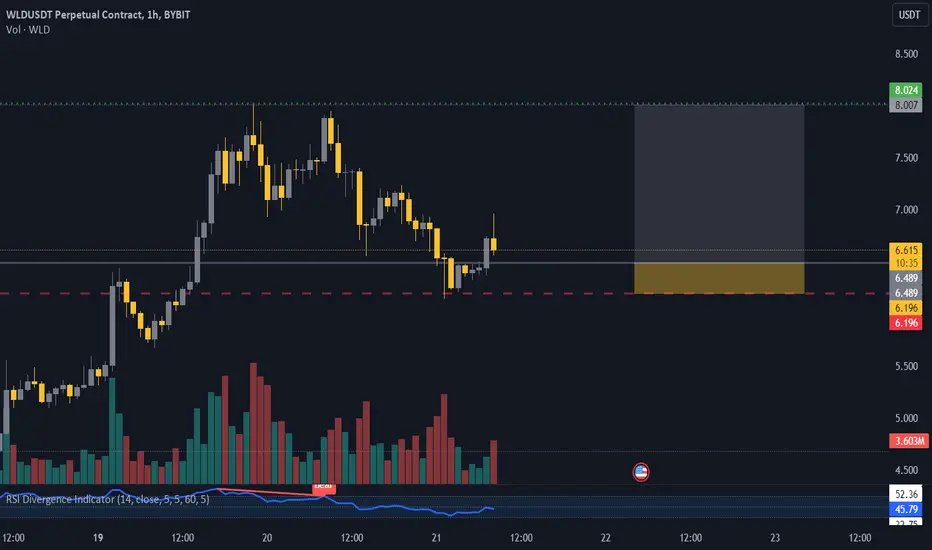
WLDUSDT LIMIT ORDER!!BYBIT:WLDUSDT.P
Today I have WLD for a limit order I'm predicting this one to keep going for a continuation here as the weekly still looks strong and this chart is just too clean not to have a limit in, let's go!
Thanks guys!
Bitcoin can make correction movement to 48900, exiting of rangeHello traders, I want share with you my opinion about Bitcoin. Looking at the chart, we can see how the price a not long time ago made downward impulse from resistance line of the pennant to 41500 support level, which coincided with buyer zone. After this movement, BTC some time traded near this level, after which in a short time price broke this level and declined to support line of pennant. Then BTC turned around from support line and started to grow to 41500 support level. Soon, the price broke this level one more time and continued to move up to the resistance line of pennant, and after reached this line, BTC fell to the support line and then made a strong upward impulse to 48900 level, which coincided with the support area, thereby exiting from the pennant. In a short time later, price broke 48900 level, made retest and rose a little higher, but a not long time ago it started to trades in range, where price continues to trades to this day. In my mind, Bitcoin can decline to the bottom part of the range, then make little movement up, after which continue to fall to the current support level, thereby exiting from range. For this reason, I set two targets, first target at the 50600 level, and second - at the 48900 support level. Please share this idea with your friends and click Boost 🚀

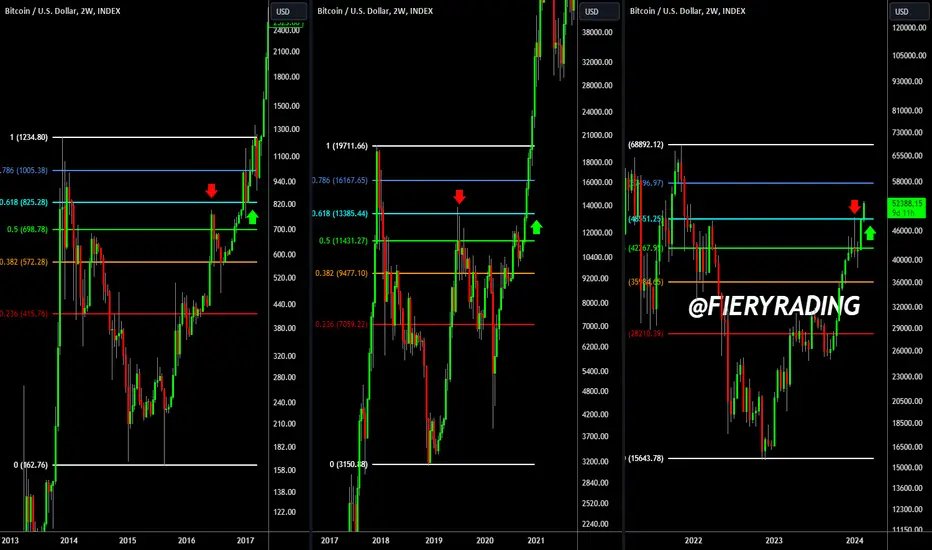
🔥 Bitcoin: Fibonacci Signals New All-Time High Soon 🚨In this analysis I want to compare the start of the previous two bull-cycles with the current one. Specifically, I want to look at the Fibonacci retracements drawn on the chart.
During the start of the bull-runs, the 0.618 (light blue) Fibonacci retracement has always played a key role. First, the price has always rejected once from the 0.618 area once (red arrows). However, the second time that the price reaches the 0.618 Fibonacci retracement it has always broken through.
This break out has always started a new bull-run with new all-time highs. If history will repeat, we can expect that BTC is going to see a few very bullish months ahead and will make new all-time highs in the near future.
Do you think that this is the bull-run that we've been waiting for? Share your thoughts🙏
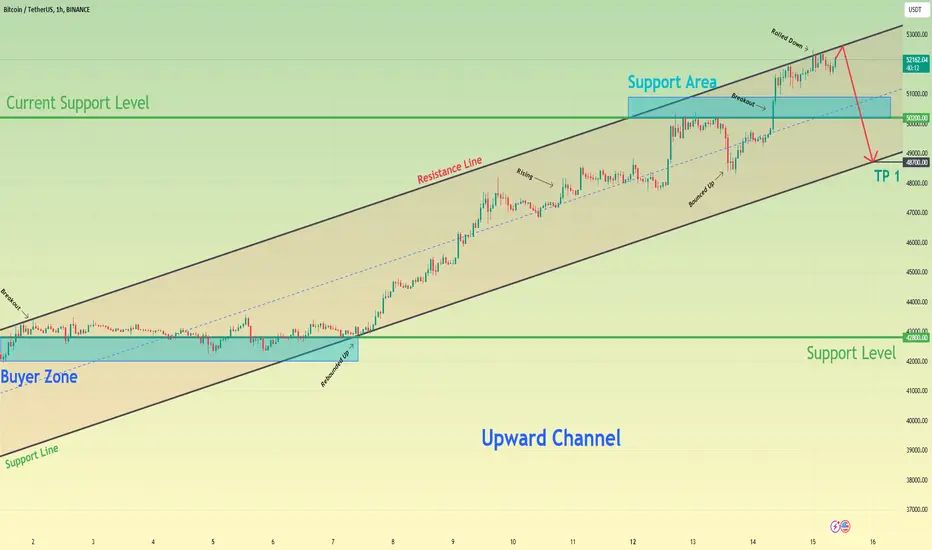
Bitcoin can rebound down of resistance line to 48700 in channelHello traders, I want share with you my opinion about Bitcoin. By observing the chart, we can see that the price a not long time ago breakout the 42800 support level, which coincided with the buyer zone inside the upward channel and started to trades near this level. Some time BTC fell to the buyer zone, but at once it backing up, and later price finally rebounded from the support line and continued to move up in the channel. A few moments later BTC reached 50200 current support level, which coincided with the support area, but at once made little correction, after which the price turned around and rose back to this level. Soon, Bitcoin broke the 50200 level and even later rose higher than the support area and reached the resistance line of the channel. But recently price rolled down from this line and at the moment it trades near, so in my mind, Bitcoin can rise to the resistance line and then start to decline to the support line, thereby breaking the support level. For this reason, I set my target at 48700 points, which coincided with the support line of the upward channel. Please share this idea with your friends and click Boost 🚀
BTCUSDT.1DBased on the market data provided, the current price of Bitcoin (BTC) against Tether (USDT) is $52,089.
The Relative Strength Index (RSI) for 4 hours, 1 day and 7 days are 76.33, 84.40 and 80.84 respectively. These values indicate that BTC is currently in the overbought territory, suggesting that a price correction might be imminent.
The Moving Average Convergence Divergence (MACD) for 4 hours, 1 day and 7 days are 1163, 2323 and 5140 respectively. The positive MACD values indicate that the bulls are currently in control.
The Bollinger Bands (BB) for 4 hours, 1 day and 7 days are all at 53570, indicating a relatively stable price volatility.
The support levels for 4 hours, 1 day and 7 days are $51,056, $47,500 and $40,000 respectively, while the resistance levels for the same periods are $53,351, $53,230 and $53,800.
In my opinion, while the market is currently bullish, the high RSI values suggest that the market is overbought, and a price correction might be on the horizon. As such, it might be a good idea to exercise caution and consider taking profits or setting stop-loss orders to protect your investment. However, if BTC manages to break through the resistance levels, we could see further upside.
Keep in mind that this analysis is based on historical data and does not guarantee future results. Always do your own research and consider your financial situation and risk tolerance before making investment decisions.

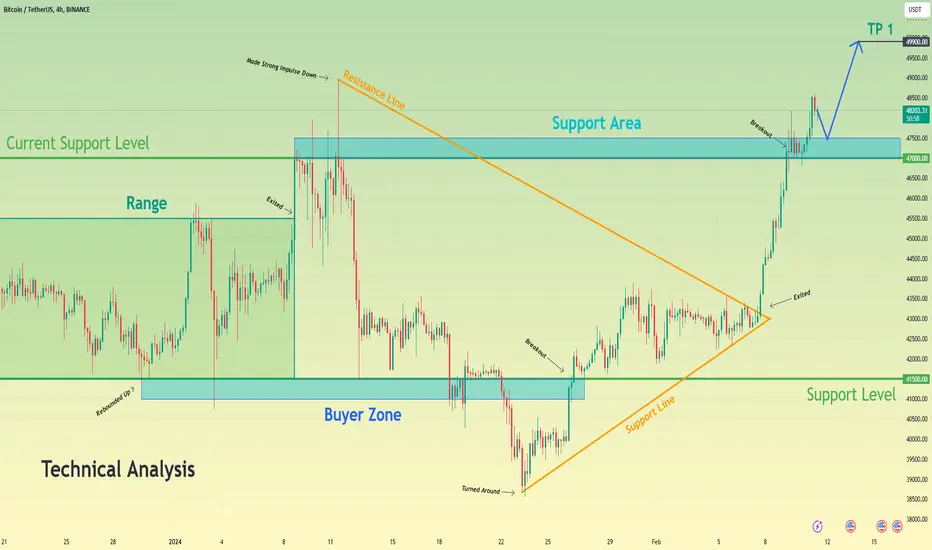
Bitcoin can little correct and then continue to move upHello traders, I want share with you my opinion about Bitcoin. Observing the chart, we can see that the price some days ago traded in the range, where it firstly declined to the 41500 support level, which coincided with the buyer zone, but soon BTC turned around and made impulse up higher than the bottom part of the range, thereby exiting from it. Next, the price entered to the pennant, where it rose to the resistance line, after which it made a strong downward impulse to the support line, thereby breaking two levels - 47000 and 41500. Later price turned around from the support line and in a short time rose higher than the 41500 level, breaking it one more time and little time later BTC reached the resistance line of the pennant and broke it too, exiting from the pennant pattern. After this movement, Bitcoin rose to its current support level, which coincided with the support area, and recently broke it also, after which the price made a retest and continued to move up. At the moment, the price trades near the support area, and in my mind, Bitcoin can correct to the support area, and then BTC will bounce and continue to grow. For this case, I set my target at the 49900 level. Please share this idea with your friends and click Boost 🚀
Bitcoin can make little movement up, and then start to fallHello traders, I want share with you my opinion about Bitcoin. Observing the chart, we can see that the price a not long time ago started to trades inside the upward channel, where it first declined to the support line, after which it rebounded and rose to the 39900 support level, which coincided with the buyer zone. Next, the price some time traded near this level, and soon broke it, after which BTC rebounded up to the next level in the channel. In a short time price broke the 41800 level too, after which it started to trades inside from range, thereby exiting of upward channel. In range, BTC some time traded near the support area, which coincided with the bottom part and 41800 level, and later rebounded from this zone to top part of range. After this movement, Bitcoin turned around and made a correction back to the support area, but it at once bounced and continued to trades near the support area. Now, I think that Bitcoin can rise a little more, after which the price make correction to support the area again. For this case, I set my target at the current support level - 41800. Please share this idea with your friends and click Boost 🚀

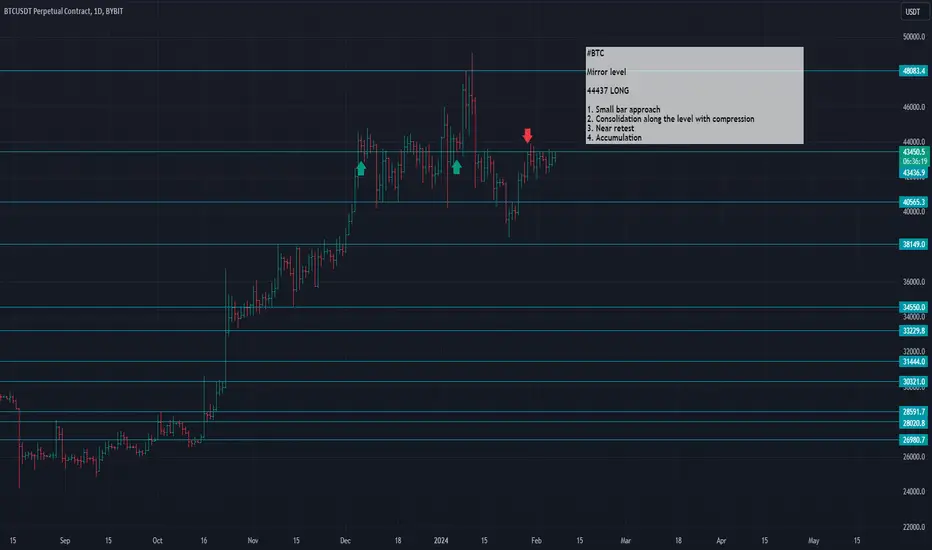
BTC 44437 LONG#BTC
Mirror level
44437 LONG
1. Small bar approach
2. Consolidation along the level with compression
3. Near retest
4. Accumulation
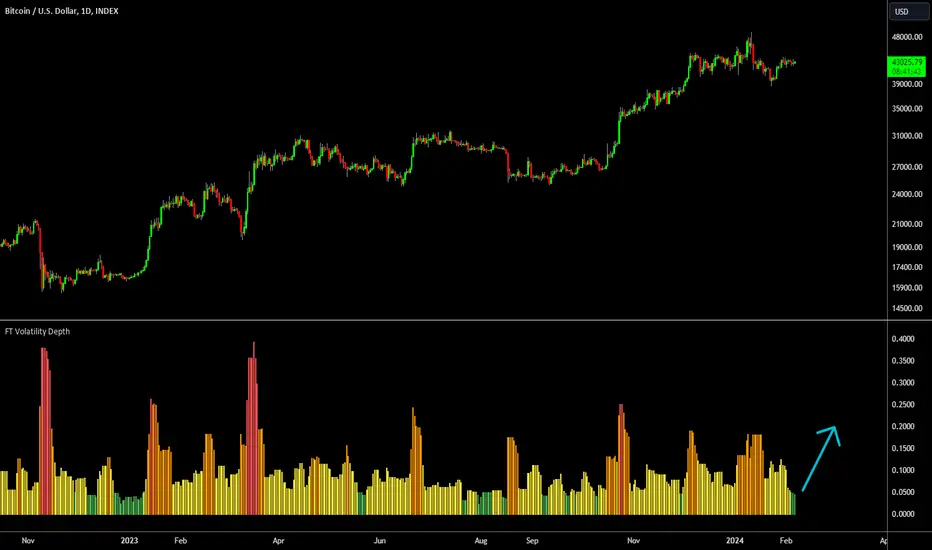
🔥 Bitcoin Low Volatility Alert: Extreme Move Incoming!Bitcoin has seen some extremely low volatility over the last couple of days. Every time that the indicator flashed green (low volatility), a big move in price was coming rather sooner than later.
Over the last year, most of the low-volatility-alerts have signaled a bullish move. Only in July and August it preceded a bearish move.
Something will happen, but it remains uncertain which direction the price will go. I've been quite bearish on the price ever since the ETF top, so wouldn't be surprised if we go down further.
BTC a short idea...Evening fellas,
Mid term short idea.
I never liked BTC when it's just flirting with resistance, so to me it's worth the risk.
Gonna leave this chart as is and check in the future.
Trade thirsty my friends.

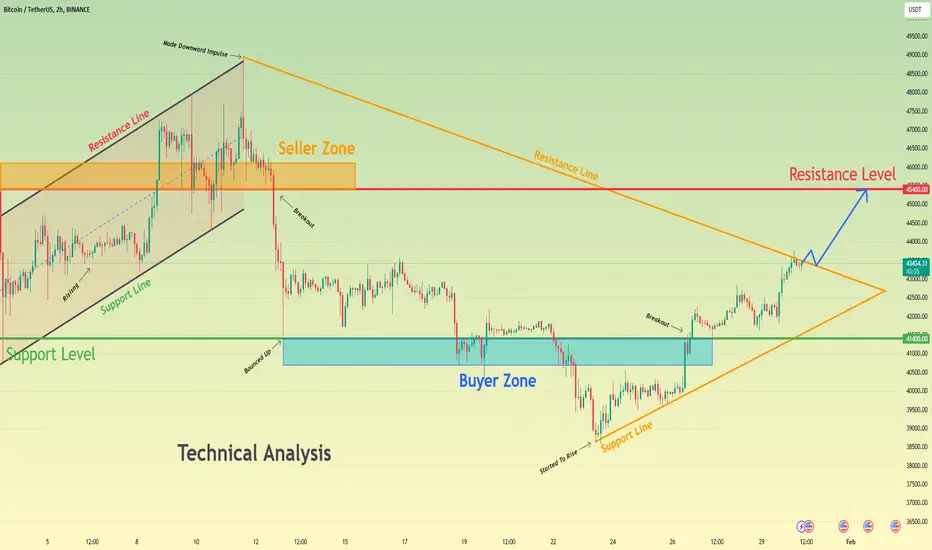
Bitcoin can exit from pennant and continue grow to 45400 levelHello traders, I want share with you my opinion about Bitcoin. By observing the chart, we can see that the price a few time ago declined to the 41400 support level, where it turned around and started to rise inside the upward channel. In the channel, BTC rose to a 45400 resistance level, which coincided with the seller zone and soon broke this level. Price rose a little higher, after which it exited from the channel, entered to pennant, and at once made a downward impulse from the resistance line to the support level, thereby breaking the 45400 level one more time. Next, BTC some time traded near the 41400 support level, and later it declined to support line of the pennant, breaking the support level, but soon price turned around and in a short time rose back. Also recently BTC rose to the resistance line of the pennant, where it continues to trades near now. So, in my mind, Bitcoin can break the resistance line, thereby exiting from the pennant, make a retest, and then rebound up to the resistance level, or after the breakout of the resistance line, BTC will at once continue to move up to the resistance level. For this reason, I set my target at the 45400 resistance level. Please share this idea with your friends and click Boost 🚀
Bitcoin(BTC): Looking For Breakdown Of $40KBitcoin is looking better than ever. Last week we had a nice downward movement, and the current week started with some sharp movement to lower zones towards that $40K zone.
As you all know, we have been looking at two major zones of $34K and $26K (which hold the most liquidity), which is more of a mid-term movement for us, but in the short-term we are looking for a clean breakdown of that $40K zone, which is basically the last zone to hold the price of BTC as of now.
Upon breaking this zone, we will see some deep downward movement to our major target zone!!
Swallow Team
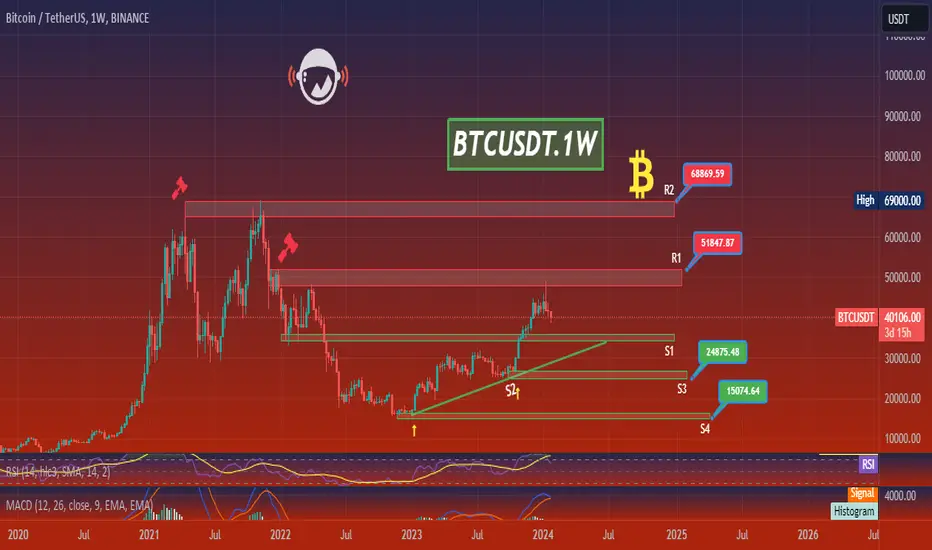
BTCUSDT.1WBased on the provided market data, the current price of Bitcoin (BTC) is $40,072.01. The Relative Strength Index (RSI) over 4 hours, 1 day and 7 days is 44.75, 40.69, and 64.21 respectively. The RSI is a momentum indicator that measures the speed and change of price movements, with a value below 30 typically interpreted as a bullish signal (potentially over-sold) and above 70 a bearish signal (potentially over-bought). In this case, the RSI values suggest that BTC is neither overbought nor oversold.
The Moving Average Convergence Divergence (MACD) for BTC over 4 hours, 1 day, and 7 days is -306.14, -829.16, and 3742.30 respectively. The MACD is a trend-following momentum indicator that shows the relationship between two moving averages of a security’s price. Negative MACD values suggest that BTC is on a downward price trend, while the positive 7-day MACD suggests a potential upward trend in the longer term.
The Bollinger Bands (BB) for the same periods are 41379.0, 47268.0, and 48740.0 respectively. Bollinger Bands are a volatility indicator. Prices are high at the upper band and low at the lower band. In this case, BTC's current price is below the middle band suggesting it's relatively low.
The support levels for 4h, 1d, and 7d are $38,595.0/$38,261.0/$35,920.0, $42,790.0/$40,633.0/$40,190.0 and $35,685.0/$30,600.0/$26,868.0 respectively. The resistance levels for the same periods are $41,684.0/$43,066.0/$43,564.0, $44,393.0/$44,900.0/$48,900.0 and $52,200.0/$59,200.0/$69,100.0 respectively.
In conclusion, the short-term indicators suggest a bearish trend for BTC, with the price below the middle Bollinger Band and negative MACD values. However, the positive 7-day MACD and the RSI values suggest that there may be potential for an upward trend in the longer term. As always, it's important to consider these indicators as part of a broader strategy and to consider other market factors when making investment decisions.
My expectation for Bitcoin for next 2 years Without any additive descriptions, I think target of this cycle will be around 190K, and we will reach this target around April 2025. That's all

🔥 Bitcoin: Just A Dip? What Does 2016 Tell usPreface: I'm still bearish on BTC as per my most recent analyses. The ETF launch likely signaled a major top, potentially until the halving. My most likely scenario's are shown below.
That being said, I think it's worthwhile to look at the market from different perspectives.
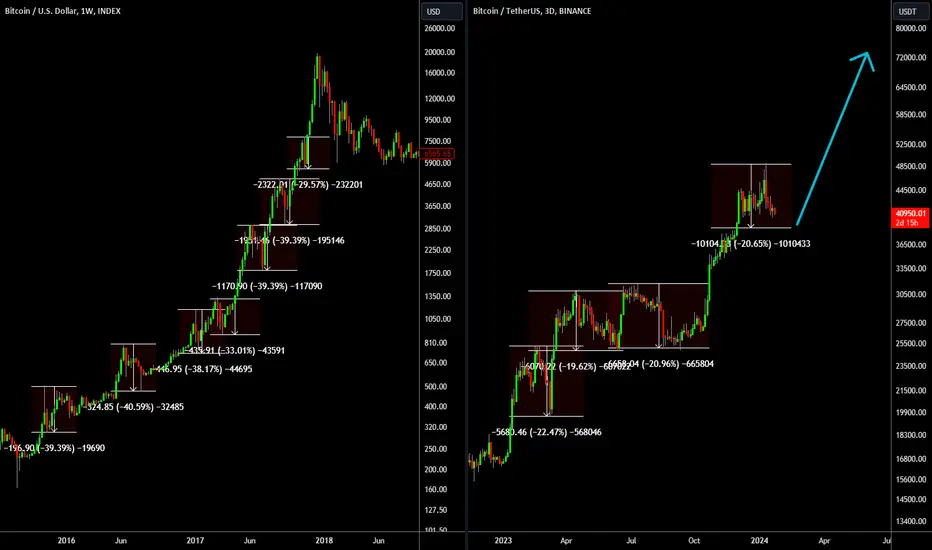
In this analysis I'm going to compare the 2016-2017 bull-run with the 2023 bull-run. Back then, BTC experienced many 30%-40% drops over the course of 2 years. In the end, every dip was a dip to be bought which led to some very good returns.
Thus far, the 2023 (and 2024) bull-run has had several dips around 20%, which all proved to be very good entry points. We had to admit to ourselves that it's possible that the drop after the ETF launch is a dip to be bought.
Furthermore, the dips getting less deep than 8 years ago is a natural consequence of the market maturing and becoming less volatile.
Is this just a dip, or are we facing a longer-term correction? Happy to hear your thoughts!
BTCUSDT.4HBased on the provided market data, BTC is currently priced at $41,270 against USDT. The 4-hour Relative Strength Index (RSI) is at 32.58, indicating an oversold condition and possibly an upcoming price rebound. However, the 4-hour Moving Average Convergence Divergence (MACD) is at -500.32, suggesting a bearish market scenario.
The Bollinger Bands (BB) for 4 hours, 1 day and 7 days are at $43,860, $47,150 and $48,530 respectively. These values indicate that BTC is currently trading below its average price, suggesting a bearish trend.
The support levels for 4 hours, 1 day and 7 days are $40,568, $40,500, and $35,400 respectively. If the price drops below these levels, it could potentially fall further to the next support levels at $40,100, $38,500, and $30,600 or even to the third support levels at $38,600, $37,300, and $24,700.
The resistance levels for 4 hours, 1 day and 7 days are $43,937, $43,900, and $48,300 respectively. If the price breaks these levels, it could potentially rise further to the next resistance levels at $46,600, $47,500, and $51,910 or even to the third resistance levels at $47,500, $49,300, and $59,700.
The 1-day and 7-day RSI are at 40.86 and 70.52, indicating a slightly oversold condition on a daily basis but an overbought condition on a weekly basis. The 1-day and 7-day MACD are at -145.30 and 3996.50 respectively, suggesting a bearish scenario in the short term but a bullish scenario in the long term.
In conclusion, the market data suggests a bearish scenario in the short term with potential for a rebound due to the oversold condition. However, the long term trend appears to be bullish. As always, these indicators should not be used in isolation and other market factors should also be considered. Please use this analysis responsibly and conduct your own research before making any investment decisions.
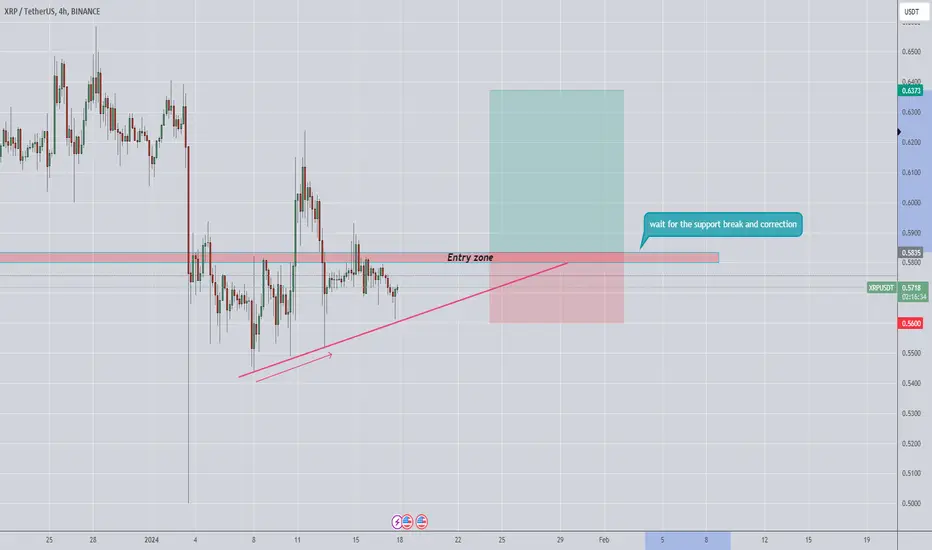
XRP/USDT Analysis - Anticipating a Price Increase Post ResistancThe XRP/USDT pair is currently under scrutiny, and a positive outlook is emerging from the analysis. The anticipation is for a potential price increase, contingent on the breakout of a significant resistance level as indicated on the chart.
Current Observation: The present market conditions for XRP/USDT exhibit promising indicators that suggest a bullish sentiment.
Resistance Breakout: The key focal point of this analysis lies in the awaited breakout of a resistance level highlighted on the chart. The price is expected to experience upward momentum once this resistance barrier is convincingly breached.
Chart Analysis: Refer to the chart for specific details on the identified resistance level. This breakout could serve as a catalyst for a sustained upward movement in XRP/USDT.
Confirmation Factors: Look for additional confirmation factors such as increased trading volumes, supportive indicators (like RSI or MACD), and other technical signals that may strengthen the conviction in the impending bullish move.
Risk Management: Despite the positive outlook, it's crucial to implement sound risk management strategies. Set stop-loss orders and be prepared to adapt your approach based on real-time market developments.
Price Targets: Once the resistance is broken, consider establishing price targets for potential take-profit levels. This can be based on further technical analysis or predefined profit objectives.
Remember, the cryptocurrency market can be dynamic and subject to rapid changes. Stay vigilant, keep a close eye on the evolving market conditions, and be ready to adjust your strategy accordingly.
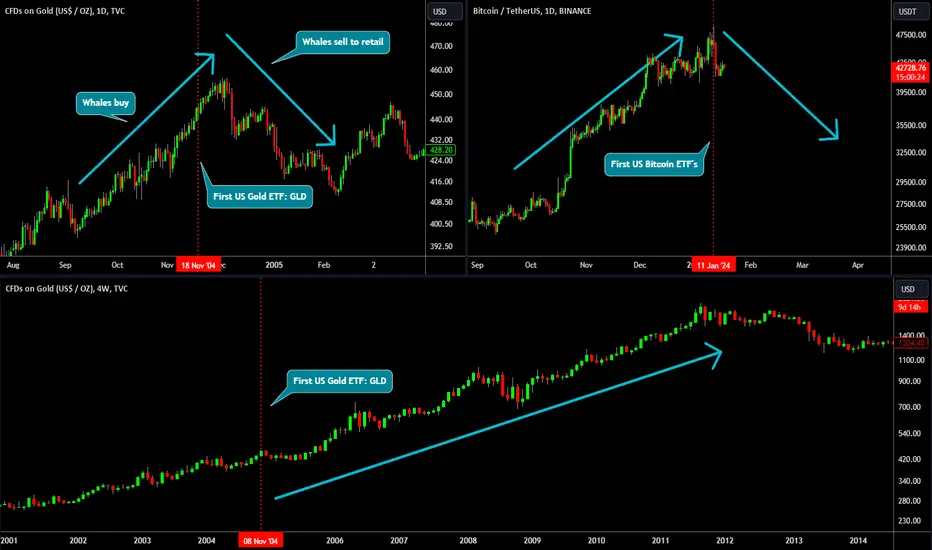
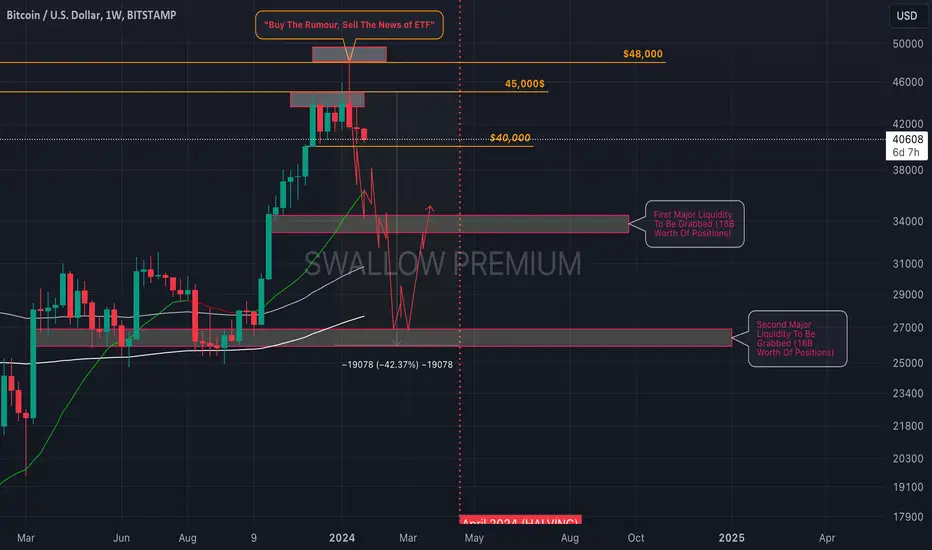
🔥 How The Gold ETF Can Predict Bitcoin's Performance After ETFIn many of my recent BTC analyses I've been talking about my view on the ETF. My prediction was that the ETF would be a sell-the-news event and mark a local top. Thus far, my view has been correct.
In this analysis I want to take a look at the Gold ETF and its effect on the short- and long-term price movement of the underlying asset Gold.
My short-term view on both ETF launches is as follows:
- Whales (big banks and the like) buy the rumour. Likely, they have more knowledge about the ETF launching than the retail investors.
- ETF launches, whales create hype around the ETF to lure retail in.
- Whales sell their assets to retail, which drives the prices down.
As per Bitcoin, the correction has just started in my view. We can go much lower from this point.
However, this ETF is great news in the long-term. As seen on the bottom chart, Gold went up for almost 7 years after the ETF launch. I doubt that BTC will go up for 7 years, but the statistics don't lie. An ETF is a great way to lure more traders to the market.
Think about it, how many more people will buy crypto during bull-markets when it's as accessible as a stock? This ETF could very well put increasing bullish pressure on Bitcoin's price, potentially bringing the next-bull market top to unforeseen highs. A man can hope.
Share your thoughts about the short- and long-term price action of BTC after the ETF.