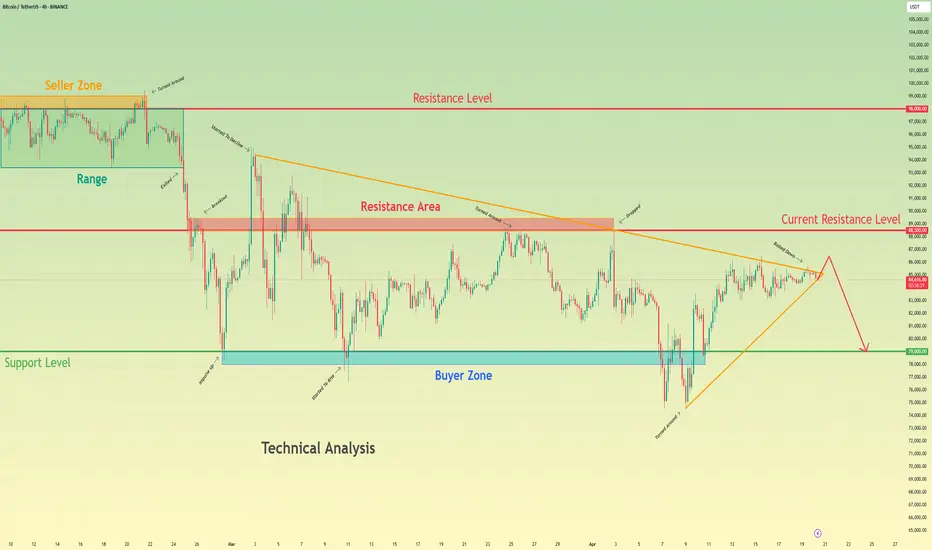
Bitcoin may exit from pennant and fall to support levelHello traders, I want share with you my opinion about Bitcoin. Over the past weeks, the price traded inside a broad horizontal range, repeatedly testing the boundaries of the seller zone and the buyer zone. After several failed breakouts, the price sharply dropped from the upper range and entered a phase of lower highs, forming a downward pennant structure. Inside this pennant, the market continued consolidating under pressure from the resistance area. Each attempt to break above the resistance line was met with rejection, confirming strong selling interest near the current resistance level at 88500. At the moment, BTC is testing the upper boundary of the pennant again. This area aligns closely with the resistance level and the long-term descending trendline. Given this confluence and historical rejection zones, I expect BTC to face resistance and reverse, initiating a decline back toward the 79000 support level, thereby exiting from the pennant, which is my current TP1. The compressed price structure, repeated rejections, and clean pattern formation support this bearish outlook in the short term. Please share this idea with your friends and click Boost 🚀
Btc-usdt
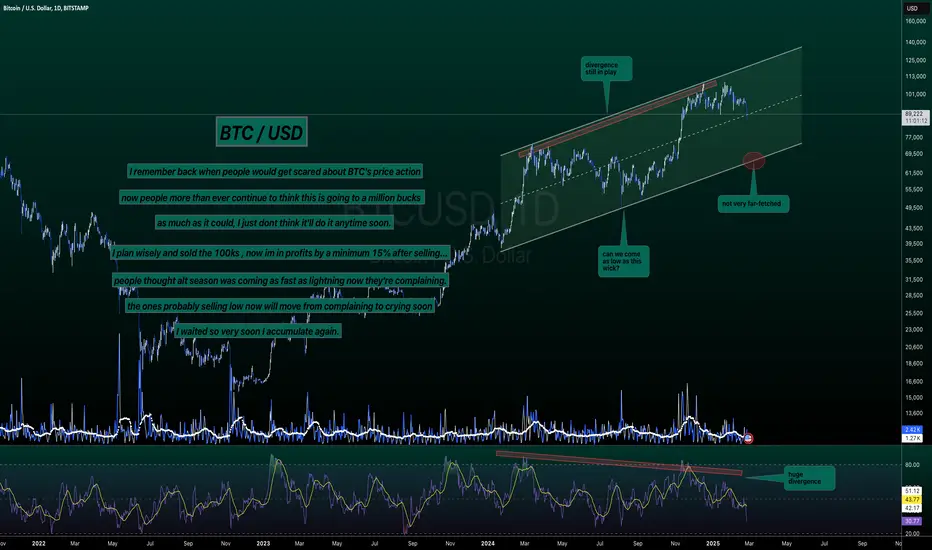
People Used To Get Scared - BTC / USDMorning folks,
Read the chart, it contains all information.
I figured since I didn't update my inverted Adam & Even pattern chart much I'd just create a new one, but check it out, its playing marvelously.
Trade thirsty!
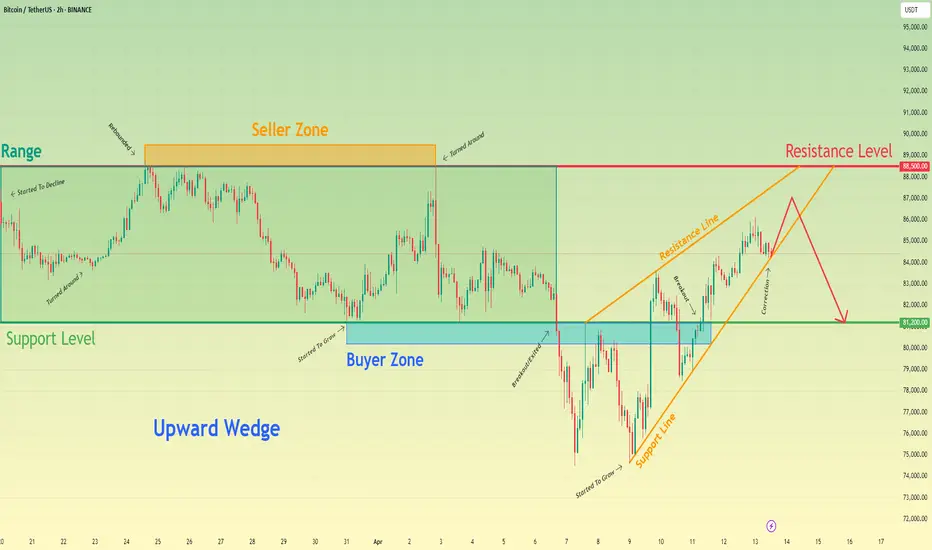
Bitcoin can exit from wedge and then drop to support levelHello traders, I want share with you my opinion about Bitcoin. Earlier, the price was moving inside a broad horizontal range, with clear rejections from both support and resistance. The lower boundary of this range was located near the support level at 81200 points, and the market found solid footing there. After a series of bounces, BTC gradually started to grow, breaking out of the lower range and forming a new short-term trend. The growth accelerated after the price exited the buyer zone, leading to the development of an upward wedge. Within this pattern, BTC continued climbing and eventually broke through interim resistance levels, reaching new local highs. The current movement shows clean reactions to the support and resistance lines of the wedge, with the price respecting the structure closely. Now, BTC is approaching the resistance level at 88500, which aligns with the upper boundary of the previous range and borders the seller zone. The combination of this resistance and the narrowing wedge formation increases the probability of a bearish reversal. Given this setup, I expect BTC to reverse soon and continue moving down toward the 81200 support level, which remains my current TP1. Please share this idea with your friends and click Boost 🚀
BTC — Bulls in Full Control | Next Stop $87K+?Bitcoin just smashed through the resistance around $84,300, and the bullish momentum is 🔥
Now we’re heading straight into the next key zone at $87,000–$88,765, which lines up perfectly with previous supply.
If bulls keep this pace — a clean push toward 87K looks very real in the coming sessions.
Entry: $84,500 – $85,500
TP: $86,800 – $87,000
SL: $83,500
More thoughts in my profile @93balaclava
Personally I trade on a platform that offers low fees and strong execution. DM me if you're interested.

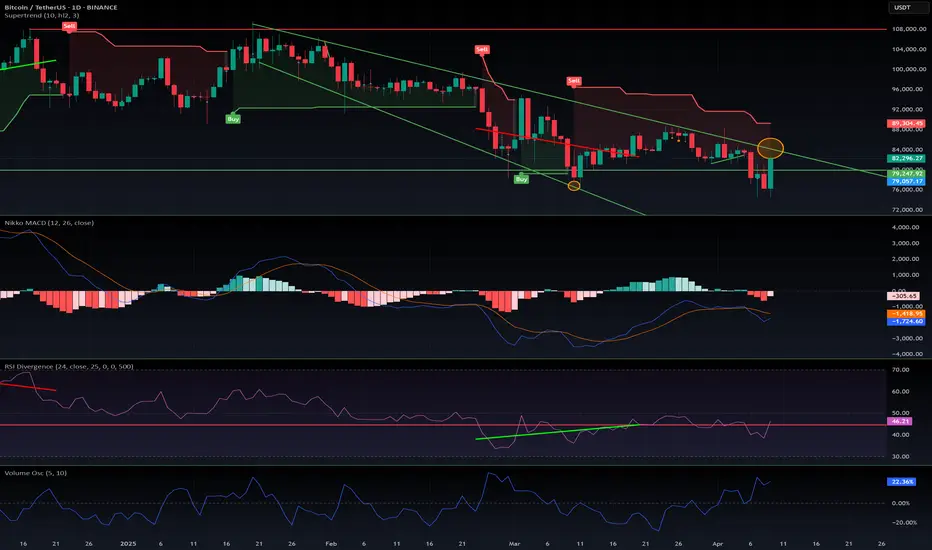
$BTC consequences of the Trump 90 days tariff pauseCan It Last? Is This a Trend Reversal?
Today, #Bitcoin surged over +8%, but surprisingly, #Tesla outperformed with a massive +20%—almost as much as $FARTCOIN! 🤯
History is being written, and we’ll remember this day… but is this truly the end of the consolidation phase?
What to Watch:
📈 Price Action: Bitcoin must break above the descending trendline (in green) and close a daily candle above it to flip resistance into support. The price to watch is $84.5k. Closing under 80k would invalidate this pump.
📊 RSI: Currently in mid-range—could swing either way.
🔁 MACD: Was turning bearish. We need a clear bullish crossover to confirm a trend continuation.
Conclusion:
With all the recent global tensions, many investors are feeling a sense of relief, especially as the trade war appears paused until September. This gives markets some breathing room to recover.
However, it’s not all clear skies yet:
Bitcoin is still stuck inside the descending bearish channel.
The recession risk hasn't gone away.
Trump may have been pressured to offer good news to avoid a full-blown market crash.
🕵️♂️ Let’s see how the weekly candle closes after this sharp move to the upside.
Bitcoin will grow inside upward channel to resistance levelHello traders, I want share with you my opinion about Bitcoin. Previously, the price moved inside a triangle pattern, where it faced pressure from the resistance line while holding above the lower boundary. After the breakout from this formation, BTC began forming an upward channel, signaling a shift toward a bullish structure. Inside the channel, the price reacted multiple times to the support line, especially within the buyer zone between 79600–81000 points. Every touch of this zone triggered a rebound, indicating that buyers consistently protect it. Most recently, BTC bounced again from the 81000 support level, which aligns with the lower channel boundary. This rebound shows that bullish momentum is still present, and the structure remains intact. Now, the price is stabilizing and preparing for another upward move. I expect BTC to continue rising toward the 88500 resistance level, which is both the TP1 and the upper boundary of the current channel. This level also aligns with the lower edge of the seller zone, making it a natural target for the next wave. With the price holding above key support, the confirmed channel structure, and repeated bullish reactions from the lower zone, I remain bullish and anticipate a continued move upward toward 88500 points. Please share this idea with your friends and click Boost 🚀

I'm Bullish, but... BTC / USDHello my friends,
At a minimum we're looking at 30 days inside this wedge before breaking out and testing the $96k range once again. Trust me, Bitcoin must form a bullish structure before doing anything interesting.
It could wick to FWB:73K but I'm thinking the heavy orders around $75k might hold and we range instead of dumping more.
Keep an eye on this wedge.
Trade thirsty, my friends!

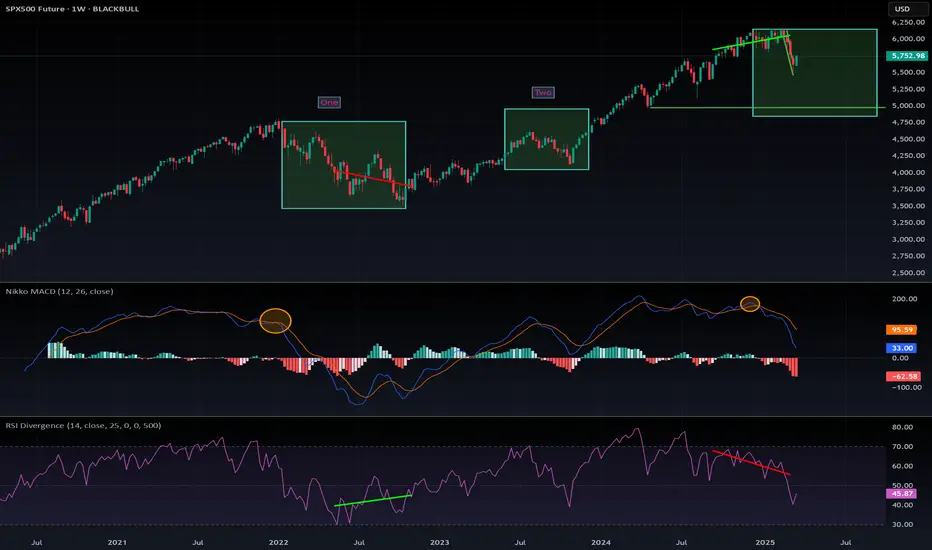
Update about my previous warning about a crash of the SPX500📉 SPX500 Major Correction: Scenario 1 or 2?
In my previous analysis, I explained a scenario that could mimic the 2022 crash (Scenario 1):
🔗
However, the price action dropped much faster than in 2022, accelerating the correction.
Now, on the daily timeframe, we already have a bullish MACD crossover, signaling a potential bullish trend for several days:
🔗
Could This Invalidate the Bearish Trend?
✅ Yes, absolutely.
In June 2023 (Scenario 2), a similar situation occurred:
A bearish MACD reset was interrupted mid-course by a violent dump
This triggered a strong rebound, breaking through resistance levels
There are now strong signs that Scenario 2 might play out again.
What Does This Mean for Crypto & TradFi?
📈 If this bullish reversal holds, it could sync Crypto & TradFi, with both gaining bullish momentum on the weekly timeframe, peaking around May 2025.
Two Possible Outcomes:
1️⃣ Scenario 1 – The reversal collapses, and the correction continues 📉
2️⃣ Scenario 2 – The reversal holds, leading to a rally 📈
Let’s monitor this closely to see which scenario unfolds.
🔍 DYOR!
#SPX500 #StockMarket #Crypto #Trading #BullishReversal #BearishTrend #MACD #MarketAnalysis #Investing
LONG $900BMorning fellas,
I have been getting some spite, and about 75% of people who follow me stopped liking or commenting on my posts just because I've been sold since $100k and calling non-stop for this drop.
The drop came, and the moonfellas out there finally gave in.
Now it's time to look for longs and nothing better than a few select alt coins. I'm thinking $888B to $900B should hold and then we fly. Check trajectory line.
You people need to stop only posting that it's going up to the moon, and be realistic about things. Buy blood not green, buy LINK at $7 and not $25. Buy dot at $2 and not $15, and so on.
Trade thirsty, my friends.

Bitcoin may rebound up from pennant to 90K pointsHello traders, I want share with you my opinion about Bitcoin. Not long ago, BTC was trading inside a wide range, where the price moved sideways and eventually touched the resistance line, from which it turned around and began to fall. After the decline, BTC exited the range, breaking through the lower boundary and sharply dropping to the support level, which aligned with the buyer zone. From there, we saw a quick impulse up, but this movement faced strong resistance inside the seller zone, where a fake breakout occurred — price briefly moved above but then sharply reversed and began another decline. As BTC continued to decline, it formed a downward pennant pattern. Within this structure, we can clearly see how the price respected both the resistance line and the support line of the pennant, bouncing up from the lower boundary several times. The most recent bounce came again from the buyer zone, indicating that bulls are still defending this area. At the moment, BTC is consolidating near the tip of the pennant, and I believe there’s a high probability of an upcoming breakout. My base scenario assumes that we could see one more minor pullback toward the support line, followed by an upward breakout from the pennant. If that happens, the price may reach the 90000 points, which I consider as TP1. Please share this idea with your friends and click Boost 🚀

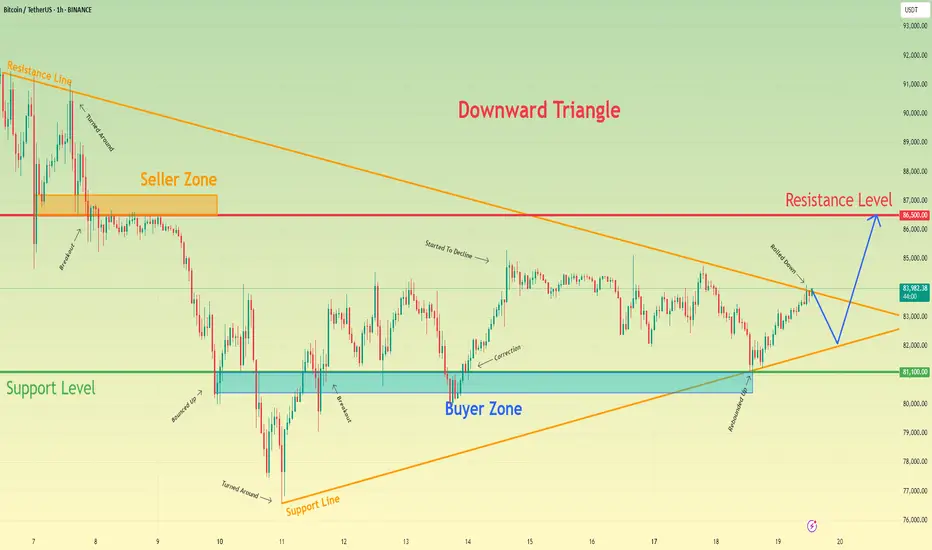
Bitcoin can exit from triangle and rise to resistance levelHello traders, I want share with you my opinion about Bitcoin. On the chart, we can see that the price entered a downward triangle, where it rebounded from the resistance line and dropped to the resistance level. After that, BTC bounced from the 86500 level, climbed back to the resistance line of the triangle, and then started to decline. Soon, it broke through 86,500 and reached the support level, which coincided with the buyer zone. BTC then broke this support and dropped further to the support line of the triangle before reversing and beginning to rise. In a short time, the price reached 81100, broke through it, and made a retest before continuing its upward movement. However, it later corrected back to the buyer zone, then climbed to 85000, and started declining again. Shortly after, the price dropped to the support level and then rebounded to the resistance line of the triangle. Given this price action, I expect BTC to correct toward the support line of the triangle before bouncing back up and breaking out of the pattern. From there, I anticipate further growth toward the 86500 resistance level, which is why I have set my TP at this level. Please share this idea with your friends and click Boost 🚀
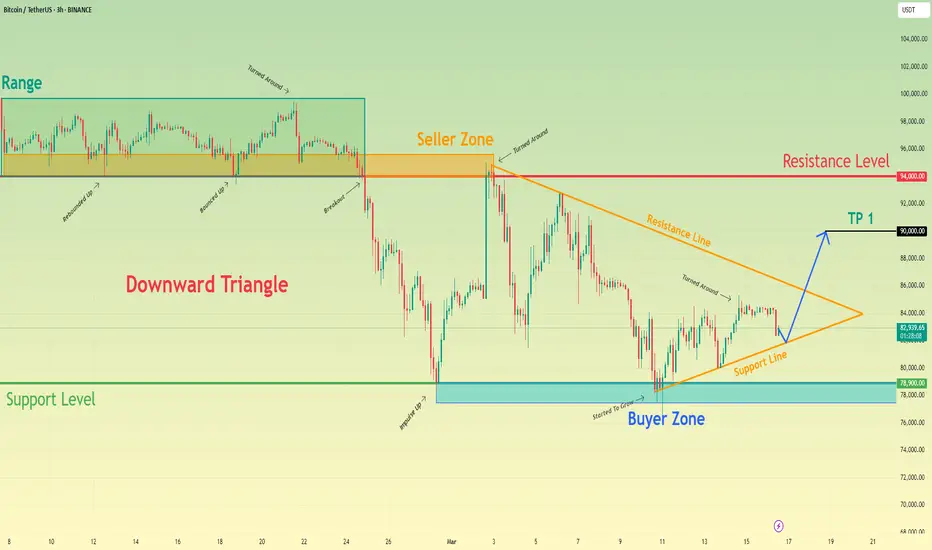
Bitcoin can rebound from triangle pattern to 90K pointsHello traders, I want share with you my opinion about Bitcoin. Not long ago, the price was trading within a range, where it quickly entered the seller zone and remained near this area for quite some time. BTC attempted to rise but failed, and after nearly reaching the upper boundary of the range, it dropped sharply. The price broke through the 94000 level, exiting the range as well, and then fell to the support level, which aligned with the buyer zone. Shortly after, the price made a strong upward impulse toward the resistance level before starting a decline within a downward triangle. Inside this pattern, BTC initially made a correction, climbed back to the resistance line of the triangle, and then resumed its decline. Eventually, the price dropped to the 78900 support level, where it touched the triangle’s support line and then began to rise. At the moment, BTC continues to climb near this level, and I expect it to rebound from the support line of the triangle and break above the resistance, signaling an exit from the pattern. If this happens, I anticipate further growth, so my target is set at 90000 points. Please share this idea with your friends and click Boost 🚀
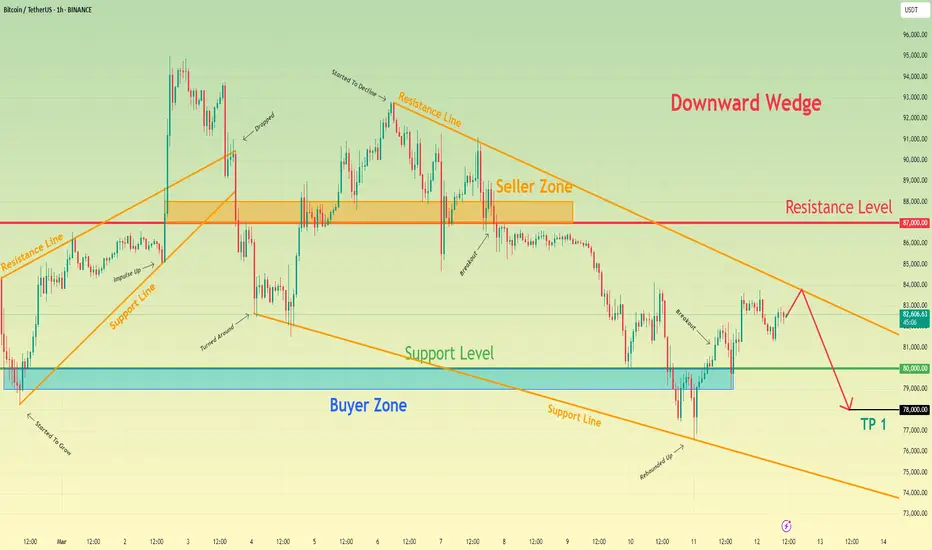
Bitcoin can reach resistance line of wedge and then dropHello traders, I want share with you my opinion about Bitcoin. This chart illustrates how the price dropped into the buyer zone within an ascending wedge. After that, BTC reversed direction and began to rise, eventually reaching the wedge’s resistance line before making a correction to the support line. The price then made a strong upward impulse, breaking through the resistance level and exiting the ascending wedge. BTC surged to 94800 before reversing and dropping to 82600, breaking through the 87000 level. Following this decline, the price started to recover within a descending wedge and soon reached the resistance line, breaking through another resistance level. However, after this move, BTC reversed again and began to decline, eventually falling back to the 87,000 level, which coincided with the seller zone, where it traded for some time. It then broke through this level and continued declining toward the support level, even entering the buyer zone. BTC also dropped to the support line of the descending wedge before rebounding sharply, breaking above the 80000 support level once again. Currently, the price is continuing its upward movement. Given this setup, I anticipate that Bitcoin will reach the resistance line of the wedge before pulling back to the support level, potentially even lower. For this scenario, my TP is set at 78000. Please share this idea with your friends and click Boost 🚀
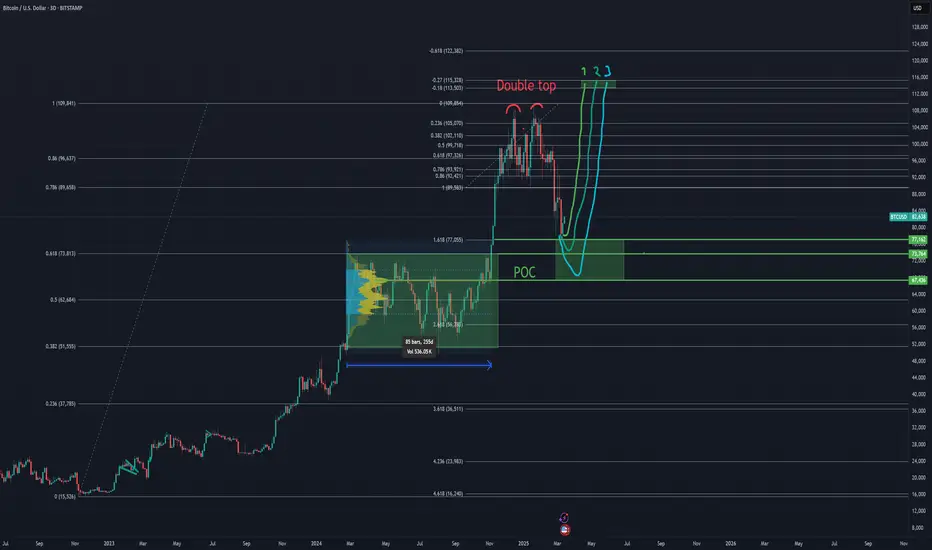
BTC/USDT Reversal scenariosThere is bear mood in market, its exactly what is needed for reversal, lets have a look closer. I see 3 options.
1) Manipulation is over, we reached the target of local FIBO 1.618 at 77055$
2) Level 73764$ - its the target of Double TOP , the edge/high of the last block and 0.618 level of grand FIBO
3) POC level of last accumulation block which lasted for 255d at 67436$ - we could reach this level only with fast squeeze and fast buy back, leaving long needle on higher timeframe
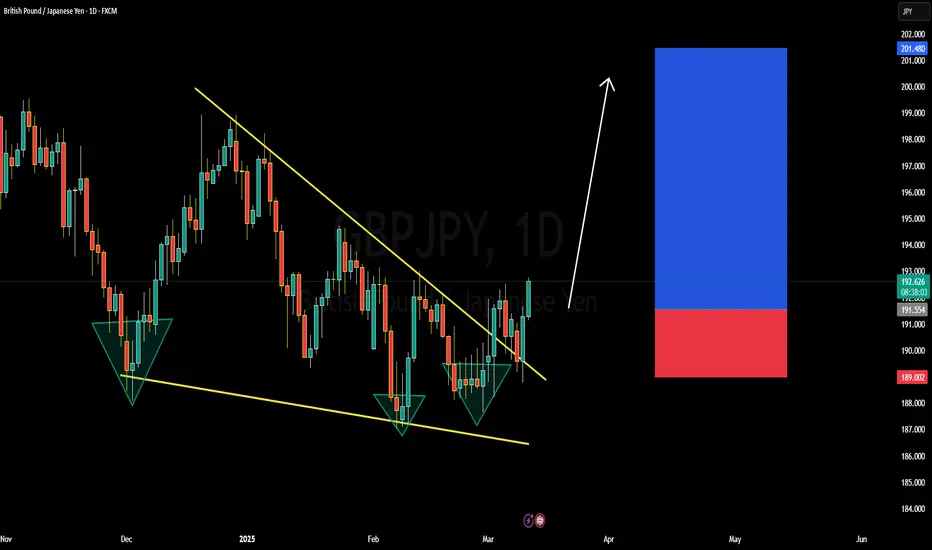
WHY GBPJPY BULLISH, DETAILED ANALYSIS GBPJPY is currently trading at 192.200 after successfully breaking out of a falling wedge pattern, a strong bullish reversal signal. This technical breakout suggests the pair is set for a significant upside move, with a potential target of 195.000 and beyond. The falling wedge is known for its bullish implications, indicating that sellers are losing control while buyers are stepping in with increased demand. If momentum continues, we could see a gain of over 500 pips in the coming sessions.
From a technical perspective, GBPJPY has cleared key resistance levels and is now forming a strong bullish structure. A retest of the breakout zone around 191.500-192.000 has already provided support, reinforcing the likelihood of further upward movement. The next major resistance lies at 194.000, followed by 195.000, which aligns with key Fibonacci retracement levels and previous price action zones. If buyers maintain control, a push towards 196.000 and beyond is also possible.
Fundamentally, GBPJPY remains bullish due to the policy divergence between the Bank of England (BoE) and the Bank of Japan (BoJ). The BoE's firm stance on interest rates, coupled with the BoJ’s continued ultra-loose monetary policy, favors a stronger GBP against the JPY. Additionally, risk sentiment plays a crucial role in GBPJPY's movements, and with equity markets showing strength, the yen's safe-haven appeal weakens, further boosting the bullish case for this pair.
With both technical and fundamental factors aligning, GBPJPY presents a strong buying opportunity. Traders should watch for a sustained move above 193.000 for confirmation of further gains, with the potential to reach 195.000 and beyond. A breakout continuation could trigger even stronger bullish momentum, making this a high-probability setup for traders looking to capitalize on the trend.
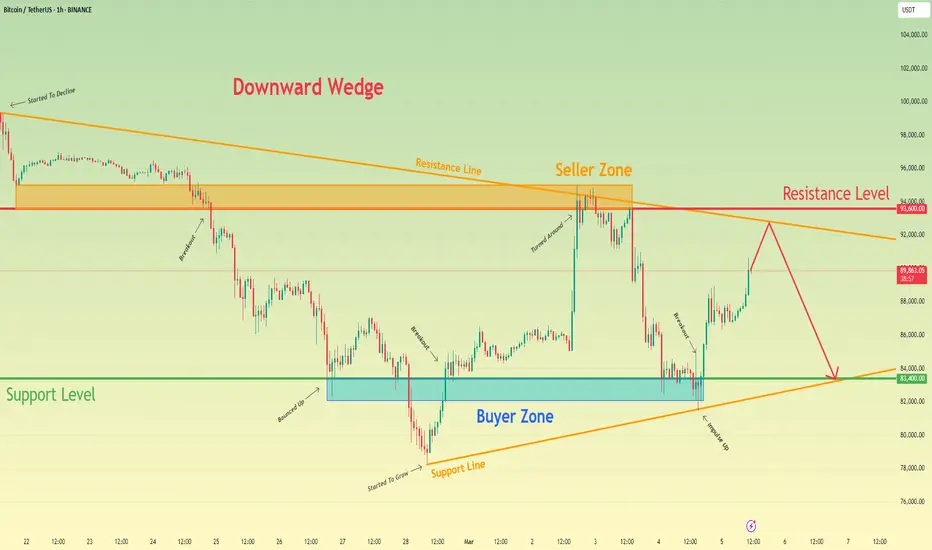
Bitcoin may reach resistance line and then drop to 83400 levelHello traders, I want share with you my opinion about Bitcoin. A few days ago, Bitcoin entered a descending wedge and began to decline within it. Soon after, the price dropped to the seller zone, which aligned with a resistance level, and eventually broke through. Following this move, BTC quickly fell to the 83400 support level, which coincided with the buyer zone, and even dipped below, breaking through the level. After reaching the wedge’s support line, Bitcoin immediately reversed and started moving upward. In a short time, the price reclaimed the 83400 level, performed a retest, and continued its upward movement. Later, BTC climbed to the resistance level and briefly entered the seller zone, where it consolidated near the wedge’s resistance line before dropping back to the buyer zone, breaking through 93600. Within the buyer zone, the price touched the wedge’s support line before making a strong impulse upward, breaking back above 83400. Currently, BTC is still moving higher, and I anticipate that the price will reach the wedge’s resistance line before reversing downward. Based on this scenario, my target is set at the 83400 support level. Please share this idea with your friends and click Boost 🚀
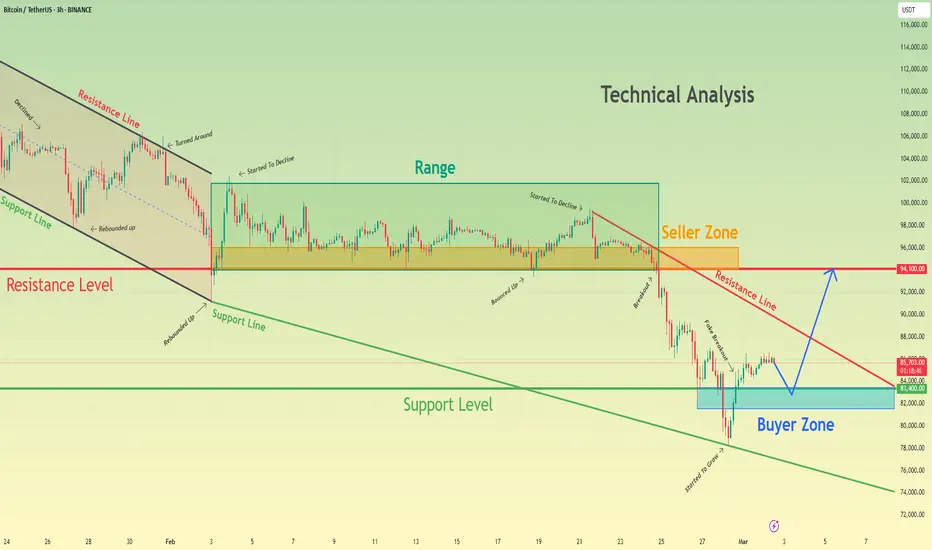
Bitcoin may rebound up from buyer zone to 94100 resistance levelHello traders, I want share with you my opinion about Bitcoin. A few days ago, the price was moving inside a downward channel, where it reached the support line and immediately bounced back up to the channel’s resistance. After that, BTC continued its decline, testing the resistance level, which aligned with the seller zone. The price briefly dipped below this level but quickly reversed and rebounded. Eventually, Bitcoin exited the channel and moved into a range, reaching its upper boundary before turning downward again. In a short period, the price dropped to the seller zone, where it consolidated for some time. BTC then attempted to push higher but failed and resumed its decline. Breaking below the 94100 resistance level, the price moved further down, fluctuating between support and resistance lines. Bitcoin eventually fell to the support line, breaking through the 83400 support level, which aligned with the buyer zone. However, this breakdown turned out to be a false move, as BTC immediately rebounded and surged back above that level. Currently, BTC is continuing its upward movement. I anticipate that the price may first test the buyer zone before resuming its growth. Additionally, if it manages to break through the resistance line, it could keep climbing higher. With this in mind, my TP is set at the 94100 resistance level. Please share this idea with your friends and click Boost 🚀
Bitcoin can break support level and continue to fall in channelHello traders, I want share with you my opinion about Bitcoin. Looking at the chart, we can see that the price moved into a range, where it initially surged to the seller zone, touching the upper boundary. After that, it quickly reversed and dropped to the lower part of the range, which aligned with the 93900 level, before bouncing back up. The price made another attempt to reach the seller zone, but this time it broke out of the range and started declining within a downward channel. Inside the channel, BTC initially touched the support line but struggled to gain momentum and continued to fall. Not long after, the price broke through the 93900 level, retested it, and then dropped further to the support level, which overlapped with the buyer zone. It even briefly broke this level, reaching the channel’s support line before making a sharp recovery. Following this bounce, BTC quickly reclaimed the broken support level and is currently trading near the 88100 mark. In my view, Bitcoin could rise to test the channel’s resistance line before resuming its downtrend and breaking the support level again. Based on this, I’ve set my TP at 85000 points. Please share this idea with your friends and click Boost 🚀
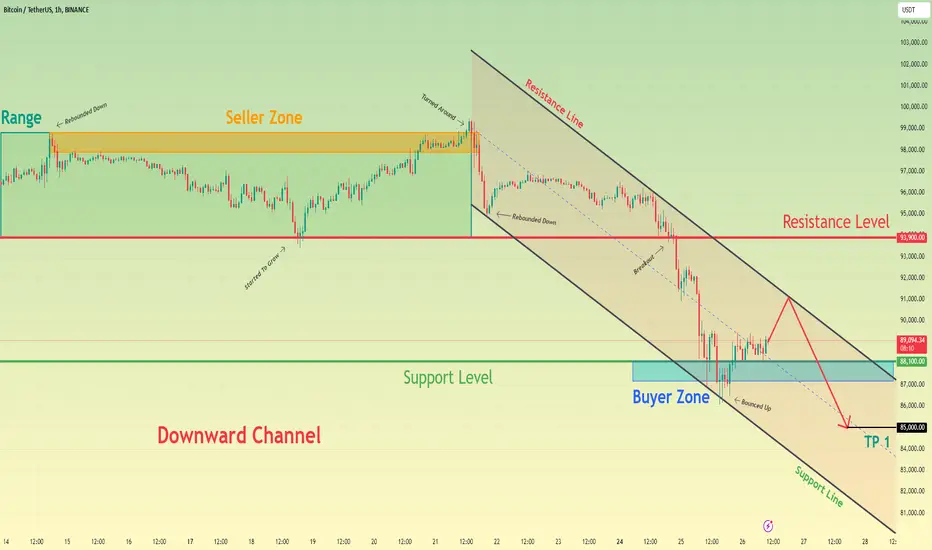
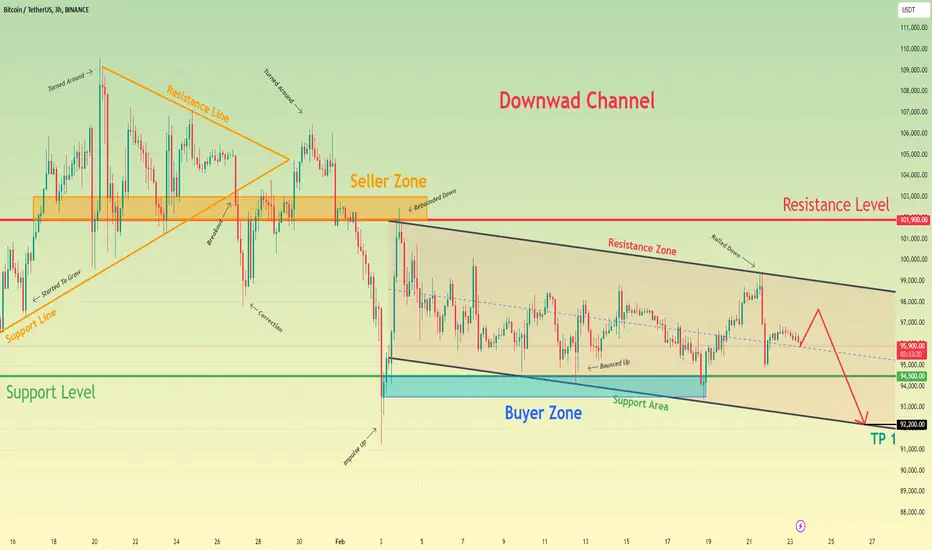
Bitcoin can continue to decline inside downward channelHello traders, I want share with you my opinion about Bitcoin. A short while ago, the price started to rise within a pennant and soon reached the resistance level, aligning with the seller's zone. After breaking this level, BTC continued upward, testing the resistance line of the pennant before reversing and beginning a decline. Not long after, Bitcoin dropped, breaking out of the pennant to the downside and even dipping below the 101900 level before quickly recovering. The price then climbed to 106500 points but soon pulled back to the buyer's zone and dropped even lower, breaking through the resistance level once again. Following this move, BTC reversed direction, made a strong impulse up to the resistance level, and then started declining within a downward channel. Inside this channel, the price fell to the buyer's zone and attempted to bounce but failed, rapidly returning to the buyer’s zone, which coincided with the support level. After that, it rebounded, reached the resistance line of the channel, and then corrected downward. At the moment, Bitcoin is still declining inside the channel. I expect a slight rebound before further downside movement toward the support line of the channel, breaking the support level. In this scenario, my target is set at 92200 points, which aligns with this line. Please share this idea with your friends and click Boost 🚀
Bitcoin can leave triangle and reach 100K pointsHello traders, I want share with you my opinion about Bitcoin. Analyzing this chart, we can see that a few days ago, the price dropped below the resistance level, which aligned with the seller zone, breaking through it. After that, BTC began to rise near the support line and soon broke through the 102500 level again, climbing even higher than the seller zone. Following this move, BTC reversed and started declining within a descending triangle, eventually breaking the 102500 level once more and dropping into the buyer zone. Afterward, the price made a strong upward impulse toward the resistance level but soon began to pull back. Not long after, the price fell to the support level, bounced from the 94,000 mark, and climbed back to the resistance line of the triangle. Shortly after, BTC once again dropped to the support line before starting to rise again. Currently, it is trading very close to the resistance line of the triangle. In my view, BTCUSDT is likely to reach 100K points, leading to a breakout from the triangle. Please share this idea with your friends and click Boost 🚀

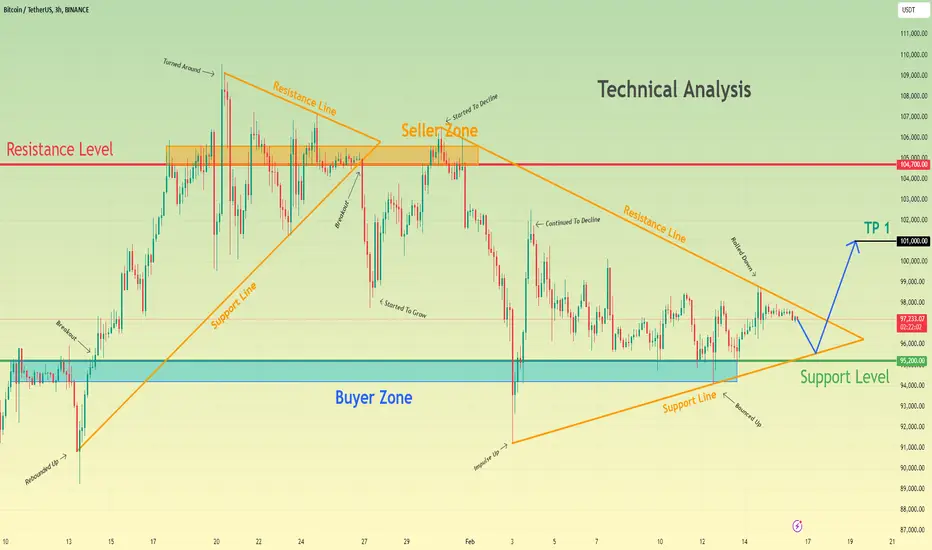
Bitcoin can exit from triangle and then rise to 101K pointsHello traders, I want share with you my opinion about Bitcoin. Not long ago, the price reached a support level aligned with the buyer zone. It consolidated there for a while before climbing into a pennant formation. Inside the pennant, the price broke through the 95200 level and continued its rise toward the resistance level, which overlapped with the seller zone, eventually breaking through this area as well. Following that, the price advanced to the resistance line of the pennant but soon reversed direction, sharply dropping to the support line. It broke through this support, signaling an exit from the pennant pattern and surpassing the 104700 resistance level. After a minor decline, the price rebounded quickly, reaching the seller zone once more, before turning lower and forming a triangle pattern. Bitcoin slid down to the triangle's support line, then reversed and bounced upward, breaking the support level again in the process. This led to further declines, with the price eventually hitting the buyer zone. From there, it rebounded back toward the triangle’s resistance line. Currently, the price is trading close to this resistance line. In my view, Bitcoin can drop back to the support line before rebounding higher, potentially climbing to 101K points and breaking out of the triangle formation. Please share this idea with your friends and click Boost 🚀
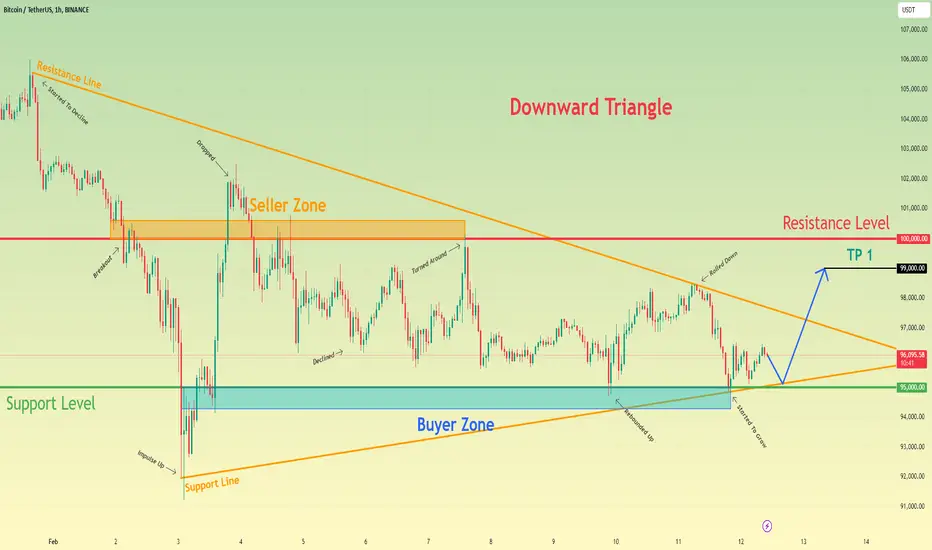
Bitcoin will continue to grow and exit from triangle patternHello traders, I want share with you my opinion about Bitcoin. By observing the chart, we can see that the price entered a downward triangle, where it at once rebounded from the resistance line and started to decline. In a short time, the price fell to the resistance level, which coincided with the seller zone, broke this level, and dropped until to support line of the triangle, breaking the support level too. Next, BTC turned around and made a strong impulse up, breaking 95000 and 100000 levels, after which it turned around and started to decline. Price later fell below the 100K level, breaking it, and continued to fall next. Later BTC rose to the 100K resistance level, but at once turned around and dropped to the support level, which coincided with the buyer zone. After this, the price rebounded from the buyer zone and reached the resistance line of the triangle, and then corrected back. Then Bitcoin started to grow, so, I think that the price can correct to the support line and then rise to the resistance line and break it, thereby exiting from the triangle pattern. Then BTC will continue to grow, therefore I set my TP at 99K points. Please share this idea with your friends and click Boost 🚀
Bitcoin may drop to support line before reboundingHello traders, I want share with you my opinion about Bitcoin. We can observe how the price entered a range when analyzing the chart. It initially dropped to the support level, aligning with the buyer zone at the lower boundary of the range. After spending some time trading near this level, the price dipped further into the buyer zone but quickly rebounded, rising to the upper boundary of the range. Following this, the price reversed and fell back into the buyer zone, where it consolidated for a while before climbing back into the range. Shortly afterward, Bitcoin rallied to the resistance level, corresponding to the seller zone, breaking out of the range and eventually surpassing the 104600 level to reach a new all-time high (109000 points). However, BTC then began to decline within a downward channel, where it broke below the 104600 level again and dropped to the channel’s support line. Although the price attempted to recover, it failed and rebounded from the seller zone back to the buyer zone. Subsequently, the price moved back into the channel, creating a false breakout, and continued its downward movement within the channel. Given the current structure, I anticipate that BTC might drop to the channel's support line before initiating a new upward movement. Based on this outlook, I’ve set my target price (TP) at 101300 points. Please share this idea with your friends and click Boost 🚀
