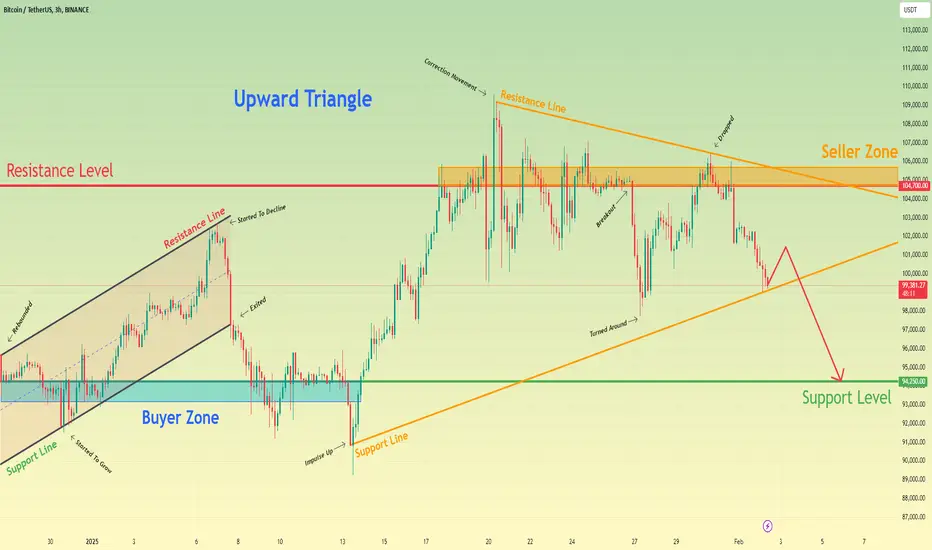
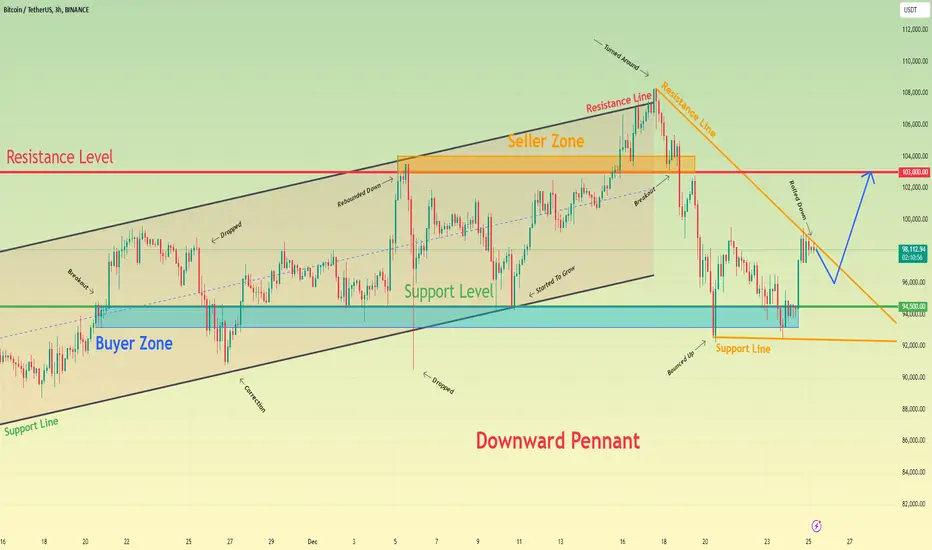
Bitcoin can exit from triangle and continue to fall nextHello traders, I want share with you my opinion about Bitcoin. By observing the chart, we can see that the price started to grow inside the upward channel, where it at once rebounded from the resistance line of the channel and fell to the support line. Then BTC broke the support level and rose in a short time to the resistance line of the channel and then it started to decline. Bitcoin fell to the support level, which coincided with the buyer zone, thereby exiting from the channel and after it some time traded between 94250 level, it fell to 90850 points. Next, the price impulsed and continued to grow inside the upward triangle, breaking the support level again. Later it reached the even resistance level, which coincided with the seller zone. Soon, BTC broke the 104700 level, rose to the resistance line, and then fell back and continued to trades between the 104700 level. Later BTC broke this level and fell below, after which turned around and quickly rose to the resistance line of the triangle and then dropped to the support line, where at the moment continues to trades close. So, in my mind, I think that Bitcoin can move up and then exit from the triangle and continue to decline to the 94250 support level. For this case, I set my TP at this level. Please share this idea with your friends and click Boost 🚀
Btc-usdt
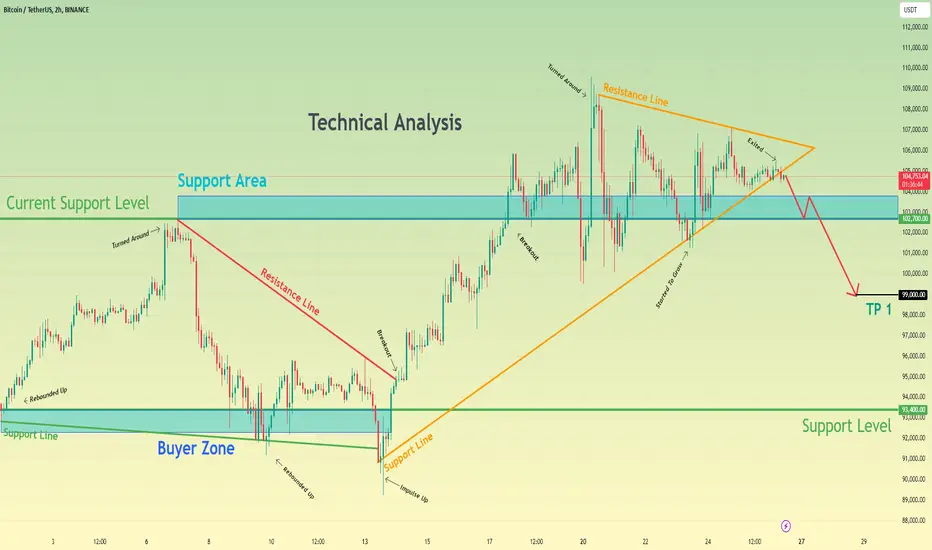
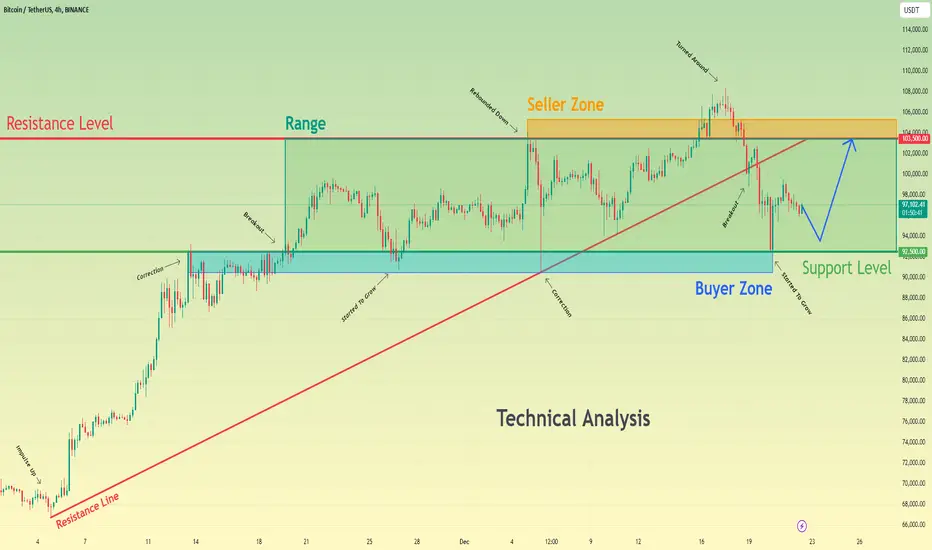
Bitcoin will break support level and continue to declineHello traders, I want share with you my opinion about Bitcoin. By observing the chart, we can see that the price a few moments ago rebounded from the support line, which coincided with the support level with the buyer zone and rose to the resistance line. After this, BTC rebounded from this line and dropped back to the support line, breaking the 93400 level, and soon rebounded up, breaking this level one more time. Later BTC rose to the resistance line and then fell to 90850 points, after which made a strong impulse up, breaking the 93400 level with the resistance line too. Then price continued to move up inside Pennant, where it broke the 102700 current support level, made a retest, and then tried to grow more, but failed and made correction below the 102700 level. After this movement, BTC turned back and rose to 109600 points (new ATH) and then made a correction movement one more time. Price fell to the support line of the pennant and then in a short time rose to the resistance line and recently it fell and exited from the pennant. In my opinion, the price can fall to the current support level, break it, and then continue to decline, therefore I set my TP at 99K points. Please share this idea with your friends and click Boost 🚀
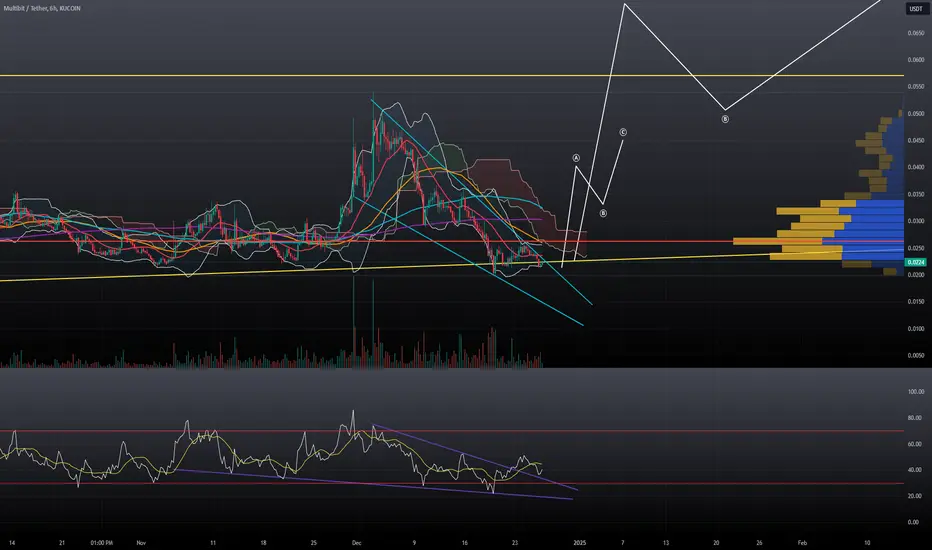
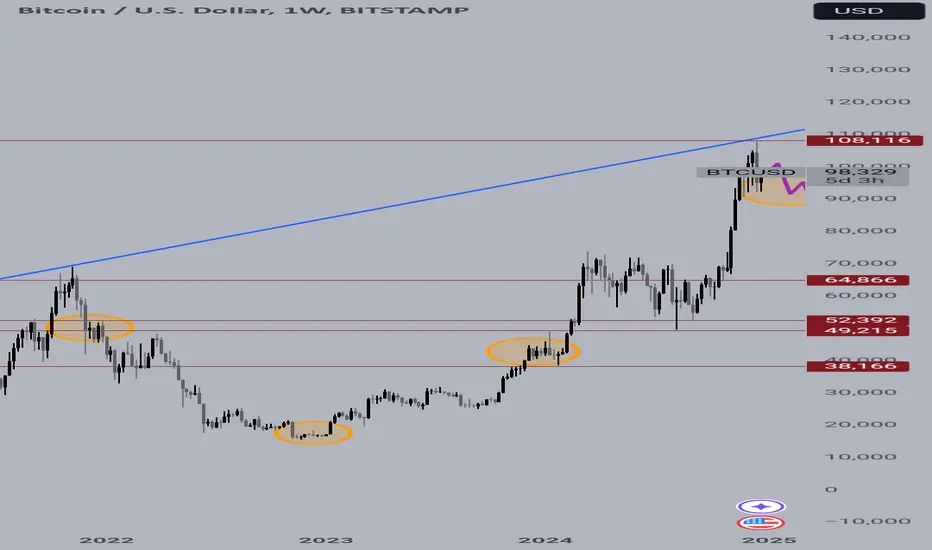
Key to upcoming price action pathHere are 2024 September - November USDt rally metrics:
66 days, 4.6 Trillions volume.
The first sub wave of micro degree is 1.39 points or 20.85% length.
The third sub wave of micro degree is 2.32 points or 35.7%. Which led to +89% at BTC, from 52k to 99k.
The triangle in fourth position has 0.75 points - 16.77% min basement or 0.97 - 20.69% max height. Triangles usually precede the last wave in the direction of the main trend. The terminal point for this triangle may reach 3.15% dominance and last in approximately the next 80 days.
The dominance of USDt on RSI 2D TF signals a downward divergence.
I think the signal line could reach ~22% before meeting the support trend line and reversing. It is -18% from the current point.
These values coincide with trend lines on Bitcoin, about 155k, or +55% from the current point.
Dodgecoin in percentage terms does move about 2x further.
This is a third confirmation proving upcoming rise in all crypto assets.
keep in mind that there is always place for an alternative waves count, but i bet that the analysis results worth millions!
So, wish you safe trading, fat profits and see you again :)

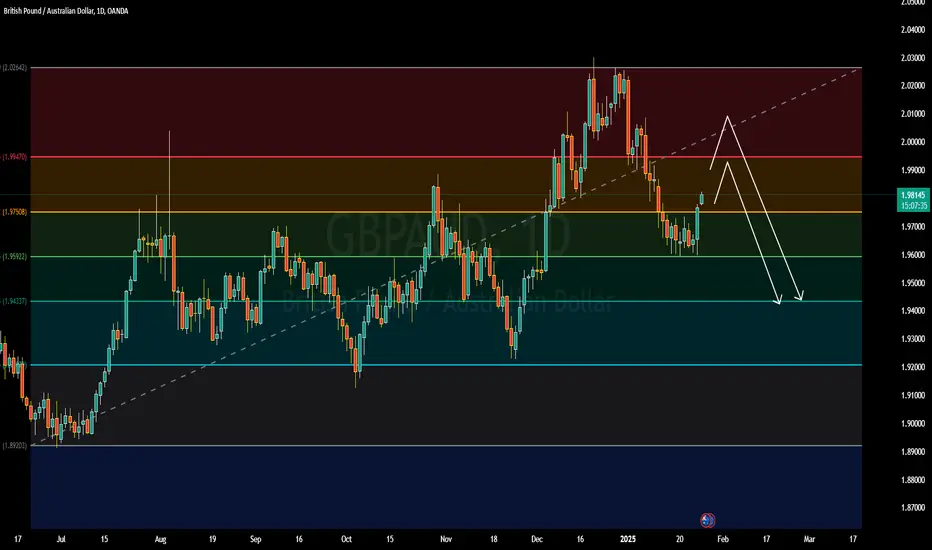
GBPAUD Retesting Resistance with a Potential for Price ReversalGBPAUD is currently trading at 1.981, with a target price set at 2.000, indicating a potential gain of over 200 pips. The market analysis is based on the support and resistance pattern, which suggests key price levels where the pair may react. Currently, the pair is in a retesting phase, meaning it is testing the resistance level after a previous breakout or price movement. This retesting phase helps confirm whether the resistance holds or breaks. If the resistance holds, it signals a potential reversal, leading to a price drop. Traders are advised to closely monitor this retesting period for confirmation before taking positions. A rejection at the resistance level could trigger a bearish move. Patience during this period is critical to avoid premature entries. This setup reflects a potential opportunity for experienced traders following technical analysis strategies.
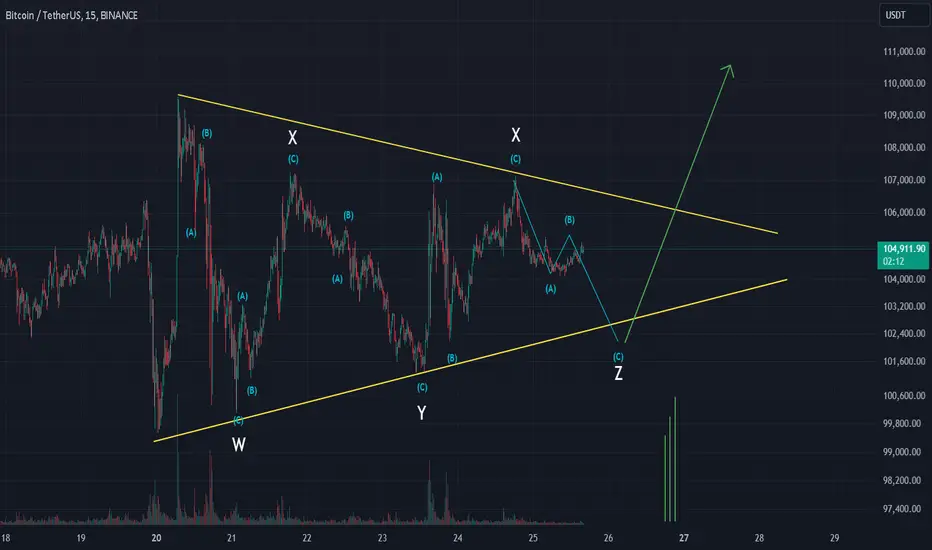
BTC - Steady... steady... almost there!BTC in the short term is looking very much like a WXYXZ is forming. We should therefore see a low, which could temporarily breach the lower trend line. In fact, it'd make for a bullish signal if it did - so watch this carefully. If we see it ping back within the channel, then the formation will likely complete. Next thing we'll need to look for us the breakthrough of the upper trend line. This would then lead to higher higher and the completion of wave 5 of 1 which we have long been looking for. I'm not going to take any actions here until either trend line is decisively broken leading to a trend change. Looks good though, follow for more.
Bitcoin can turn back to the seller zone from the support lineHello traders, I want share with you my opinion about Bitcoin. By observing the chart, we can see that the price some days ago reached a resistance level, which coincided with the seller zone, and then dropped to the support level, which coincided with the buyer zone, and then started to trades in the range. In range, BTC at once rebounded from the support level and tried to grow, but failed and fell back. After this, the price bounced up and then turned around and declined to the buyer zone, after which started to grow. A short time later, Bitcoin rose to the top part of the range and then dropped to the buyer zone back, making a fake breakout of the support level, and then turning back to the range. Price sometimes traded near the 93200 level and later broke it, exiting from the range also and falling to 90800 points. Then BTC made a strong impulse up from this point and rose to almost resistance level, which coincided with the seller zone, after which corrected to the support line. Then BTC rebounded up from this line and rose to the seller zone, reaching a new ATH (109K), and soon fell back to the support line. But recently price bounced from this line and started to grow. So, for this case, I think that BTC can fall to the support line and then rebound up to the seller zone, breaking the resistance level. That's why I set my TP at 109500 points. Please share this idea with your friends and click Boost 🚀

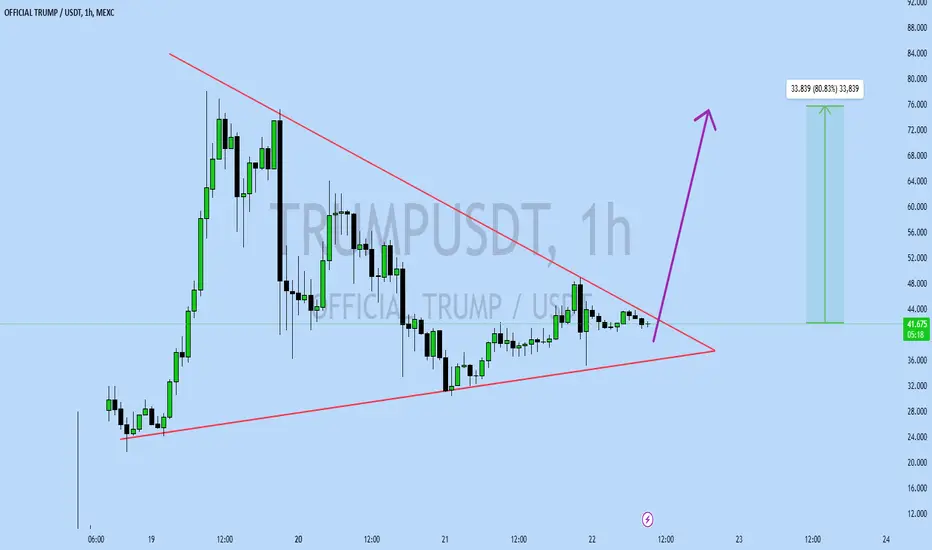
TRUMP With Big buying OpportunityThe TRUMPUSDT coin is currently trading at $41, with a target price of $100, indicating a potential gain of over 250%. The coin is forming a Bullish Pennant pattern, which suggests a potential breakout. This pattern is typically seen as a continuation pattern, indicating that the coin's price may continue to rise after the breakout. The Bullish Pennant pattern is characterized by a series of higher lows and lower highs, forming a triangular shape. A breakout above the upper trend line of the pennant could confirm the bullish trend. However, it's essential to exercise caution and consider other technical and fundamental factors before making any investment decisions.
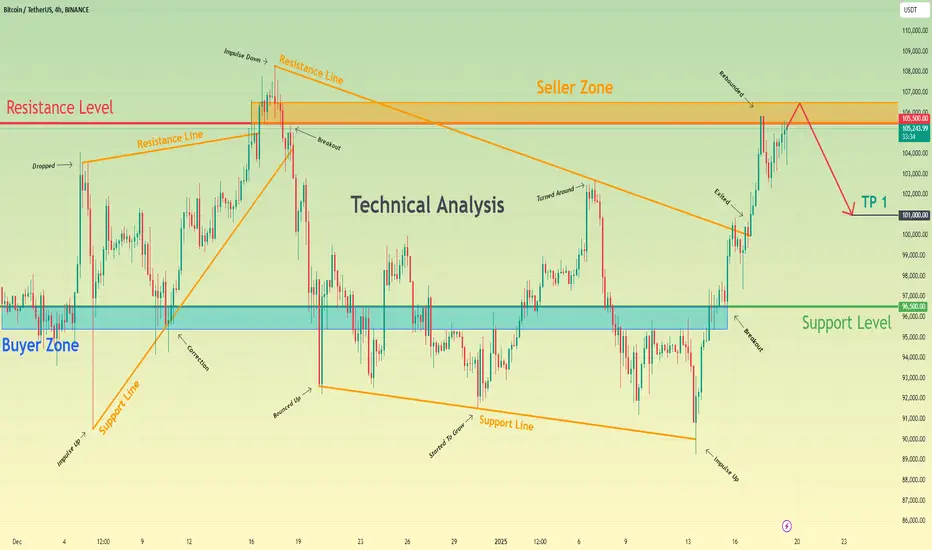
Bitcoin can enter to seller zone and then start to declineHello traders, I want share with you my opinion about Bitcoin. Observing the chart, we can see how the price some time traded near the support level, which coincided with the buyer zone and then rebounded up, after which it started to trades inside the pennant. In pennant, price at once rebounded from the resistance line and dropped to the support line, but soon BTC turned around and made impulse up. Price rose back, after which made a correction to the buyer zone and then continued to grow. Later, BTC reached the resistance line of the pennant, breaking it, exiting from the pennant pattern, and soon breaking the resistance level, which coincided with the seller zone. Next, the price reached new ATH (108K) and then made impulse down inside the wedge, to support line, breaking the 96500 level. But soon, the price turned around and bounced up, so, after this BTC some time traded between support level until it later dropped to the support line of the wedge again and then started to grow. Bitcoin rose to the resistance line of the wedge, breaking the 96500 level, and then corrected the support line of the wedge, where it made a strong impulse up to the resistance level, thereby exiting from the wedge pattern. Now, I think that price can enter to seller zone and then start to decline. For this case, I set my TP at 101K points. Please share this idea with your friends and click Boost 🚀
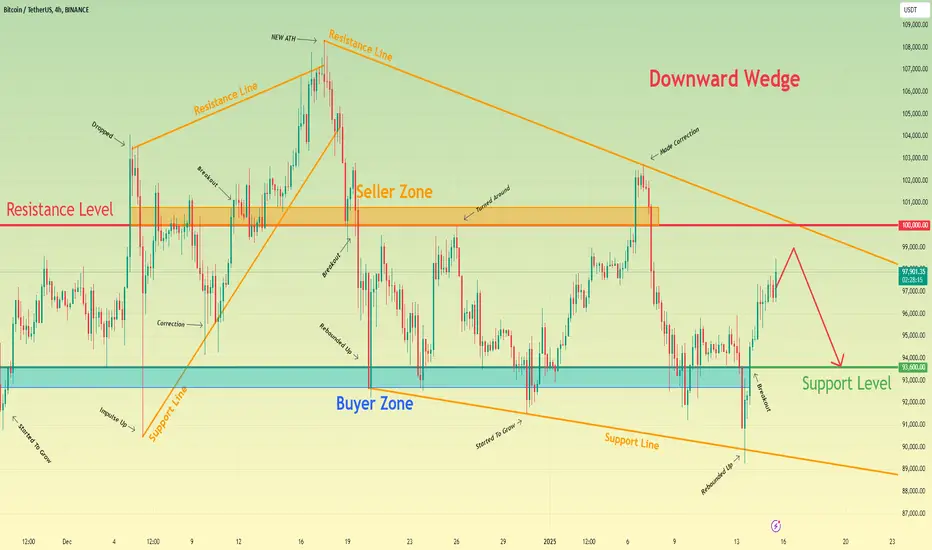
Bitcoin can make movement up and then drop to 93600 levelHello traders, I want share with you my opinion about Bitcoin. The chart shows how the price rose to the support level, which coincided with the buyer zone, broke it, and continued to move up. Later BTC corrected to the support level, after which rebounded up to 103500 points, after which it dropped to the 90400 level, thereby starting to trades inside the pennant. Also then, the price turned around and made an impulse up from the support line of the pennant and rose to the resistance level, which coincided with the seller zone, after which corrected the support line. Then BTC rebounded and in a short time rose to the resistance level again and this time it broke it and continued to move up to the resistance line of the pennant. When the price reached this line it exited from the pennant and reached new ATH (108K points) and then made a downward impulse inside the downward wedge. Price broke 100000 with 93600 levels and fell to the buyer zone, where it reached the support line of the wedge and rebounded from it to the resistance level. Later Bitcoin corrected the support line again and then in a short time rose to the resistance line of the wedge pattern, after which dropped back. Recently price bounced from this line, broke the 93600 level, and now continues to grow. For this case, I expect that the price can make one more move up and then correct the 93600 support level. That's why I set my TP at this level. Please share this idea with your friends and click Boost 🚀
Bitcoin can exit from pennant and rise to 97300 resistance levelHello traders, I want share with you my opinion about Bitcoin. Looking at the chart, we can see how the price some days ago started to trade inside the upward channel, where it at once rebounded from the buyer zone and rose a little. After this, it corrected to the support level and then in a short time rose to the resistance level, which coincided with the seller zone, but when it reached this level, BTC at once made a small correction. Next, the price finally broke this level and rose to the channel's resistance line, after which it made a correction and some time traded inside the seller zone. Later, the price made an upward impulse, exiting from the upward channel and when it reached 102K points, BTC turned around and started to decline inside the downward pennant. In this pattern, the price dropped to the support line of the pennant, breaking the 97300 and 93300 levels, after which it started to grow. Recently, Bitcoin reached the resistance line of the pennant pattern, breaking the 93300 level. So, given the current market conditions, I expect that BTC can exit from the pennant and then make a correction to the support level. After this movement, the price can start to move up to the 97300 resistance level. For this case, I set my TP at this level. Please share this idea with your friends and click Boost 🚀

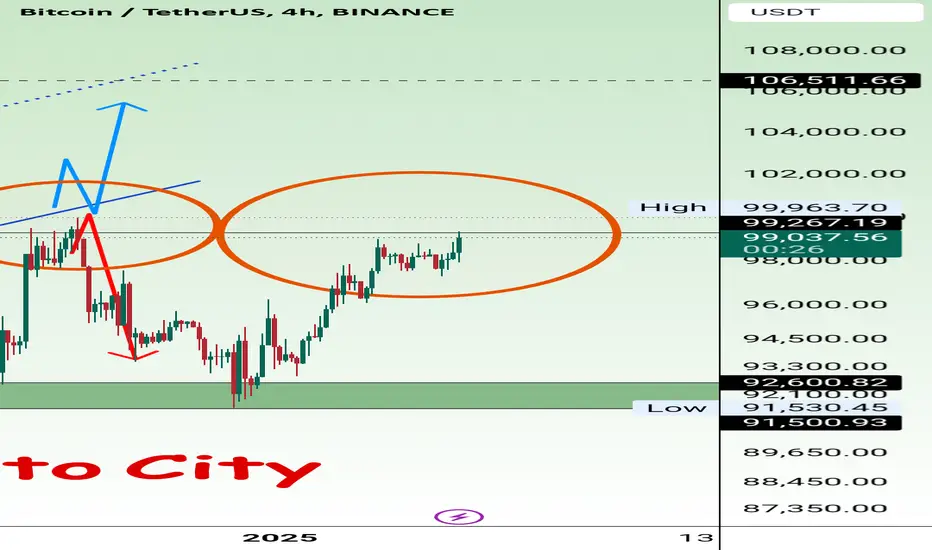
Bitcoin can exit from pennant and then start to growHello traders, I want share with you my opinion about Bitcoin. Looking at the chart, we can see how the price a few moments ago broke the resistance level, which coincided with the seller zone and continued to move up next. Price rose to 108300 points (New ATH) and then started to decline in a triangle. In a short time, BTC fell to the 101800 level, broke it again, and then made a retest, after which continued to move down. Later, the price fell to the support level, which coincided with the buyer zone, and then bounced up, but soon turned around and declined back to the 93400 level. Then BTC turned around and rose to the resistance line of the triangle and then started to fall to the buyer zone. After it reached this area, the price some time traded inside and then rebounded up, thereby exiting from the triangle and continuing to grow in the pennant. In a pennant pattern, Bitcoin rose to the seller zone, after which it turned around and dropped to support line of this pattern. Recently it rebounded and now I expect that BTC can fall a little more, even exit from pennant, and then turn around and start to grow. For this case, I set my TP at 99000 points. Please share this idea with your friends and click Boost 🚀

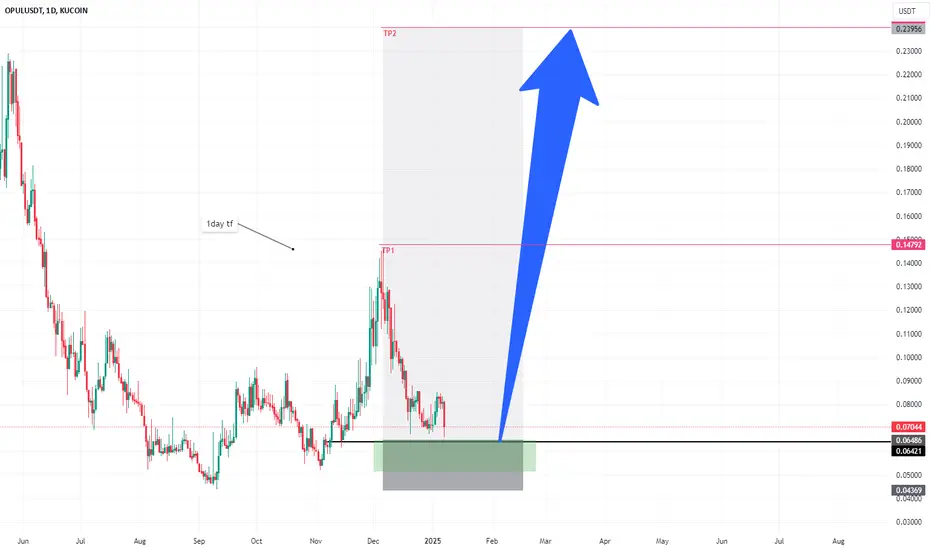
Opulous ($OPULUSDT): Awaiting Entry for 100% + Upside in MusicFiI spend time researching and finding the best entries and setups, so make sure to boost and follow for more.
**Opulous ( KUCOIN:OPULUSDT ): Awaiting Entry for Promising Upside in MusicFi**
Trade Setup:
- Entry Price: $0.06486 (Pending Activation)
- Stop-Loss: $0.04369
- **Take-Profit Targets:**
- **TP1:** $0.14686
- **TP2:** $0.24000
**Current Price:** $0.07048
Fundamental Analysis:
Opulous ( KUCOIN:OPULUSDT ) is leading the way in MusicFi by merging decentralized finance (DeFi) with the music industry. Through its platform, artists can mint music as NFTs, allowing fans to directly invest in their music and share in royalty streams. This revolutionary approach is disrupting traditional music rights management and has garnered significant attention from artists and investors alike.
Recent developments, such as new artist partnerships and an increase in platform adoption, underscore Opulous’s potential to drive innovation in the blockchain space.
Tokenomics Overview:
- **Total Supply:** 500 million tokens.
- **Utility:** Facilitates music NFT transactions, staking, and royalty payments.
- **Growth:** Rapid adoption within the MusicFi niche, attracting both artists and investors.
Technical Analysis (4-Hour Timeframe):
- Support Levels: $0.06500 is a strong support zone near the anticipated entry price, aligning with previous price consolidation levels.
- Resistance Levels: $0.07500 is the first key resistance, with further resistance at TP1 ($0.14686).
- Moving Averages:
- 20-EMA: $0.07000
- 50-EMA: $0.06700
- Relative Strength Index (RSI): Currently at 57, signaling neutral momentum, providing room for further upside.
Market Sentiment:
Interest in MusicFi continues to grow, with Opulous at the forefront of this trend. The unique proposition of allowing fans to invest in music royalties via NFTs is driving increased market interest. Community engagement remains strong, reflecting confidence in the project’s long-term potential.
Risk Management:
The stop-loss at $0.04369 provides protection against significant downside risk, while the take-profit targets offer excellent upside potential. TP1 represents a **126% return**, and TP2 offers a potential **270% gain**, making this trade highly attractive for mid- to long-term investors.
Key Takeaways:
- Opulous is uniquely positioned to capitalize on the growing MusicFi trend, blending blockchain with real-world applications in the music industry.
- Awaiting a pullback to $0.06486 for an optimal entry point into this promising setup.
- The trade offers a compelling risk-to-reward ratio, ideal for swing traders and long-term holders.
When the Market’s Call, We Stand Tall. Bull or Bear, We’ll Brave It All!
Bitcoin is on critical level be careful Bitcoin is currently testing a critical resistance level, which is a price point where it often encounters significant selling pressure. This level acts as a barrier, and if the price successfully breaks above it, it could signal strong bullish momentum in the market. Such a breakout would likely attract more buyers, leading to notable upward price movements. On the other hand, if the resistance holds, Bitcoin might face a pullback or consolidation. Therefore, it’s essential to monitor the price action closely at this level, as it could indicate the next significant move in Bitcoin's trend.
Bitcoin can exit from pennant and then start to grow to 103KHello traders, I want share with you my opinion about Bitcoin. Looking at the chart, we can see how the price started to trades inside the pennant, where it rebounded from the support line and rose almost to the support level, which coincided with the buyer zone. In the pennant pattern, BTC started to grow inside the upward channel, where it broke the 92600 level and then rose to the channel's resistance line, after which made a correction. Next, the price continued to grow and later rose to the resistance level, which coincided with the seller zone and then made a correction movement to the buyer zone. After this, the price continued to move up inside the channel, where it soon reached the 103000 resistance level and broke it. Next, BTC reached the channel's resistance line, which coincided with the resistance line of the pennant, and made a strong impulse down to the support line of the pennant, exiting from the channel and breaking the resistance level. After this movement, the price turned around and started to grow near the support line of the pennant and now I think that BTC can exit from the pennant and fall to the support level. Then it will turn around and start to grow to a 103000 resistance level, which is my TP. Please share this idea with your friends and click Boost 🚀

MUBI Looking for Reversal Here!MUBI is approaching the falling wedge, and with the RSI showing potential to sustain its momentum, I anticipate the chart to follow this trajectory. If it doesn't play out as expected, I'll reassess and update accordingly. Wishing everyone the best of luck this altseason!
Bitcoin can leave pennant and then rise to resistance levelHello traders, I want share with you my opinion about Bitcoin. Looking at the chart, we can see how the price entered to upward channel, where it soon reached the 94500 support level and then broke it. Next, the price made a retest and then tried to grow more, but later turned around and made a correction below a support level, after which in a short time, it backed up. Then BTC some time traded near the support level and later rose to the seller zone, where it at once turned around and rebounded down until to 90500 points. But soon, BTC backed up to the channel and then started to grow to a 103000 resistance level. When it reached this level, the price broke it and soon reached the resistance line of the channel, then it exited and rose to 108300 points, after which turned around and made a downward impulse inside the downward pennant. In this pattern, the price broke 103000 with 94500 levels and reached the support line of the pennant, which is located inside the buyer zone. Then price bounced up from this area and a not long time ago fell back and then rose to the resistance line of the pennant. Now, the price continues to trades near this line and I expect that the price can little decline below the resistance line. Then it started to grow to 103000 resistance level, thereby exiting from the pennant. For this case, I set my TP at this level. Please share this idea with your friends and click Boost 🚀
BTC / USDT Update During Christmas Days```During the Christmas holidays, minor corrections occur due to low volume```
A major correction has already occurred from 108K, as predicted. Now, hopefully, one more correction will happen during the Christmas holidays. However, the trading volume during Christmas 🎄🎁 will likely be low. Gradually,is expected to move upward 📈, breaking 108K, creating support at 105K, and then heading toward its next and final leg up to 123.5K, 143.5K, and 163.5K.
After that, the bear market will hopefully begin, likely around March/April, with a maximum extension until May at the latest.
I will update you before the market peaks, the bear market starts, or the time comes to exit the market based on my system.
GALA: Channel Breakout to Golden Zone - 40% Upside TargetHere's a professional TradingView analysis for GALA/USDT:
Technical Analysis:
Key Levels:
🎯 Entry: 0.035 USDT
🎯 Target (TP): 0.050 USDT (+40%)
📊 Current Price: 0.035 USDT
📈 Volume: 90.38M
Pattern Structure:
• Trading within descending channel
• Double resistance confluence at target zone
• Channel breakout setup forming
Trade Setup:
1. Entry Setup:
- Entry at 0.0356
- Clear channel breakout formation
- Volume accumulation phase
2. Target Analysis:
- Primary target: 0.05
- Confluence with major resistance
- Potential 40% return from entry
3. Key Technical Factors:
- Descending channel boundaries clearly defined
- Wave pattern projecting upward movement
- Multiple timeframe confluence (4H chart)
Risk Management:
• Set stops below recent lows
• Risk:Reward ratio approximately 1:4
• Consider scaling in at entry zone
Timeframe:
• Chart: 4H BINANCE
• Target Timeline: Early January 2025
Note: This is technical analysis only. Always manage risk appropriately and DYOR.
#GALA #USDT #Crypto #TechnicalAnalysis #Trading

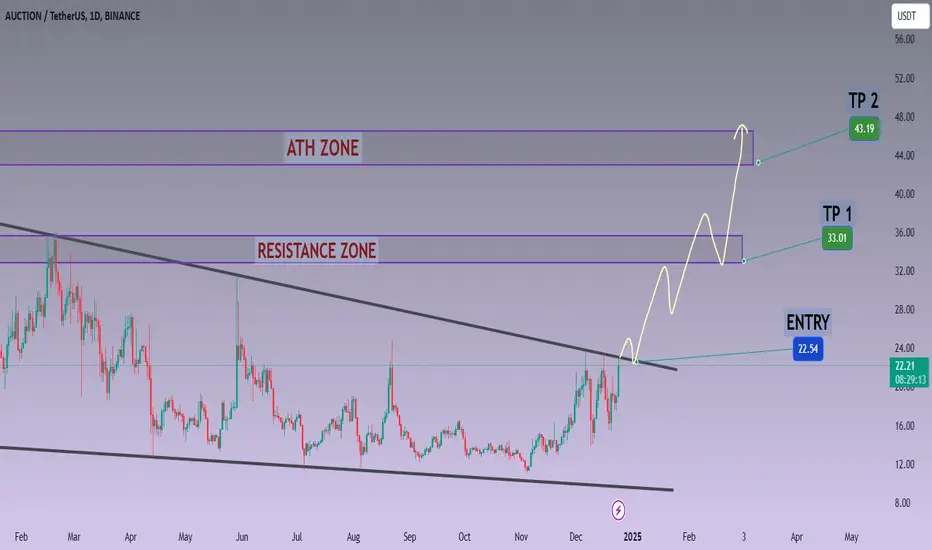
AUCTION/USDT: Major Trendline Break +90% Upside TargetAUCTION/USDT BREAKOUT TRADE
SETUP
• Major trendline break: $22.54
• Volume spike: 1.4M
• 8-month downtrend reversal
TARGETS
TP1: $33.01 (+46.45%)
TP2: $43.19 (+91.61%)
EXECUTION
Entry: $22.54
SL: Below recent swing low
Scale: 50/50 at TPs
BIAS: BULLISH
✓ Trendline break
✓ Volume confirmation
✓ Higher lows structure
✓ S/R flip zone: $22-28
RISK/REWARD
R1: 1:2.8 (TP1)
R2: 1:4.1 (TP2)
KEY LEVEL: $28.00
Previous resistance becomes support
⚠️ DISCLAIMER
• Not financial advice
• Past performance ≠ future results
• Markets are high risk
• Only trade what you can afford to lose
• DYOR - Do Your Own Research
• Author may hold position in AUCTION
Bitcoin can little correct and then continue to grow in rangeHello traders, I want share with you my opinion about Bitcoin. By observing the chart, we can see that the price declined to the resistance line and rebounded at once and made impulse up. BTC rose to a support level, which coincided with the buyer zone, but firstly it made a small correction and some time traded below the 92500 level. Soon, the price broke this level, after which it started to trades inside the range, where it at once made a retest and tried to grow, but later corrected the support level. Next, the price continued to move up and reached the resistance level, which coincided with the seller zone, after which corrected the resistance line. After this movement, BTC at once rebounded and rose to the seller zone and even higher, breaking the 103500 level. But soon, the price turned around and dropped to the support level, breaking the resistance level with the resistance line. Then the price turned around and a not long time ago started to grow. For this reason, I think that Bitcoin make a small movement down to almost the support level and then continue to grow to the 103500 resistance level inside the range. That's why I set my TP at this level. Please share this idea with your friends and click Boost 🚀
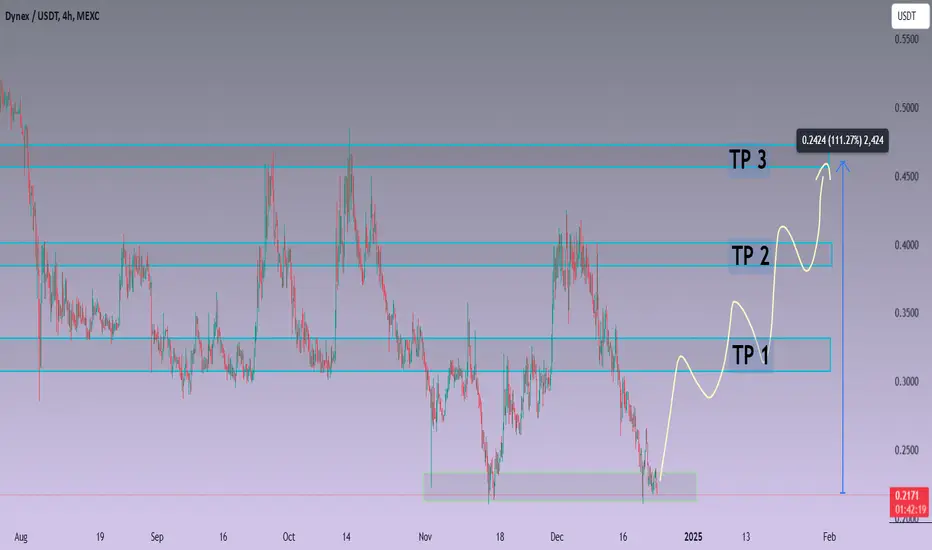
DNX/USDT: Bottom Formation with 3-Wave 111% ExpansionHere's a professional TradingView analysis for Dynex/USDT:
DYNEX/USDT Analysis - Potential 111% Growth Setup
Pattern Setup:
• Bottom formation confirmed at 0.215
• Triple target structure identified
• 4H timeframe showing reversal signals
Key Price Levels:
🎯 Entry Zone: 0.2150-0.2200
🎯 TP1: 0.3250 (+50%)
🎯 TP2: 0.4000 (+80%)
🎯 TP3: 0.4750 (+100%)
🛑 Stop Loss: Below 0.2000 (-8%)
Wave Structure:
1. First impulse targeting 0.32 zone
2. Second wave aiming for 0.40 resistance
3. Final wave projection to 0.47 area
Volume Analysis:
• Declining volume in downtrend
• Potential accumulation phase beginning
• Watch for volume confirmation on breakout
Risk Management:
• R:R Ratio for TP1: 1:6.25
• R:R Ratio for TP2: 1:9.5
• R:R Ratio for TP3: 1:13.9
Key Invalidation Points:
• Break below 0.20 invalidates setup
• Weekly close below entry zone cancels pattern
• Failure to break TP1 requires position review
Trade Management:
1. Scale in: 0.21-0.22 zone
2. Move stop loss to break even after TP1
3. Trail stops for remaining position
4. Take partial profits at each TP
Timeframe:
Position duration expected 4-6 weeks into early 2025
Note: This forecast based on technical analysis. Always manage risk appropriately and DYOR.
#Crypto #DYNEX #USDT #TechnicalAnalysis #Trading
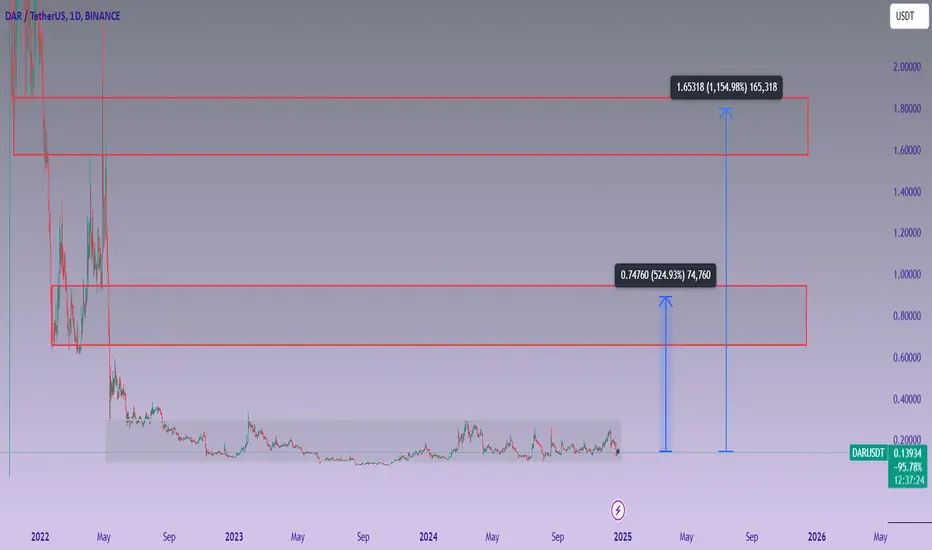
DAR/USDT: Major Historical Levels Analysis| NEXT 1100% PotentialBINANCE:DAR/USDT - 1D TIMEFRAME 🎯
MARKET STRUCTURE:
━━━━━━━━━━━━━━━━
✦ CURRENT PRICE: $0.13873 (-2.07%)
✦ FIRST TARGET: $0.74760 (+525%)
✦ ULTIMATE TARGET: $1.65318 (+1,100%)
✦ TIMEFRAME: Daily/Long-term
TECHNICAL BREAKDOWN:
━━━━━━━━━━━━━━━━
1. HISTORICAL CONTEXT:
• Price at multi-year support level
• Significant consolidation since May 2023
• Major historical resistance levels marked
2. KEY PRICE LEVELS:
• Current Support: ~$0.13-0.14
• First Major Resistance: $0.74760
• Second Major Resistance: $1.65318
3. VOLUME PROFILE:
• Current Volume: 29.45M
• Low volume consolidation phase
• Potential accumulation period
STRATEGIC OUTLOOK:
━━━━━━━━━━━━━━━━
LONG-TERM POTENTIAL:
• Two major upside targets identified
• Historical resistance levels as targets
• Significant upside potential from current levels
RISK CONSIDERATIONS:
• Current downtrend needs reversal confirmation
• Volume increase needed for momentum
• Extended consolidation possible
ENTRY STRATEGY:
━━━━━━━━━━━━━━━━
• Wait for reversal confirmation
• Look for volume expansion
• Consider scaling in on breakout confirmations
RISK DISCLOSURE:
━━━━━━━━━━━━━━━━
Trading involves substantial risk. This analysis is educational and should not be considered financial advice. Always conduct your own research and trade responsibly.
#DAR #Crypto #TechnicalAnalysis #TradingView #CryptoTrading
Tags: @TradingView
Note: The significant upside targets are based on historical price levels. Always use proper risk management and position sizing.
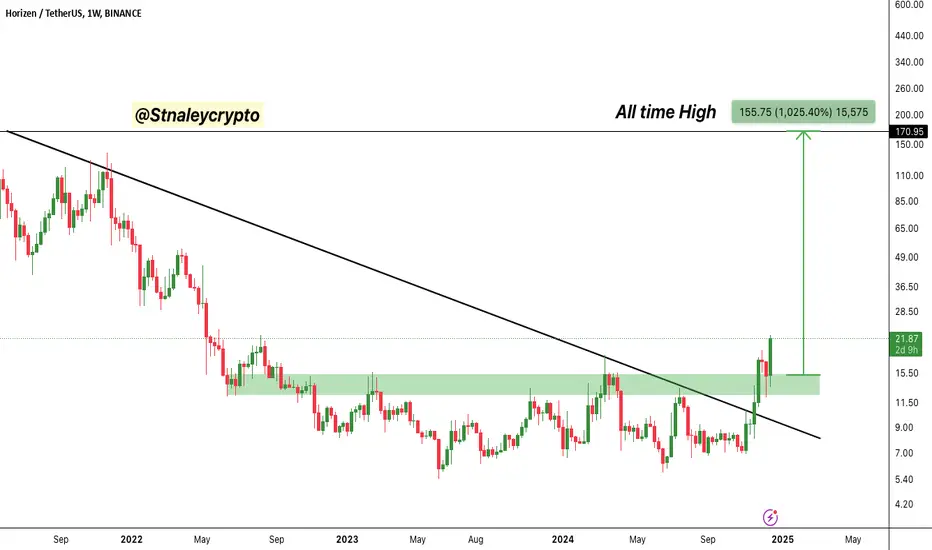
ZEN/USDT- Bullish Breakout Targets ATHDescription:
Breakout Confirmation:- Horizen (ZEN) has successfully broken out of its long-term downtrend, supported by significant volume.
Retest Success:- The $15.50 zone has flipped from resistance to support, reinforcing the bullish case.
Potential Target:- Based on historical price action, the next major resistance is at the all-time high of $170.95, a potential 1,025% upside.
Strategy:-
Entry:- On a pullback to $15.50–$18.00.
Stop Loss:- Below $14.00 to manage risk.
Targets:- Short-term: $36.50, Medium-term: $85.00, Long-term: $170.95.
Risk Management:- Use proper position sizing and adjust stops to break even once the price moves significantly in your favor.