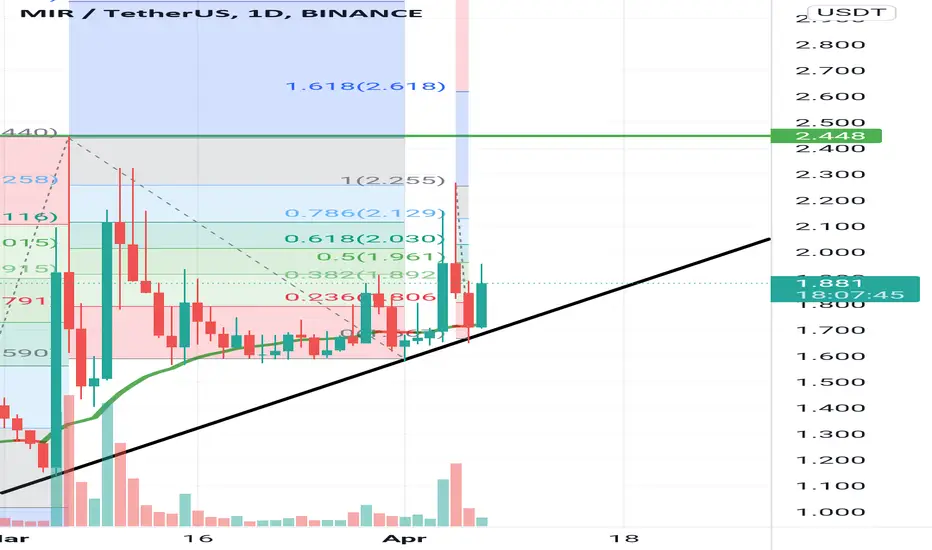
MIR is #altcoinseason, #BTC now go to 48/52 🚀This investment just for this pumb btc, take responsibility your risk
Target 🎯 entre 1.177 take profits 2.2
Btc-usdt
USDT.D support or resistance?!I do not know you, but I'm waiting for Bitcoin to react to this important level and open my position according to the behavior of candlesticks at this level. Wait for me
Have a good trade ;)

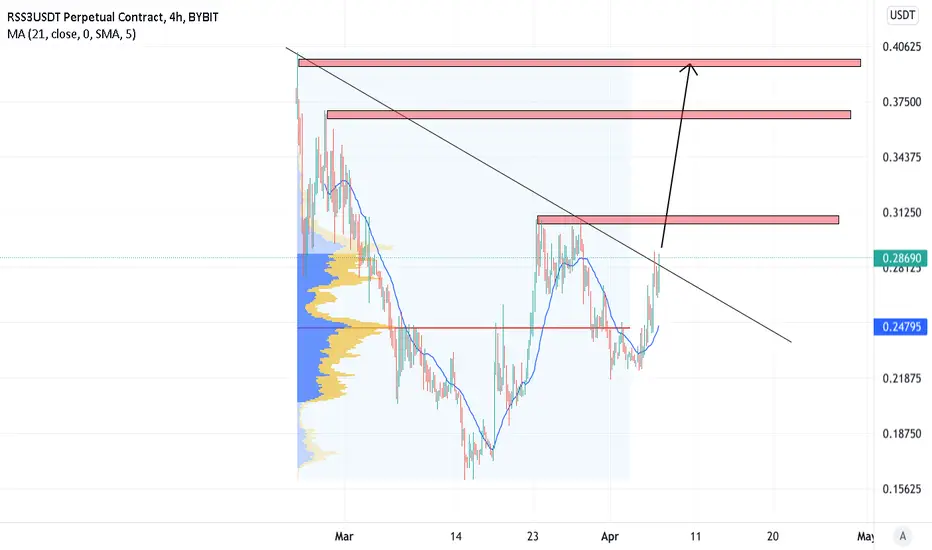
RSS3 +40% MOON Hello traders, hope all are having a profitable day! Please make sure to LIKE and FOLLOW for more valuable and accurate content
As many may realize i am new to tradingview and would like for my chart ideas to be seen and talked on always feel free to leave a message on your opinion on my analysis and i will message you back. I am starting a trading community and would like to help as many people as i can along the way. I plan on posting around 5 charts daily and will take request as well so if you have a particular coin you would like to see me provide technical analysis to please let me know and i would be more then happy too.
Thanks, have a great day!
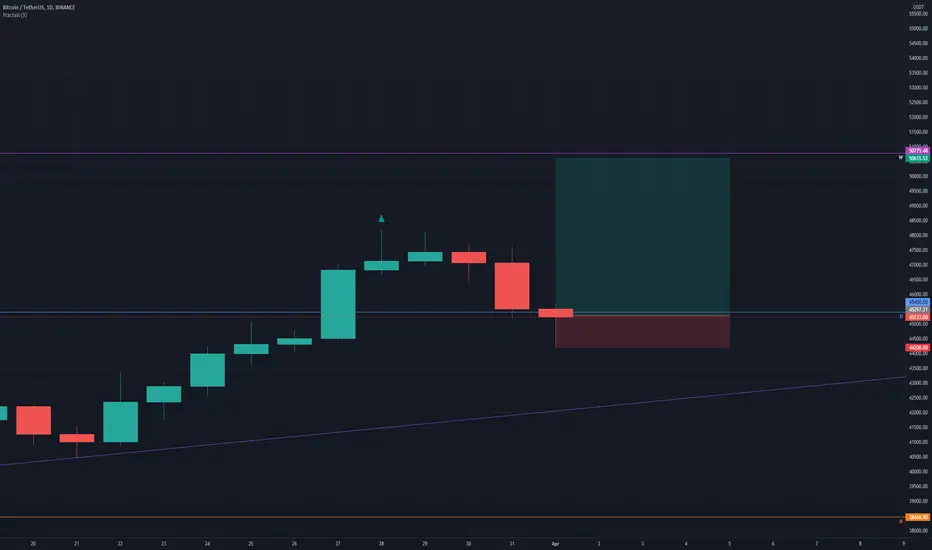
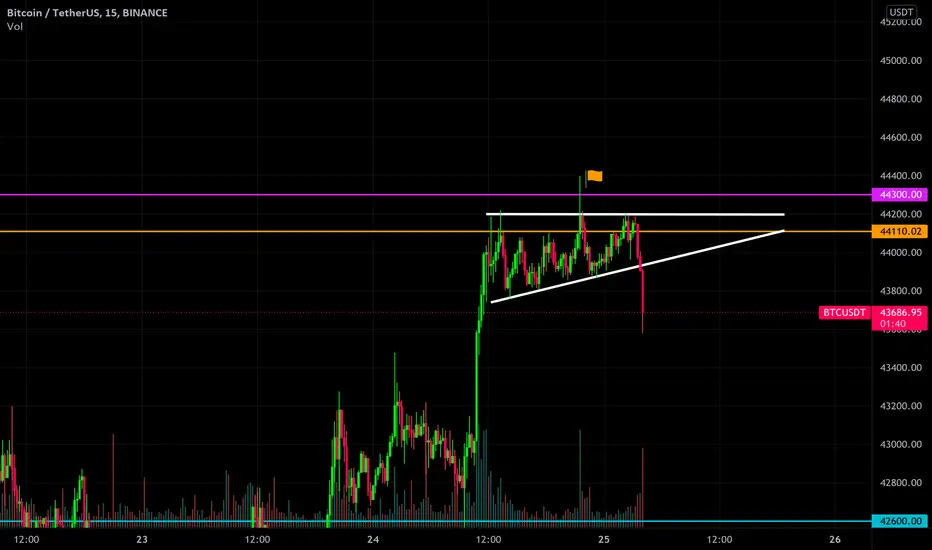
BTC/USDTHopefully it will keep the support and go its way up to the next resistance.
Maybe it will brake, who knows. :)
Keep an eye on it.
Have a nice day

Not sure about thisNot sure about this trade. I feel somewhat confident though. Let's wait a couple of days and see...
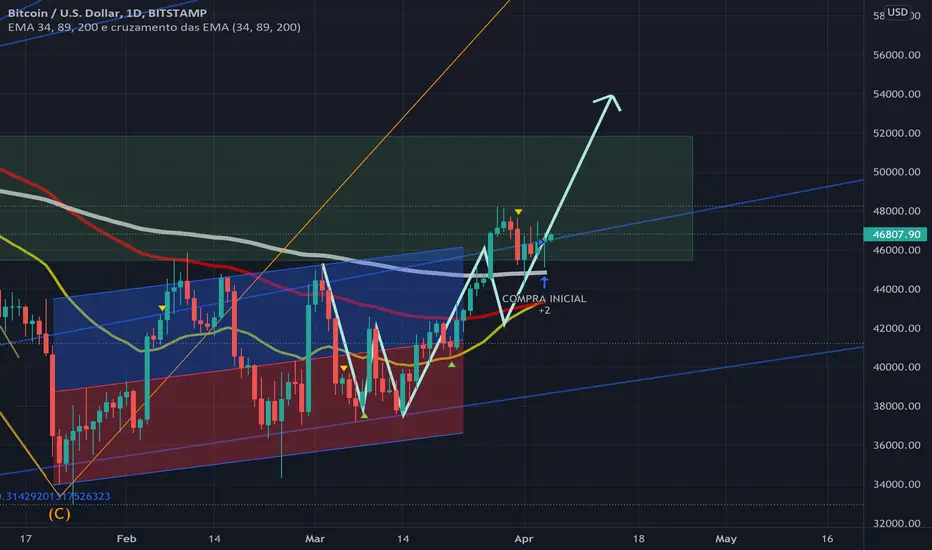
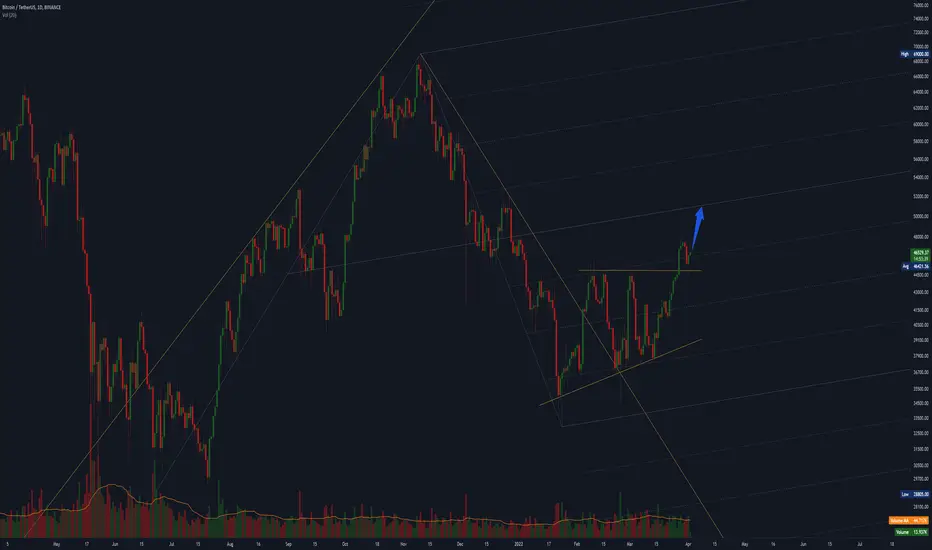
BTC has a signal to $52KThe EMA34 crosses above the EMA89, signaling a sustained bullish rally on a daily basis. The price is expected to go up to $52K, then return to around $48K and continue to break the ATH
BTCUSDTHello Crypto Lovers,
Mars Signals team wishes you high profits.
BTC/USDT, Daily time frame
Once breaking above the latest resistance line, the price is now consolidating on the top of this zone. We assume that the price will gain new strengh after ranging and „resting“ in its current support channel for a while. Thereafter we expect a movement toward the resistance line above. However, an initial pullback to the already broken resistance line (now support) before a movement to the upside is also possible.
Warning: This is just a suggestion and we do not guarantee profits. We advise you analyze the chart before opening any position.
Wish you luck

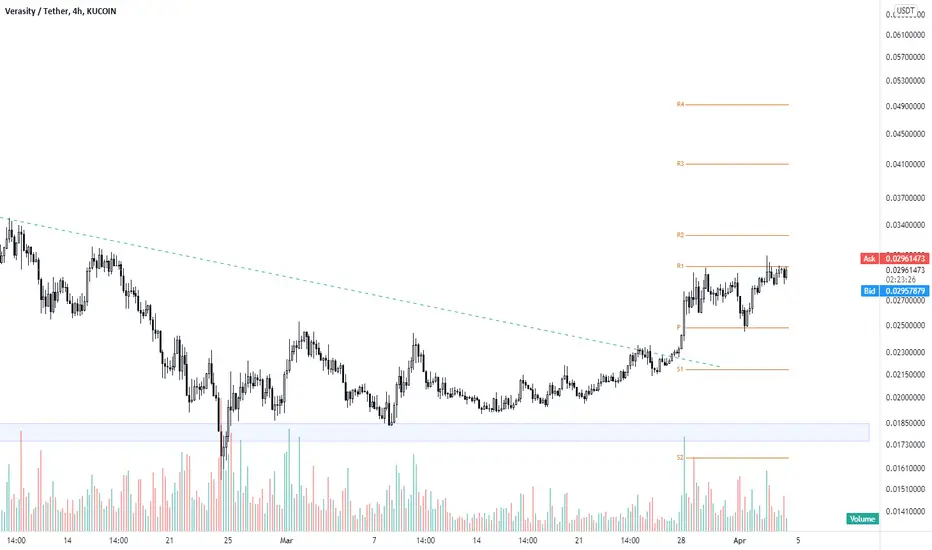
$VRAUSDT very close to break out from here - $VRA $BTC$VRAUSDT very close to break out from here - $VRA $BTC
it at resistance , looking good for a break out from this range
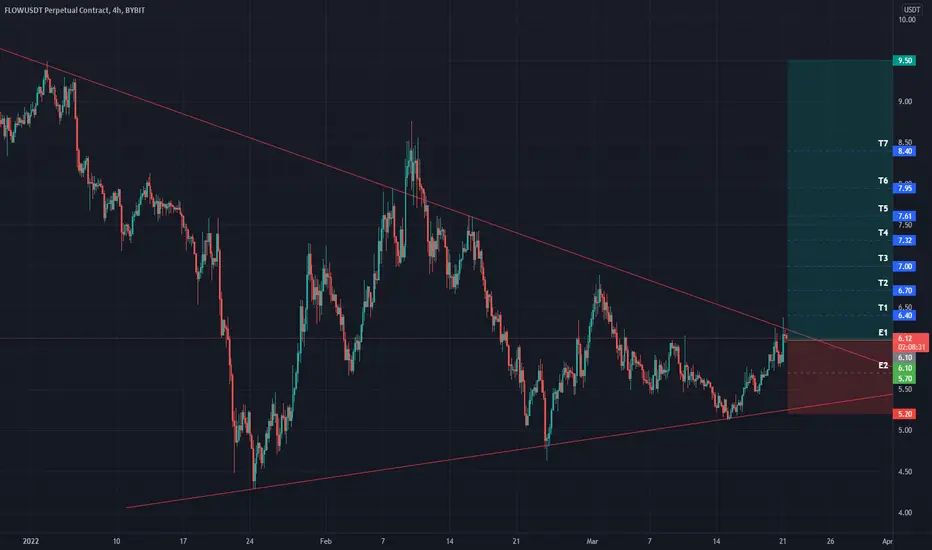
FLOW/USDT==============
FLOW/USDT
==============
Entry Points :
E1 : 6.10
E2 : 5.70
==============
Targets :
T1 : 6.40
T2 : 6.70
T3 : 7.00
T4 : 7.32
T5 : 7.61
T6 : 7.95
T7 : 8.40
==============
Stop Lose : 5.20
==============
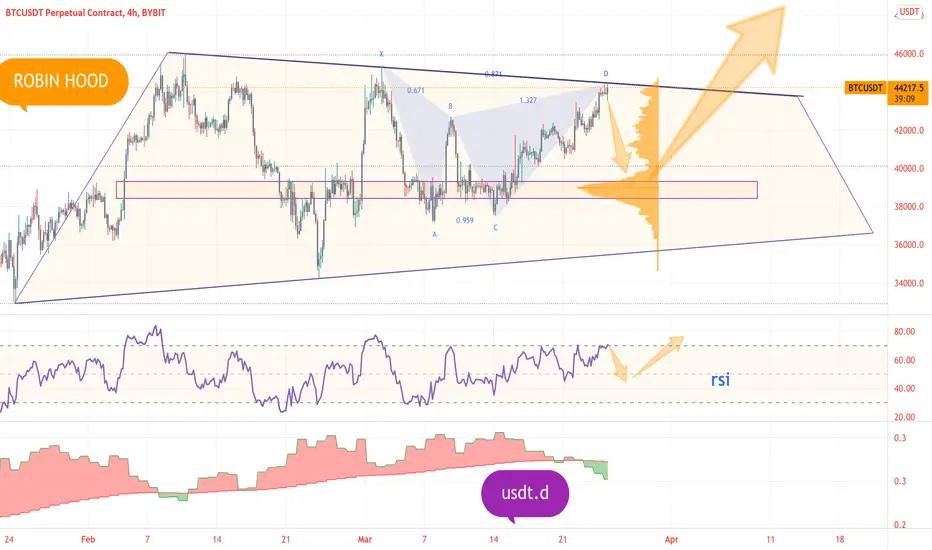
BTC after pullbackBTC after breakout and pullback. It broke out the resistant in an incremental triangle and finished to pullback to the support.
Nothings changed on BTC #BTC #BEARS #USDT #USDEveryone been real bullish the past 2 weeks, BTC about to give them a reality check. I'm not short, still sitting out stable farming after I sold my last looks bag this morning, until BTC can hold over 50k I still see 24k first.
might be right might be wrong, are bears back?Try using your own thoughts... everyone can be wrong... there are patterns for either directions ..
Indicators talk only about the past, they don't tell you about the future, forget about indicators, price action and harmony are better,,,
Although they too may be distorted due to the leveraged trends specially on shorter TFs.
Most of many who claim being trading teachers, the owner of the blah blah academy and such , aint know nothing... the economy has failed worldwide, otherwise the world would not be in this situation... we are facing economy collapse, do you thing the invented and many made up tools are perfect? perhaps no!!
Only gold is Gold
Fakeout until we BreakoutSo there’s proof that a lot of bitcoin has been greenlighted for major purchases….perhaps even already purchased but the price action is showing the retracement back down to either the bottom of the descending channel or the bottom of the rising support on macro time frame (white line). Either way, i think every time I’ve tried to short bitcoin it never works out….so buy the dip is my best advice.
The Wyckoff model predicts that after this retracement our beloved bitcoin might actually show us the final phase of the running flat correction in which we go parabolic. Terra and Microstrategy and others have now pulled out loans to buy more bitcoin, but remember every time you buy bitcoin it must be SOLD to you, so expect the dip when major buyers come in. The imbalance between supply and demand must be met to increase price action. So far we have lots of supply being slowly sold into buyers and when volume picks up that will show us when the storm begins.
Good luck traders. Not sure if you got the memo but we already hit the bottom at $34k and won’t be back there for a long time. IMO

Bitcoin Daily Chart Analysis#Bitcoin USDT Pair:
TA 1D Chart- #BTC/USDT
👉 In Daily TF it's following a falling Ascending Triangle pattern.
👉 It did breakout above from marked Resistance Zone.
👉 As of now, seems Bullish.
👉 Target is about 52K in short term .
👉 Strong buying Area- retest at marked support zone.
Keep Learning😃💯
➖➖➖
Cheers,
Team Crypto Billu
#CryptoBillu #HappyTrading💯 #NFA #DYOR

CRYPTO MARKET UPDATE!!!Hi Snipers,
Please refer to the recording for the next price levels and scenarios.
Thanks
MS

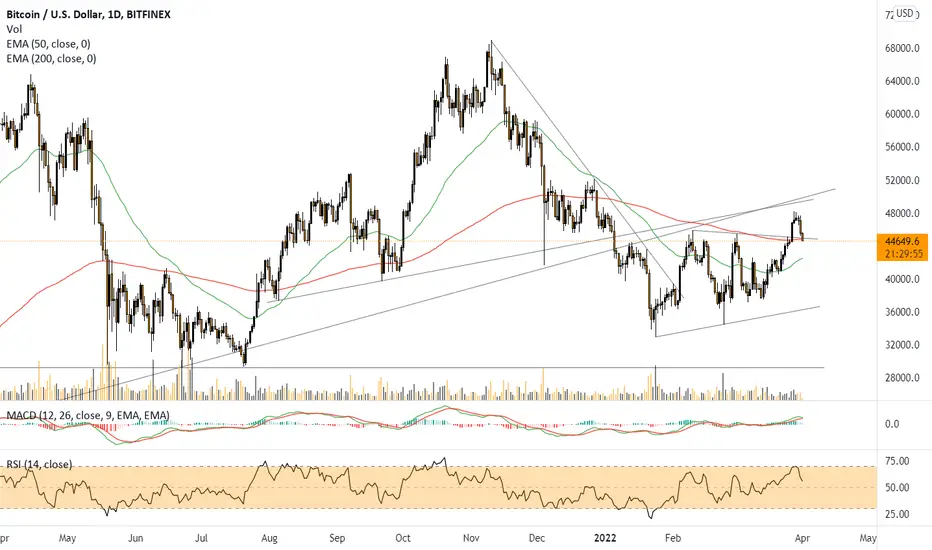
btcusdtWith BTC reversing sharply as of late, we can safely assume that ~33.5k was the bottom and that a new phase has started for crypto.
When comparing the BTC chart of the past 1.5 years, we can see some striking similarities with one of Wyckoff's Distribution schematics. Obviously, no real-world pattern will exactly copy the schematic. More important are the positions of the points of inflection.

BTCUSDTHello Crypto Lovers,
Mars Signals team wishes you high profits.
We are looking at BTC/USDT in a daily time frame. As you can see, the price finally succeeded to break through an important resistance line after having previouly tried to do so a few times, yet in vain. Thus the previous resistance line has turned into a support zone above which the price is consolidating at the moment. Nevertheless, another possible resistance area can be seen ahead of the price to which the price can react, moving back to our support line S1 for a pullback to prepare another rise to the next resistance. Another possibility for the price is to directly rush into the next resistance line (R1), leave it behind and move towards R2.
Warning: This is just a suggestion and we do not guarantee profits. We advise you analyze the chart before opening any position.
Wish you luck

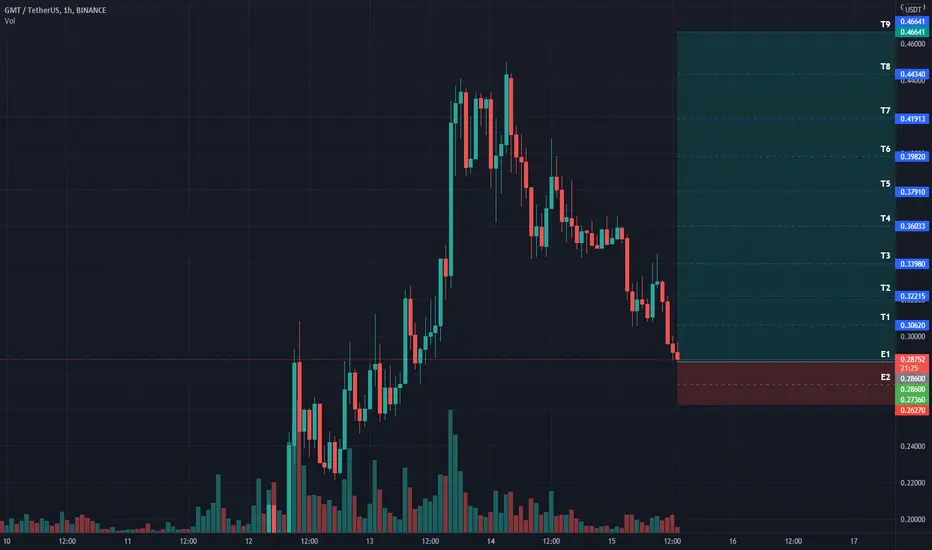
GMT/USDT ENTRY LONGGMT/USDT LONG
===========
Entry Points :
E 1 : 0.28600
E 2 : 0.27360
============
Targets :
T 1 : 0.30620
T 2 : 0.32215
T 3 : 0.33980
T 4 : 0.36033
T 5 : 0.37910
T 6 : 0.39820
T 7 : 0.41910
T 8 : 0.44340
T 9 : 0.46640
===========
Stop Lose : 0.26270
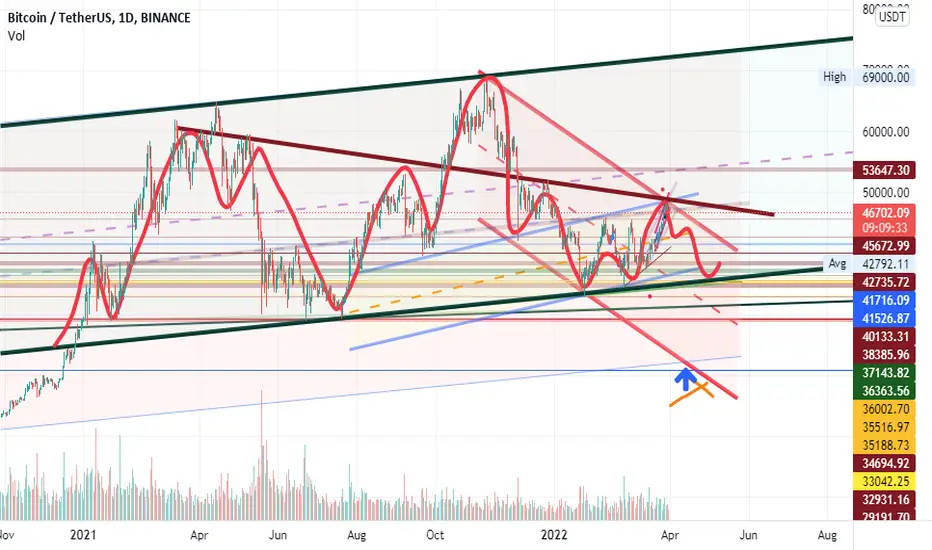
!!! BITCOIN !!! - Losing the power to buyHi,
The last few days were of loss of purchasing power and reaching a resistance zone.
the volatility we know well may be close and the arrow indicates where we are going.
This is just an idea.
Be careful.

btc/usdt with usdt.dHello everyone, if you like my idea, follow me with likes and comments, I will also try to share the best ideas with you, Always do your own research before opening positions and always put stop limit.
MARKET MAKER GAMES HAVE BEGUNLMAO how many long liquidations??? How many investors keep trying to buy when bitcoin has already pumped? It fascinates me the herd mentality. Meanwhile the fear and greed index jumped from 26 to 31 to 40 to 47 which shows the reactive trend of people buying bitcoin now that it shows “growth” on their robinhood accounts…..let’s be real here and understand that $46k is going to take a LOT to break through and hit $52k. Lack of volume….altcoins are showing massive volatility and interest compared to bitcoin. I’m shorting to $30.5K…. Good luck. Market has not priced in any of the bad stuff yet to come.
May happen in this yearIt's just an idea, please check by your analysis, if you are not agree with the scenario please correct my mistakes.

