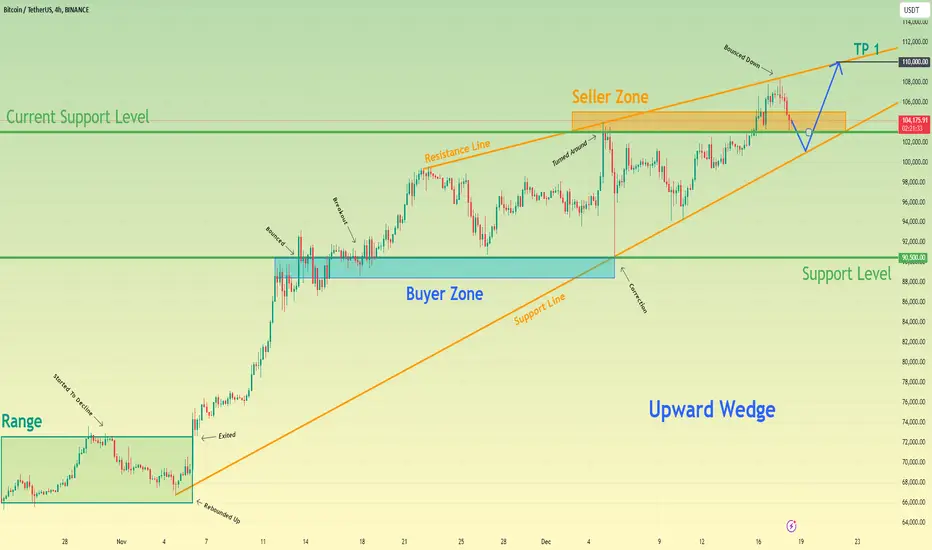
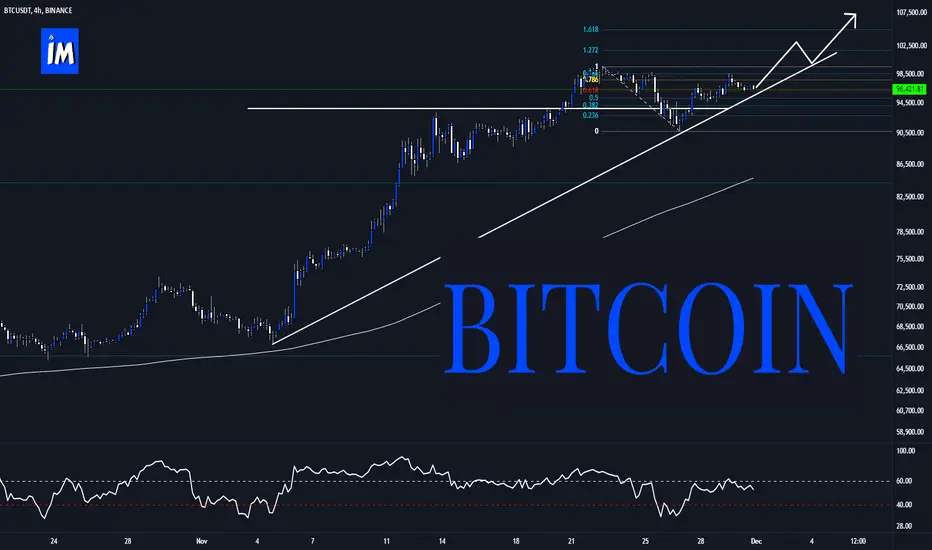
Bitcoin can correct and then continue to move up to new ATHHello traders, I want share with you my opinion about Bitcoin. Observing the chart, we can see how the price trades inside the range, where it reaches the top part and then starts to fall. In a short time, BTC fell almost to the bottom but then turned around and made an impulse up, exiting from range and continuing to grow inside an upward wedge. In this pattern, the price soon reached the 90500 support level, which coincided with the buyer zone, and then broke it, made a retest, and continued to move up. Later BTC reached the resistance line of the wedge and then corrected the support level, after which it rebounded at once and then rose to the current support level. Price tried to break, but failed and dropped to the 90500 level, after which at once continued to move up and soon reached the current support level, which coincided with the seller zone. Then the price broke the 103000 level and rose to the resistance line of a wedge, but a not long time ago it declined to the seller zone, where BTC continues to trades to this day. So, in my mind, the price can decline to the support line and then start to grow to the resistance line of an upward wedge. That's why I set my TP at 110000 points (new ATH), which coincided with the resistance line. Please share this idea with your friends and click Boost 🚀
Btc-usdt
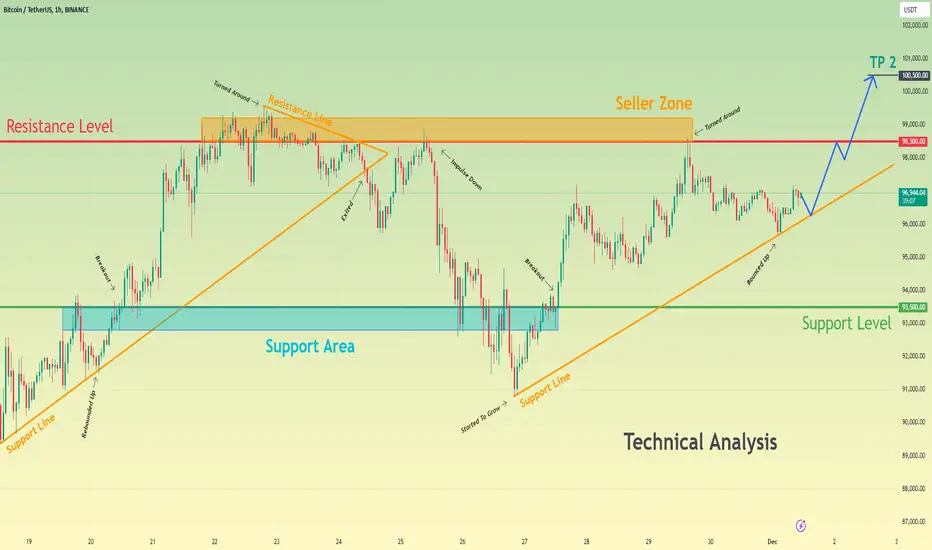
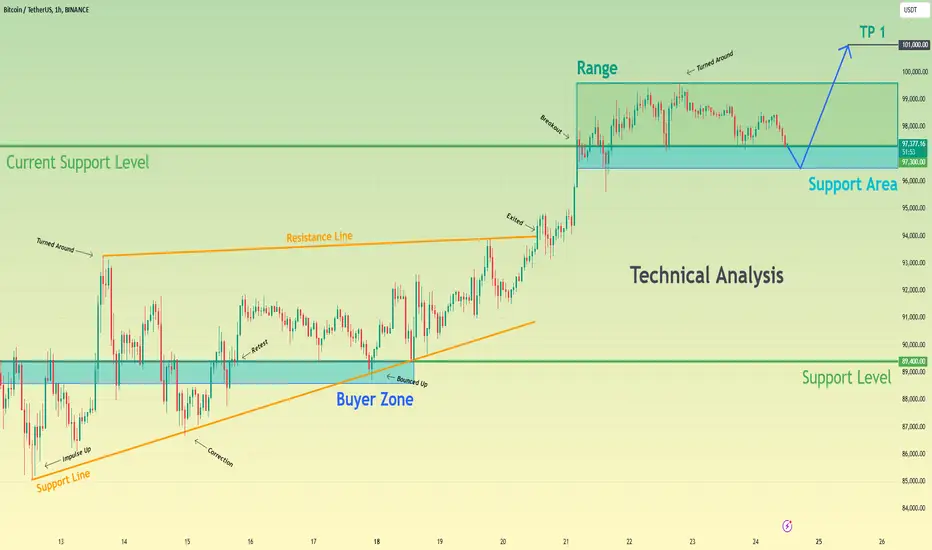
Bitcoin can make small move up and then drop to support lineHello traders, I want share with you my opinion about Bitcoin. Looking at the chart, we can see how the price a few moments ago started to decline and fell to the buyer zone, breaking the support level, where it some time traded. Later it tried to grow, but failed and quickly fell back to the buyer zone, after which made a strong upward impulse, breaking 95500 with 102200 levels. Next, the price grew more and then dropped to 90500 points, after which backed up and started to trades inside the triangle pattern. In this pattern, BTC almost rose to its current support level and then started to decline. In a short time, the price fell to the 95500 support level, and even lower, to support line of the triangle, which is coincided with the buyer zone. Then BTC bounced up and rose to the 102200 level, after which made little correction and then continued to move up. Some time later, the price reached the 102200 level again, broke it and now BTC trades inside the support area, very close to the resistance line of the triangle. So, for this case, I think BTC can make a small movement up and then continue to fall to the support line of the triangle pattern, breaking the support level. That's why I set my TP at 98900 points, which coincided with this line. Please share this idea with your friends and click Boost 🚀

Explosive Long-Term Potential - Aptos Evolved ($AEVOUSDT)I spend time researching and finding the best entries and setups, so make sure to boost and follow for more.
Aptos Evolved ( BINANCE:AEVOUSDT ): Daily Timeframe Analysis for Explosive Long-Term Potential
Trade Setup:
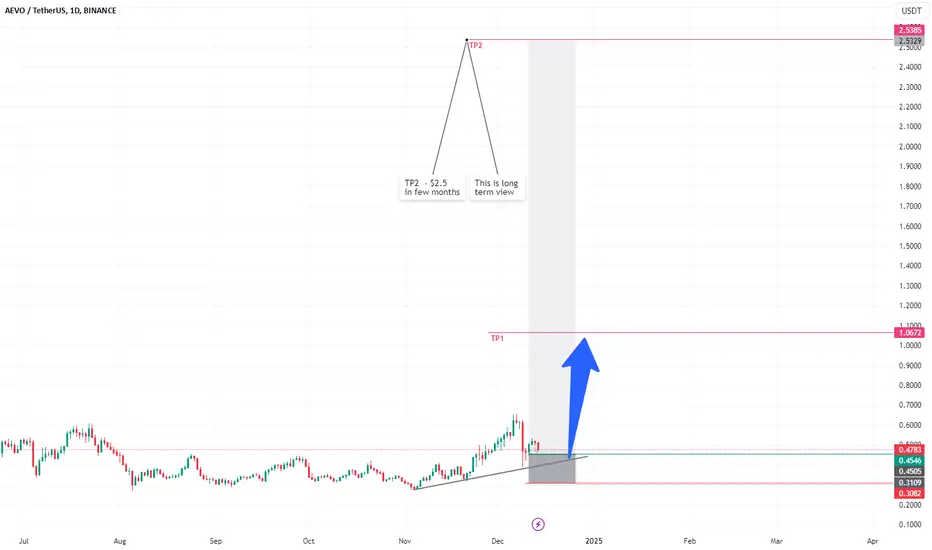
- Entry Price: $0.4505
- Stop-Loss: $0.3109
- Take-Profit Targets:
- TP1: $1.0672
- TP2: $2.5329
Fundamental Analysis:
Aptos Evolved ( BINANCE:AEVOUSDT ) is making waves in the blockchain space with its innovative approach to scalability and decentralized applications. Designed to meet the demands of next-generation DeFi protocols, BINANCE:AEVOUSDT has steadily built a strong ecosystem. Recent partnerships and a focus on interoperability have positioned this project for significant long-term growth.
BINANCE:AEVOUSDT has been consolidating for months, and this moment feels like the calm before the storm. With strong fundamentals and increasing attention from both institutional and retail investors, BINANCE:AEVOUSDT is ready for a breakout. If you’ve been waiting for the right time, this is it—make sure you’re in!
Technical Analysis (Daily Timeframe):
- Current Price: $0.4520
- Moving Averages:
- 50-Day SMA: $0.4250
- 200-Day SMA: $0.3800
- Relative Strength Index (RSI): Currently at 61, indicating increasing bullish momentum.
- Support and Resistance Levels:
- Support: $0.4000
- Resistance: $0.6000
The daily chart shows a classic breakout pattern, with BINANCE:AEVOUSDT breaking out of its consolidation phase. With strong volume support and bullish divergence on the RSI, the setup looks primed for a significant move toward the first target at $1.0672. TP2 at $2.5329 represents the long-term explosion many have been anticipating.
Market Sentiment:
Market sentiment around BINANCE:AEVOUSDT is overwhelmingly positive. Recent developments, such as new partnerships and integrations with major DeFi protocols, have sparked renewed interest. Long-term holders are showing confidence, and trading volume has picked up significantly, reflecting increasing demand.
Risk Management:
A stop-loss at $0.3109 protects against downside risks, while the targets offer exceptional reward potential. TP1 provides a 137% return, while TP2 offers a massive 462% gain, aligning with long-term growth expectations.
Key Takeaways:
- ASX:AEVO is positioned for a significant rally after months of consolidation.
- A strong technical setup combined with growing ecosystem fundamentals makes this a must-watch opportunity.
- Long-term holders should find confidence in BINANCE:AEVOUSDT potential to deliver explosive returns.
When the Market’s Call, We Stand Tall. Bull or Bear, We’ll Brave It All!
*Disclaimer: This analysis is for informational purposes only and does not constitute financial advice. Traders should conduct their own due diligence before making investment decisions.*
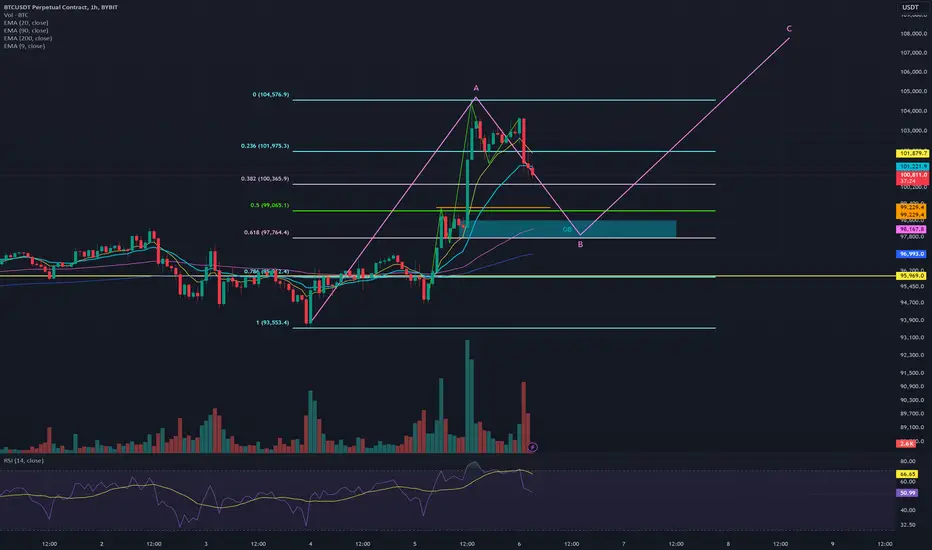
Bitcoin can rebound from resistance line and start to fallHello traders, I want share with you my opinion about Bitcoin. By observing the chart, we can see that the price some time ago started to decline inside the downward channel, where it at once reached a resistance line, after which continued to decline. In a short time, BTC fell to the buyer zone and then rebounded to the resistance line again. Then the price dropped to the channel's support line and then made a strong impulse up, thereby breaking the 96250 level and exiting from the channel too. Next, the price rose to 104K points, breaking the resistance level too, after which turned around and started trading inside symmetrical triangles. In this pattern, the price made a strong downward impulse to the support line, breaking resistance with support levels, but later it made an impulse from the support line, and broke these levels again. Later BTC started to decline and soon broke the 100200 level one more time and fell to the support line of the triangle. But a not long time ago it rebounded from this line and started to grow. So, at the moment, I think that the price can reach the resistance line of the triangle pattern and then start to decline to the 96250 support level. For this case, I set my TP at this level. Please share this idea with your friends and click Boost 🚀

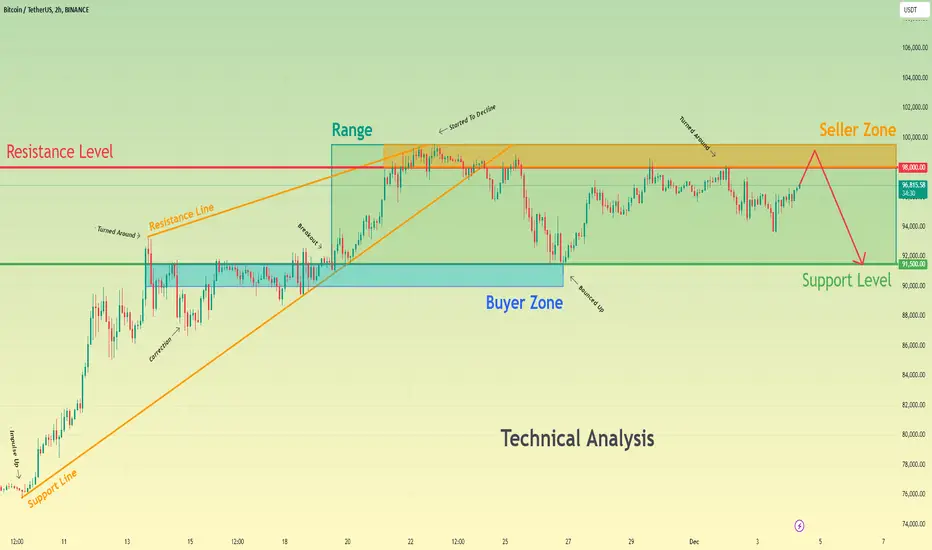
Bitcoin can rebound down from seller zone to $94K pointsHello traders, I want share with you my opinion about Bitcoin. Observing the chart, we can see how the price a few moments ago started to grow inside the upward channel, where it soon reached the 91500 support level, which coincided with the buyer zone. After this, BTc even rose a little higher than the 91500 level, but soon backed up and some time traded near the buyer zone. Later BTC finally broke the 91500 level and rose to the resistance line of the upward channel, which coincided with the current support level. Price at once turned around and made a correction to support level, after which it turned around and rebounded up. BTC tried to reach the current support level but failed and dropped to the support line of the upward channel, after which it made an upward impulse. After this, the price finally broke the 99500 level and rose to the channel's resistance line. Then the price turned around and dropped to the buyer zone inside the triangle, thereby exiting from the upward channel. But a not long time ago it turned around and made impulse up to seller zone, where it continues to trades to this day. So, I think that Bitcoin can leave the triangle and then rebound down from the seller zone, breaking the support level. For this case, I set my TP at 94000 points. Please share this idea with your friends and click Boost 🚀

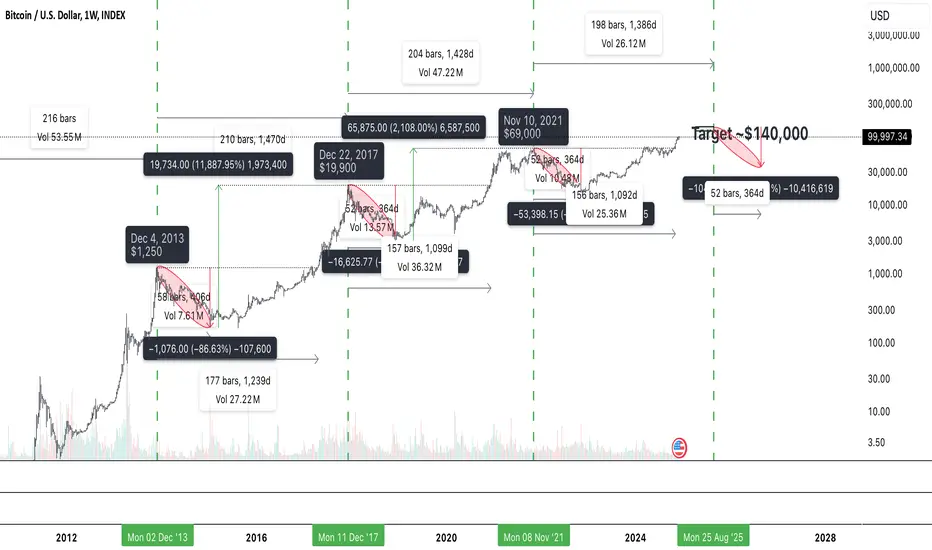
BTC 2025 cycle target date and priceTaking into account the previous cycles and date ranges I assume that current 4th BTC cycle will end in Summer, 2025 with ~$140,000 per BTC. Next - bear market for 1 year with target price to ~$30k / BTC
BTC BriefingHi Traders,
Look at 1H
Possible area to mitigate the residue orders as indicated.
Also, it shows 0.618 retracement at the same time.
Order block area indicated was resistance break out zone.
It shows many beneficial matters for placing an position later.
Waiting is key for long run trader.
Good luck.
Bitcoin can enter to seller zone and then start to fallHello traders, I want share with you my opinion about Bitcoin. Looking at the chart, we can see how the price a few moments ago entered a wedge, where it at once rebounded from the support line and started to grow. In a short time, the price grew to the 91500 support level and even a little higher, reached the resistance line of the wedge, and then made the correction, after which some time traded inside the buyer zone. Later BTC broke the 91500 level one more time and rose until to the 98000 level, which coincided with the seller zone and even entered to this area, after which it turned around and started to decline. Price exited from wedge and started to trades inside range. In range, the price declined below the 98000 resistance level, to the support level, after which BTC turned around and quickly rose back. Price some time traded near the resistance level and recently it little declined, but then started to grow. So, in my mind, BTC can enter to seller zone and then start to fall to the support level. For this case, I set my TP at the 91500 support level. Please share this idea with your friends and click Boost 🚀
Bitcoin: Is the Psychological Barrier of $100,000 Within Reach?Bitcoin: Is the Psychological Barrier of $100,000 Within Reach?
Bitcoin continues its impressive rally toward the psychological barrier of $100,000, driven by both fundamental and psychological factors. The rise in its value is supported by growing adoption, institutional investments, positive market sentiment, and key developments within the cryptocurrency ecosystem.
Adoption and Acceptance
Bitcoin’s growing acceptance by businesses, financial institutions, and individual users is increasing its utility and value. As more entities begin to accept bitcoin as a form of payment, demand naturally rises, solidifying its position as a viable medium of exchange.
Institutional Investments
One of the primary drivers of bitcoin’s growth is the involvement of large institutional investors such as hedge funds, investment firms, and corporations. Their entry into the market significantly boosts liquidity and builds confidence in the cryptocurrency, attracting smaller retail investors in the process.
Planned Regulatory Changes and Strategic Reserves
Future President Donald Trump’s proposals to establish strategic reserves in bitcoin and introduce cryptocurrency-friendly regulations could be game-changing for the market. Such measures are likely to attract new market participants, driving demand and increasing bitcoin’s value.
Media and Market Sentiment
Positive media coverage, endorsements from influential figures, and expert analyses play a crucial role in shaping market sentiment. Media narratives have a substantial impact on perception and can amplify investor interest, fueling price increases.
Technological Improvements
Advancements in blockchain technology and updates to the bitcoin network are improving its efficiency, security, and scalability. These innovations make bitcoin more appealing as an investment asset, contributing to its rising value.
Macroeconomic Factors
Global economic uncertainty, inflation, and the weakening of traditional fiat currencies are pushing investors toward alternative assets. Often referred to as “digital gold,” bitcoin is increasingly viewed as a hedge against currency devaluation and a reliable store of value.
The 2024 Halving
This year, bitcoin underwent another halving – the process that reduces the reward for mining new blocks by half. This reduction in new supply, coupled with sustained or growing demand, has historically led to price increases, and the current cycle appears to be following a similar trajectory.
Infrastructure Growth and ETFs
The cryptocurrency market’s infrastructure is rapidly evolving, making bitcoin more accessible than ever. The growth of exchanges, cryptocurrency wallets, and inflows into bitcoin-based ETFs are driving demand and strengthening the market.
Seasonality and an Unstoppable Trend
Seasonality is also working in bitcoin’s favor. Historically, the final months of the year often see strong performance in the cryptocurrency market. The current upward trend seems difficult to halt, and breaking through the $100,000 level appears to be only a matter of time.
Conclusion
Bitcoin remains one of the most dynamic assets on the market, drawing interest from institutional and retail investors alike. The combination of fundamental, technological, and macroeconomic factors suggests that the rally toward $100,000 could not only materialize but also set the stage for further gains.
Will bitcoin surpass this symbolic threshold, or are there still hurdles ahead? Share your thoughts in the comments.
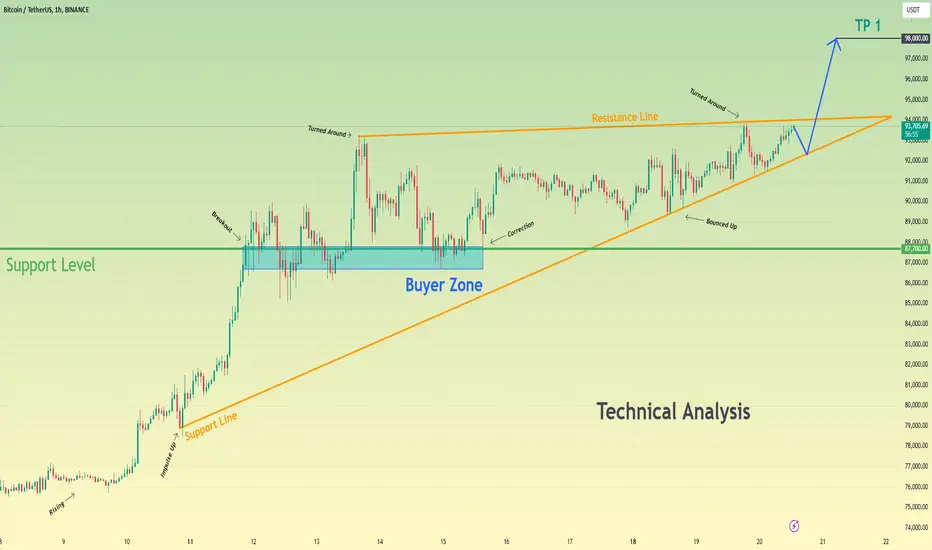
Bitcoin can correct to support line and then continue to growHello traders, I want share with you my opinion about Bitcoin. Observing the chart, we can see how the price started to grow inside the pennant near the support line and later reached the 93500 support level, which coincided with the support area. Soon, the price broke this level and continued to move up to the resistance level, which coincided with the seller zone and even entered to this area, after which it reached the resistance line of the pennant. Then BTC turned around and declined to support line and later exited from the pennant pattern, after which little fell and then rose to the 98500 level. BTC tried to break it, but failed and dropped to support level firstly and soon broke this level too and fell until to 90785 points. Then Bitcoin turned around and rose to the 93500 support level, broke it, and later rose to the resistance level. After this, the price turned around and made correction to support line of triangle, but a not long time ago it turned around and started to grow. So, in my opinion, the price can decline to the support line and then continue to grow to the resistance level. When the price reaches this level, it can break it, thereby exiting from the triangle also and then going next, making firstly retest or without it. For this case, I set two TP: first at the 98500 level, and second at 100500 points. Please share this idea with your friends and click Boost 🚀
Bitcoin: Is the Psychological Barrier of $100,000 Within Reach?Bitcoin: Is the Psychological Barrier of $100,000 Within Reach?
Bitcoin continues its impressive rally toward the psychological barrier of $100,000, driven by both fundamental and psychological factors. The rise in its value is supported by growing adoption, institutional investments, positive market sentiment, and key developments within the cryptocurrency ecosystem.
Adoption and Acceptance
Bitcoin’s growing acceptance by businesses, financial institutions, and individual users is increasing its utility and value. As more entities begin to accept bitcoin as a form of payment, demand naturally rises, solidifying its position as a viable medium of exchange.
Institutional Investments
One of the primary drivers of bitcoin’s growth is the involvement of large institutional investors such as hedge funds, investment firms, and corporations. Their entry into the market significantly boosts liquidity and builds confidence in the cryptocurrency, attracting smaller retail investors in the process.
Planned Regulatory Changes and Strategic Reserves
Future President Donald Trump’s proposals to establish strategic reserves in bitcoin and introduce cryptocurrency-friendly regulations could be game-changing for the market. Such measures are likely to attract new market participants, driving demand and increasing bitcoin’s value.
Media and Market Sentiment
Positive media coverage, endorsements from influential figures, and expert analyses play a crucial role in shaping market sentiment. Media narratives have a substantial impact on perception and can amplify investor interest, fueling price increases.
Technological Improvements
Advancements in blockchain technology and updates to the bitcoin network are improving its efficiency, security, and scalability. These innovations make bitcoin more appealing as an investment asset, contributing to its rising value.
Macroeconomic Factors
Global economic uncertainty, inflation, and the weakening of traditional fiat currencies are pushing investors toward alternative assets. Often referred to as “digital gold,” bitcoin is increasingly viewed as a hedge against currency devaluation and a reliable store of value.
The 2024 Halving
This year, bitcoin underwent another halving – the process that reduces the reward for mining new blocks by half. This reduction in new supply, coupled with sustained or growing demand, has historically led to price increases, and the current cycle appears to be following a similar trajectory.
Infrastructure Growth and ETFs
The cryptocurrency market’s infrastructure is rapidly evolving, making bitcoin more accessible than ever. The growth of exchanges, cryptocurrency wallets, and inflows into bitcoin-based ETFs are driving demand and strengthening the market.
Seasonality and an Unstoppable Trend
Seasonality is also working in bitcoin’s favor. Historically, the final months of the year often see strong performance in the cryptocurrency market. The current upward trend seems difficult to halt, and breaking through the $100,000 level appears to be only a matter of time.
Conclusion
Bitcoin remains one of the most dynamic assets on the market, drawing interest from institutional and retail investors alike. The combination of fundamental, technological, and macroeconomic factors suggests that the rally toward $100,000 could not only materialize but also set the stage for further gains.
Will bitcoin surpass this symbolic threshold, or are there still hurdles ahead? Share your thoughts in the comments.

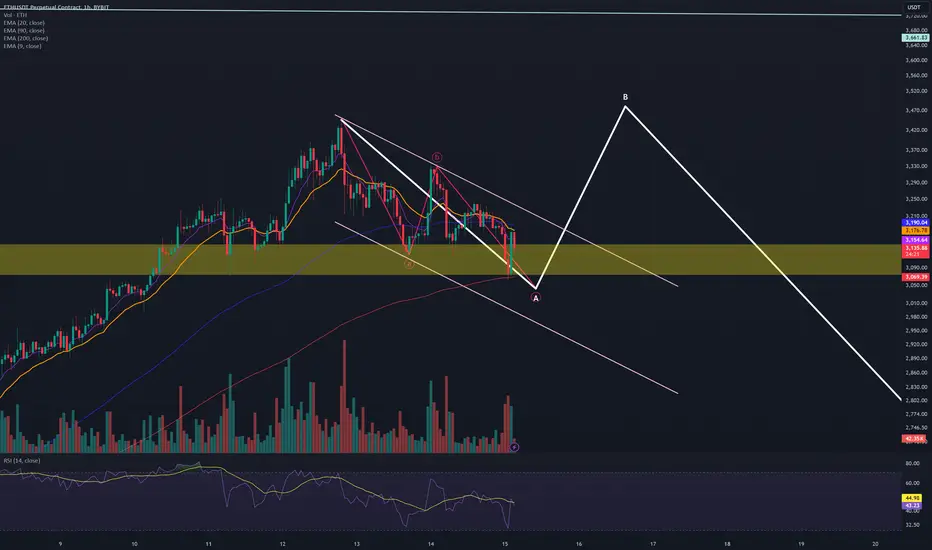
ETH 1h Brief analyseHi Traders,
There is still unmitigation zone at 1D.
I believe that it seem to be a destination for me where ETH will be heading to.
You see the wave a-b-c at 1h and trend line written at 4h.
Hopefully, this confluence works.
Just remember it can do down further to 0.681 level as good retracement level.
Make sure double check the confirmation then start place the position with stop loss.
3 rules
Buy
Sell
Wait

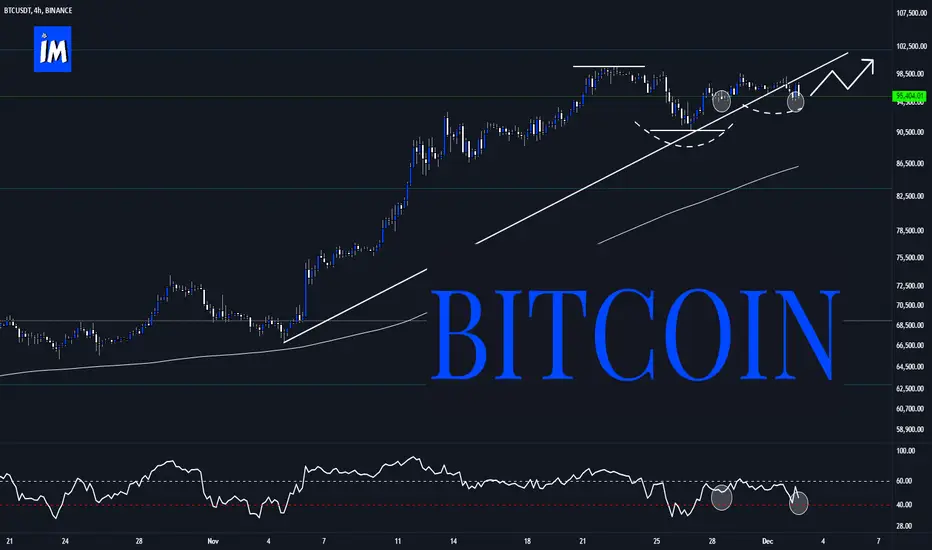
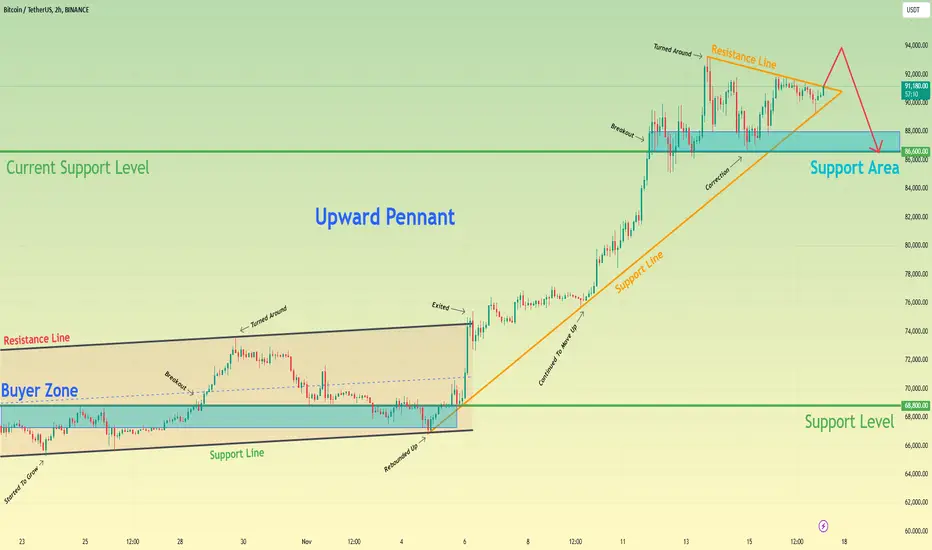
Bitcoin can little correct and then start to grow to 100KHello traders, I want share with you my opinion about Bitcoin. Looking at the chart, we can see how the price some days ago entered to upward channel, where it at once fell to the support line and then continued to grow. In a short time, BTC reached the 66800 support level, which coincided with the buyer zone and broke it, after which some time traded near and later rebounded to the resistance line of the channel. Then price made a correction to the support level and then made an impulse, exiting from the upward channel. Next, BTC continued to grow inside the upward pennant, where it rebounded from the support line and rose to the current support level, which coincided with the support area. Bitcoin some time traded inside the support area and later broke it, after which rose to the resistance line and then turned around. Price declined to support line of this pattern, which coincided with the 91500 current support level. But a not long time ago, it started to grow, so, now I think that BTC can little correct, to support level, and then start to grow to 100K. Please share this idea with your friends and click Boost 🚀

Bitcoin: Is the Psychological Barrier of $100,000 Within Reach?Bitcoin: Is the Psychological Barrier of $100,000 Within Reach?
Bitcoin continues its impressive rally toward the psychological barrier of $100,000, driven by both fundamental and psychological factors. The rise in its value is supported by growing adoption, institutional investments, positive market sentiment, and key developments within the cryptocurrency ecosystem.
Adoption and Acceptance
Bitcoin’s growing acceptance by businesses, financial institutions, and individual users is increasing its utility and value. As more entities begin to accept bitcoin as a form of payment, demand naturally rises, solidifying its position as a viable medium of exchange.
Institutional Investments
One of the primary drivers of bitcoin’s growth is the involvement of large institutional investors such as hedge funds, investment firms, and corporations. Their entry into the market significantly boosts liquidity and builds confidence in the cryptocurrency, attracting smaller retail investors in the process.
Planned Regulatory Changes and Strategic Reserves
Future President Donald Trump’s proposals to establish strategic reserves in bitcoin and introduce cryptocurrency-friendly regulations could be game-changing for the market. Such measures are likely to attract new market participants, driving demand and increasing bitcoin’s value.
Media and Market Sentiment
Positive media coverage, endorsements from influential figures, and expert analyses play a crucial role in shaping market sentiment. Media narratives have a substantial impact on perception and can amplify investor interest, fueling price increases.
Technological Improvements
Advancements in blockchain technology and updates to the bitcoin network are improving its efficiency, security, and scalability. These innovations make bitcoin more appealing as an investment asset, contributing to its rising value.
Macroeconomic Factors
Global economic uncertainty, inflation, and the weakening of traditional fiat currencies are pushing investors toward alternative assets. Often referred to as “digital gold,” bitcoin is increasingly viewed as a hedge against currency devaluation and a reliable store of value.
The 2024 Halving
This year, bitcoin underwent another halving – the process that reduces the reward for mining new blocks by half. This reduction in new supply, coupled with sustained or growing demand, has historically led to price increases, and the current cycle appears to be following a similar trajectory.
Infrastructure Growth and ETFs
The cryptocurrency market’s infrastructure is rapidly evolving, making bitcoin more accessible than ever. The growth of exchanges, cryptocurrency wallets, and inflows into bitcoin-based ETFs are driving demand and strengthening the market.
Seasonality and an Unstoppable Trend
Seasonality is also working in bitcoin’s favor. Historically, the final months of the year often see strong performance in the cryptocurrency market. The current upward trend seems difficult to halt, and breaking through the $100,000 level appears to be only a matter of time.
Conclusion
Bitcoin remains one of the most dynamic assets on the market, drawing interest from institutional and retail investors alike. The combination of fundamental, technological, and macroeconomic factors suggests that the rally toward $100,000 could not only materialize but also set the stage for further gains.
Will bitcoin surpass this symbolic threshold, or are there still hurdles ahead? Share your thoughts in the comments.

Bitcoin can rebound up from support area to 101K pointsHello traders, I want share with you my opinion about Bitcoin. By observing the chart, we can see that the price some time ago rebounded from the support level, which coincided with the buyer zone and dropped to 85000 points. After this, the price turned around and started to trades inside the wedge, where it later rose to 89400 level and broke this level. Next, BTC rose to the resistance line of the wedge, after which it turned around and made a correction to the support line of the wedge, after which it continued to grow. Soon, the price broke the 89400 support level one more time, made a retest, and later made a correction to this level again and then bounced up. Price rose to the resistance line of the wedge and soon exited from this pattern. Then the price reached the current support level, which coincided with the support area and broke this level. After this, BTC started to trades inside the wedge, where it reached the top part of the range, but a not long time ago, BTC made a correction to the 97300 support level. So, in my opinion, Bitcoin will fall to the support area and then start to grow to the top part of the range. Then it can exit from this pattern and continue to move up next, therefore I set my TP at 101000 points. Please share this idea with your friends and click Boost 🚀
Bitcoin can exit from pennant and rise to new ATH (98K points)Hello traders, I want share with you my opinion about Bitcoin. By observing the chart, we can see that the price rose from 75750 points to 81000 points and then made a little correction. After this, the price made a strong impulse up to the 87700 support level. Also then price started to trades inside the pennant, where it later broke the 87700 level and then tried to grow more, but failed and some time traded between this level. Then BTC bounced from the buyer zone and rose to the resistance line of the pennant, after which at once turned around and made a correction back to the buyer zone. Next, prices not long time traded in this area and later continued to move up inside the pennant. Soon, the price reached the support line of this pattern, and continued to move up near this line and some time later BTC rebounded from this line to the resistance line. A not long time ago, the price turned around and made a small correction, after which in a short time, it backed up. At the moment, the price trades near the resistance line of the pennant. So, I think that BTC can fall to the support line and then rebound up higher than the resistance line, thereby exiting from the pennant pattern. Also, I expect that then price will continue to grow, therefore I set my TP at 98K points. Please share this idea with your friends and click Boost 🚀
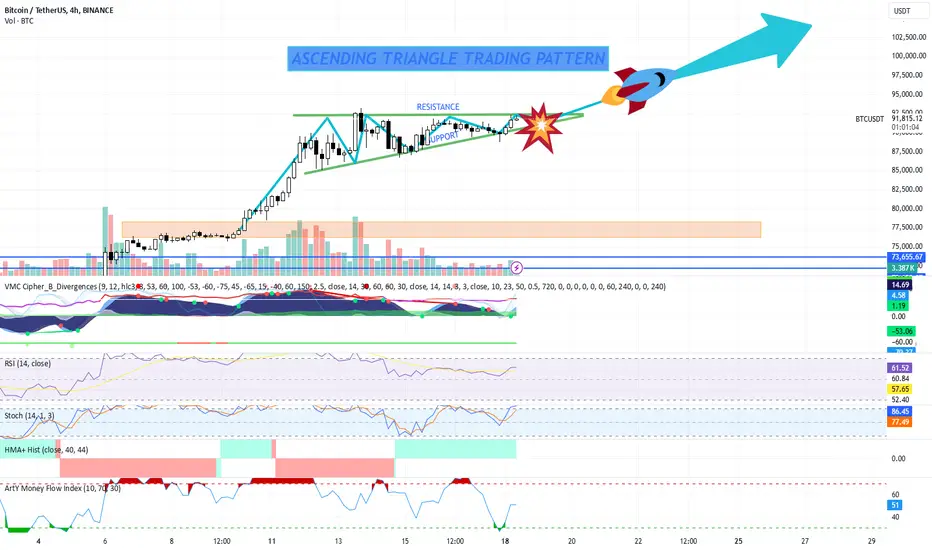
BITCOIN ON ITS WAY TO A NEW ALL TIME HIGH! TA + TRADE PLANTechnical Analysis of Bitcoin (BTC/USDT)
Price Action:
The chart shows an ascending triangle pattern, which is typically a bullish continuation pattern. It suggests that Bitcoin is likely preparing for an upward breakout. The price has been respecting the support trendline (ascending) while testing the resistance level at around $91,700.
There is strong upward momentum, confirmed by the price movement toward the resistance, with higher lows indicating growing buyer interest.
Indicators:
VMC Cipher B Divergences:
The indicator shows a bullish divergence (green color), which often suggests that the price is likely to break above resistance, supported by buying momentum.
RSI (Relative Strength Index):
RSI is currently at 61.77, which is in the neutral zone (neither overbought nor oversold). This suggests that Bitcoin still has room for upward movement before becoming overbought.
Stochastic Oscillator:
The Stochastic is at 88.21, indicating a potential overbought condition, suggesting that while there may be an upward push, a pullback could follow soon if the price rises too quickly.
HMA (Hull Moving Average):
The HMA histograms show bullish momentum (green area), which indicates strong upward trends, though the shift to red on lower timeframes suggests caution for short-term corrections.
Money Flow Index (MFI):
MFI is showing a value of 51, indicating balanced buying and selling pressure. This suggests that while the market has potential for an upward move, it is still neutral in terms of volume and money flow.
Volume Analysis:
The volume profile shows a buildup of buying activity with the price consolidating near the resistance zone. Volume is steadily increasing, which is usually a positive sign for a breakout.
There is lower volume in the consolidation area, which could indicate a breakout is imminent.
Trading Plan
Entry Strategy:
Buy Position: If Bitcoin breaks above the resistance level at $92,212 with high volume, consider entering a long position. This breakout could push the price toward the next resistance at $95,000 or higher.
Watch for confirmation with volume spikes and RSI maintaining below 70 to avoid entering when the market is overly extended.
Target Price (Take Profit):
The next immediate resistance levels to target are $95,000 and $102,500. Set partial take profit orders around these levels.
A more aggressive target would be $105,000 (based on the breakout projection).
Stop Loss:
Place a stop loss below the support trendline or around $85,000 to mitigate risks in case of a false breakout or price reversal.
For more conservative risk management, a tighter stop loss around $87,500 could be used if the breakout is confirmed with strong volume.
Risk Management:
Use proper risk management, aiming to risk no more than 1-2% of your portfolio on each trade.
Watch for volatility and unexpected moves, especially considering the high stochastic reading, which might indicate a short-term overbought condition.
Alternative Scenario (If Breakout Fails):
If the price fails to break above resistance and falls back into the consolidation zone, consider a short position only if the price breaches the support line.
Watch for bearish divergence in the indicators (such as RSI or MFI) for confirmation of a potential downtrend.
This plan provides a clear strategy for trading Bitcoin, balancing potential profits with careful risk management. Stay alert for market updates, and adjust your strategy accordingly if significant changes occur.
Bitcoin can exit from pennant, after which starts to declineHello traders, I want share with you my opinion about Bitcoin. By observing the chart, we can see that the price rose inside the upward channel, where it soon reached the buyer zone, which coincided with the support level. Later, BTC broke this level and rose to the resistance line of the channel, but then it turned around and made a correction movement to the buyer zone. In this area, the price rebounded from the support line of the channel and started to grow, so, in a short time it broke the 68800 level again and then exited from the upward channel. Next, BTC continued to move up inside the upward pennant, reaching the support line and rebounding higher. Later, the price reached the current support level (86600) which coincided with the support area, and soon broke this level, after which rose to to resistance line of the pennant. Then it made a correction movement to the support area, after which turned around and rose back to the resistance line of the pennant. Now, the price continues to trades near this line and I think that BTC can exit from this pattern and little grow more. After this, the price can turn around and start to decline to the 86600 support level. Please share this idea with your friends and click Boost 🚀
ETH brief analyseThere are still room for high peak.
This week upward wave-B is retracement of A in 1day chart.
When this B retracement end, which (A)- (B)- (C) wave at 1hour drown.
Big correction wave might begin, like a week.
This is my trading scenario to share with you.
Please always set up stop loss for long run trading.
There is always opportunity in other days.
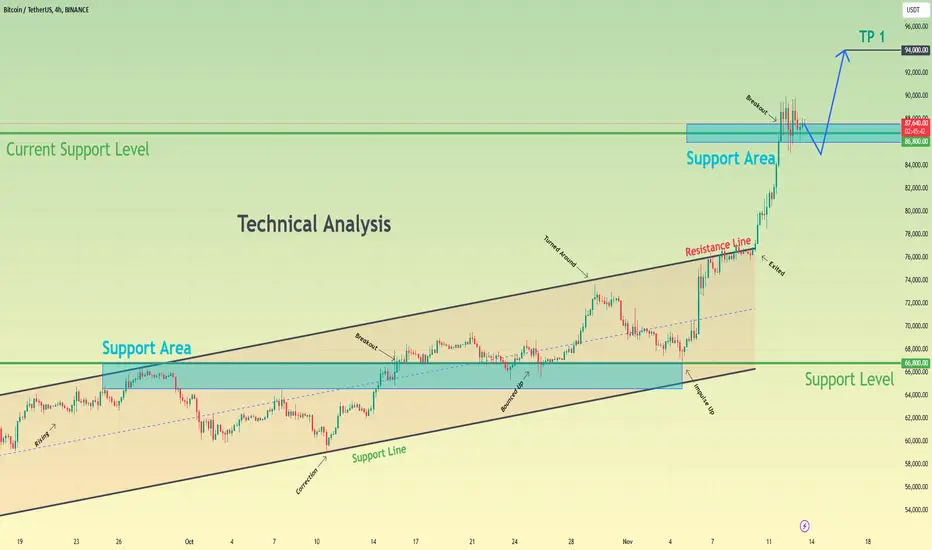
Bitcoin can little correct and then continue to move upHello traders, I want share with you my opinion about Bitcoin. By observing the chart, we can see that the price a few days ago started to grow inside the upward channel, where it at once reached the resistance line of the channel. Then the price rose to the support area, which coincided with the 66800 support level, and then turned around and made a correction to the support line of the upward channel. When the price fell, it turned around and in a short time rose to the 66800 level, broke it, and then some time traded near. Later, BTC bounced from this level and rose almost to the resistance line of the channel, after which turned around and corrected to the support level, where at once made a strong upward impulse to the resistance line. Price some time traded between this line and later exited from a channel and continued to move up. Some time later, the price reached 86800 current support level, which is located inside one more support area and broke this level. Now BTC trades near this level and in my mind, the price can make a small correction, below the support level, and then continue to grow, and even reach new ATH. For this case, I set my TP at 94000 points. Please share this idea with your friends and click Boost 🚀
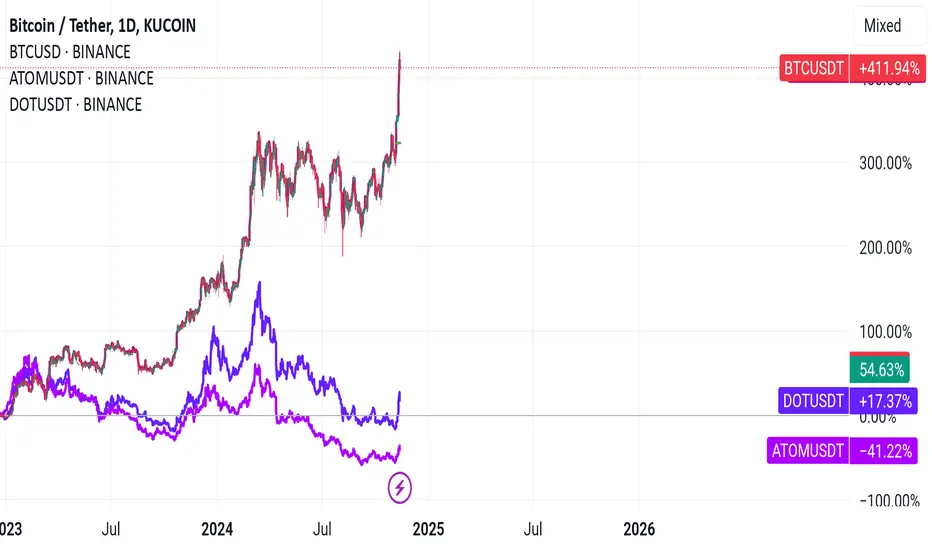
Compare BTC DOT ATOM It seems that Bitcoin has grown a lot compared to the currencies of Polkadat and Atom. Of course, it is not a correct comparison, but this shows that the way for Atom and Polkadat to move will be much smoother due to the developments that will happen in their networks.
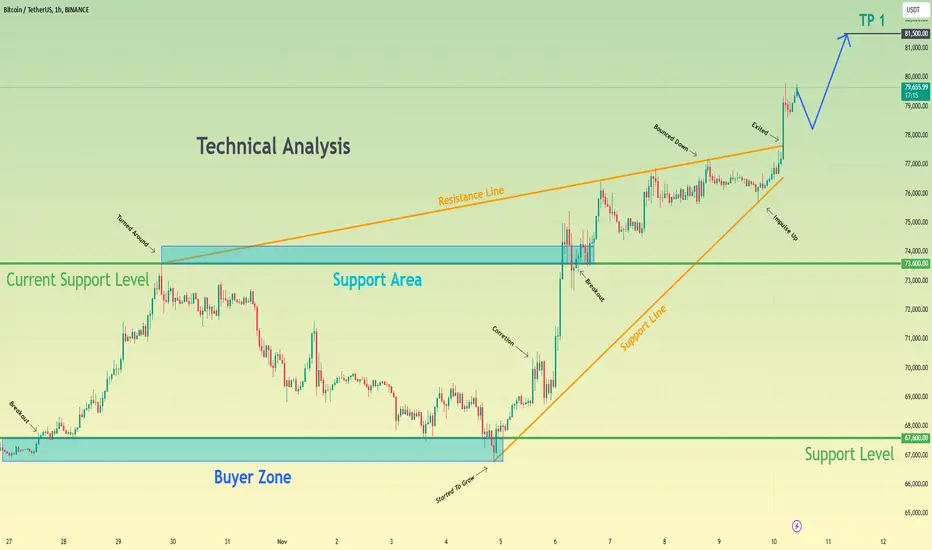
Bitcoin can make correction and then rise to 80K, and even moreHello traders, I want share with you my opinion about Bitcoin. Observing the chart, we can see how the price traded inside the buyer zone and soon broke the 67600 level, after which made a retest and continued to grow. In a short time, BTC rose to current support level, which coincided with the support area, and then started to decline inside the wedge. When the price fell to the 67600 support level, it entered the buyer zone, rebounded from the support line of the wedge, and started to grow. Firstly it corrected and then rebounded up to the current support level. Price broke this level, made a retest, and continued to grow to the resistance line of the wedge. Bitcoin some time traded near this line and later corrected to support line of the wedge pattern, after which it made an upward impulse. After this movement, the price exited from the wedge and now reached a new ATH (79800 points), after which made little correction. Now, it continues to rise, so, in my opinion, the price can make a correction movement and then start to grow. Also, I think it can reach new ATH, so, I set my target at 81500 points. Please share this idea with your friends and click Boost 🚀