FTMUSDT - Inverse Head & Shoulders - A Prime Long Opportunity?1.) Quick Overview
On the FTM/USDT 4-hour chart, an inverse Head & Shoulders pattern is shaping up, often hinting at a bullish reversal. If the pattern completes, this could offer an excellent long setup. The key level to watch is around the mOpen at $0.6555, where the price is expected to dip and complete the “right shoulder,” potentially setting the stage for a strong bounce.
2.) Deep Dive: Chart Analysis
Inverse Head & Shoulders Pattern:
- Left Shoulder: Formed near $0.6342.
- Head: A deeper low at $0.4744, marking the low point of the pattern.
- Right Shoulder (In Progress): Expected to complete around mOpen at $0.6555. If the price touches down here and holds, it could serve as an ideal long entry point.
Fibonacci Retracement:
- The 0.382 Fibonacci retracement level aligns near $0.6555, supporting the right shoulder as a potential bounce zone.
Key Levels to Watch:
- mOpen at $0.6555: This is our primary entry level, where the right shoulder could find support.
- VAL (Volume Area Low) at $0.6324: Another important support zone where the anchored VWAP also aligns, reinforcing this area as a significant base. If the price dips below mOpen, the VAL may act as a secondary support level.
- VAH (Volume Area High) at $0.7262: Our initial target if the inverse Head & Shoulders completes, with potential for further gains.
Volume Profile:
- Increased volume near the head formation suggests accumulation, supporting a bullish scenario if the right shoulder completes as expected.
3.) Trade Setup
- Entry: Look for a long entry around $0.6555.
- Stop Loss: Place the stop loss just below $0.58 to manage risk if the pattern fails.
- Target: Initial target at $0.7262 with room for more upside if the breakout continues.
- Risk-to-Reward: Favorable setup with solid support and a high-probability bounce area.
4.) Final Thoughts
- With the combination of the inverse Head & Shoulders, support at mOpen, Fibonacci, and anchored VWAP at the VAL, this FTM/USDT setup looks promising for a long position. Watch for confirmation around $0.6555 to see if the right shoulder completes.
Disclaimer
This analysis is for educational purposes and should not be taken as financial advice. Always do your own research and manage risk carefully!
Btc-usdt


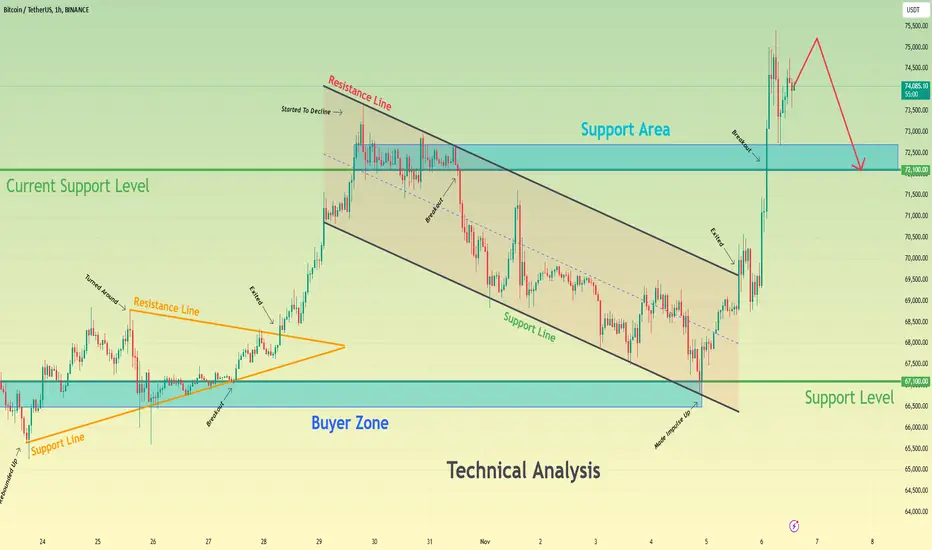
Bitcoin can grow a little more and then make correctionHello traders, I want share with you my opinion about Bitcoin. Looking at the chart, we can see how the price some time ago declined from the buyer zone and entered the wedge. In this pattern, the price rebounded up to the resistance line from the support line, after which made a correction and then in a short time rose back, breaking the 67100 level. Then price exited from the wedge and continued to grow to a current support level, which coincided with the support area and when it reached this level, BTC broke it. Then it little grew and turned around, after which started to decline inside the downward channel, where it broke the 72100 level and fell until to the 67100 support level. After this movement, the price made a strong upward impulse to the current support level, exiting from the channel and soon breaking the 72100 level too. Next, the price made a retest and continued to move up, but a not long time ago it turned around and little declined. For this case, I think that BTC can grow a little more and then make correction to the 72100 current support level. That's why I set my TP at this level. Please share this idea with your friends and click Boost 🚀
Bitcoin can fall little more and then rebound up in channelHello traders, I want share with you my opinion about Bitcoin. By observing the chart, we can see that the price declined to the support level, and soon turned around and started to grow. But soon turned around again and dropped lower 68000 level, breaking it, and started to trades inside range. In the range, the price fell to the bottom part and then in a short time rose to the support level, and even made a fake breakout. After this, BTC fell back to the range, and even declined to bottom par again, where it made impulse up and rose higher than the 68000 level, breaking it, thereby exiting from the range too. Next, the price continued to grow and reached the 71000 level, which coincided with the seller zone and then broke this level. Then the price rose to 73600 points, after which started to decline inside the downward channel. In the channel, the price broke the resistance level and fell to the support line, after which tried to back up, but failed and continued to fall. Recently BTC reached a support level, after which rebounded and has now grown. So, in my opinion, the price can decline a little more and then rebound up to the resistance line of the channel. That's why I set my TP at 70400 points, which coincided with this line. Please share this idea with your friends and click Boost 🚀

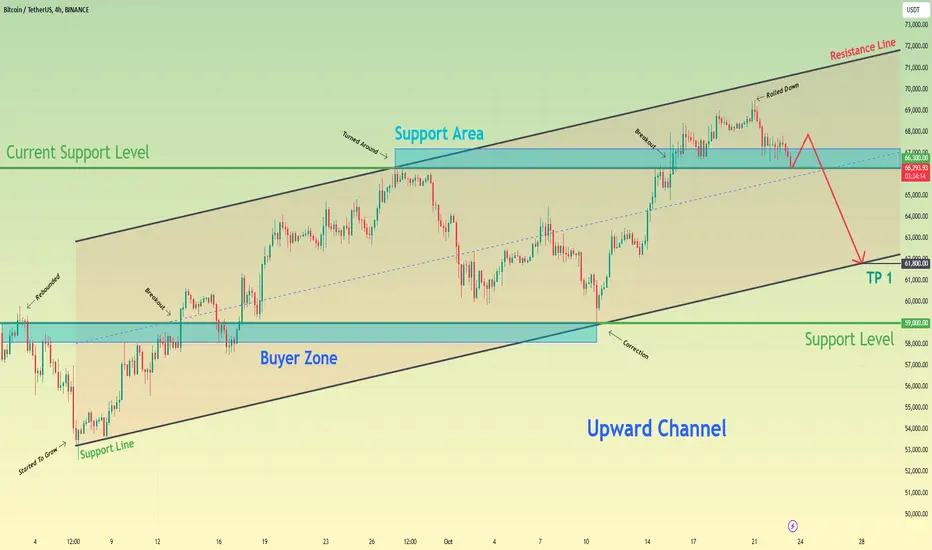
Bitcoin can reach resistance line of channel and start to fallHello traders, I want share with you my opinion about Bitcoin. Observing the chart, we can see how the price some days ago entered an upward channel, where at once it made little correction and then rose to a support level, which coincided with the buyer zone. Then BTC broke this level, after which made a correction to the buyer zone, and then BTC made an impulse up to the resistance line of the upward channel. After this movement, the price turned around from this line and then started to decline to the 58900 support level, which coincided with the support line of the channel. Later BTC rebounded and continued to move up inside the upward channel and some time later reached the current support level, which coincided with the support area. Price rebounded from this level and made a correction below, after which made an upward impulse to the resistance line of the channel, thereby breaking the 69500 level. But a not long time ago it started to decline, therefore I think that BTC can grow to the resistance line and then drop below a current support level, breaking it and continuing to decline. For this case, I set my TP at 67000 points. Please share this idea with your friends and click Boost 🚀

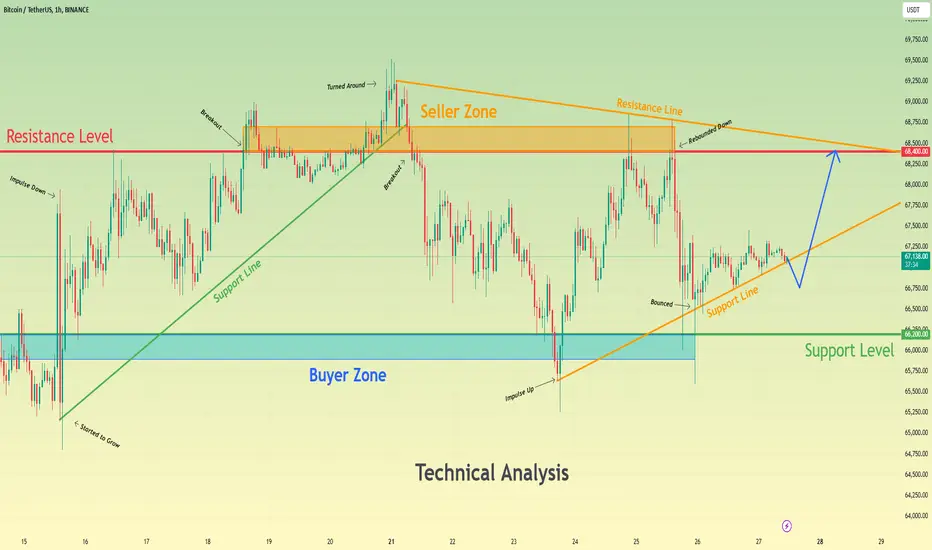
Bitcoin can rebound up from triangle to 68400 resistance levelHello traders, I want share with you my opinion about Bitcoin. Looking at the chart, we can see how the price some time traded near the support level, which coincided with the buyer zone and then broke it, after which it rose to 68K points. After this movement, the price made a downward impulse to support line and then grew. In a short time later it rose to a resistance level, but then corrected almost a support line, after which turned around and continued to grow. Later BTC reached the 68400 level, broke it and even rose higher than the seller zone, but soon fell below. Price some time traded near this level and then rose higher than the seller zone again, after which turned around and started to decline inside the triangle. In this pattern, BTC broke the support level with the resistance level and fell until to the buyer zone and even lower, to the support line of the triangle. After this, the price made impulse up to the 68400 level and then rebounded down to the support line. A not long time ago, BTC bounced from this line and started to grow. So, in my opinion, the price can make a move down, below the support line of the triangle, and then rebound up to the 68400 resistance level, which coincides with my TP. Please share this idea with your friends and click Boost 🚀
Bitcoin can rebound up from pennant to 71K pointsHello traders, I want share with you my opinion about Bitcoin. Observing the chart, we can see that the price rose to the current support level, which coincided with the support zone. After it reached this level, it some time traded near and even entered the support area, but then dropped to the buyer zone. Also, the price started to trades inside the pennant, where later, BTC rebounded from the buyer zone and started to grow. Soon, the price turned around and made a correction movement to support line of the pennant. After this, BTC turned around and made impulse up, making a fake breakout of the 60800 level. In a short time later, the price reached the current support level, broke it, and made a retest. Then it continued to grow until reached the resistance line of the pennant, after which, a not long time ago, it rolled down. So, at the moment, I think that the price can decline to support line and then rebound up, exiting from the pennant pattern. After this, I think BTC can continue to grow, for this case, I set my TP at 71000 points. Please share this idea with your friends and click Boost 🚀

Bitcoin will break support level and continue to fall to 61800Hello traders, I want share with you my opinion about Bitcoin. By observing the chart, we can see that the price some days reached the support level, which coincided with the buyer zone, but at once rebounded and declined a little below. After this movement, the price started to grow inside an upward channel, where it soon reached the 59000 level and broke it. Next, the price made a correction to the buyer zone and then continued to move up to the channel's resistance line, which coincided with the current support level and then turned around. BTC corrected the 59000 level, after which it rebounded and in a short time rose back to the 66300 level and some time traded near. Soon, the price broke this level and rose almost to the channel's resistance line, but recently it turned around and dropped to the support level, which continues to trade very close. In my opinion, the price can make a small move up and then continue to decline to support line of the upward channel, breaking the support level. That's why I set my TP at 61800 points. Please share this idea with your friends and click Boost 🚀
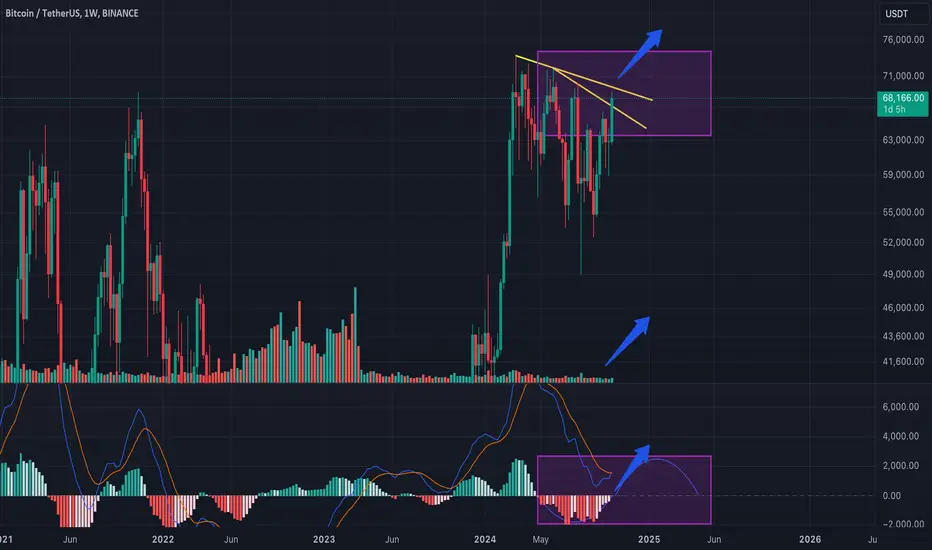
BTC: MACD Signals Aligning for a Potential Buying OpportunityLooking at several factors in parallel, BTC’s MACD is showing promising signs. The fast-moving average has started to curl up, suggesting a possible bullish cross above the slower line—typically a strong buy signal. The histogram has also been in the red for several weeks but is now curling upward, and we could be looking at our first green week.
However, the lack of a significant volume increase means there’s no clear confirmation of a trend reversal just yet, and we aren’t seeing the momentum required for new higher highs or all-time highs. But if these signals continue to align, this could turn into a fantastic buying opportunity.
The question is: will you take buying or selling actions based on these signals?
Harmony one is going up! Technical analysis + trade plan by BFChart Overview
Timeframe: 4-hour (Binance Exchange)
Price as of Analysis: $0.01346
Volume: 3.744 million ONE
Formation: Falling Wedge pattern
Chart Patterns and Indicators:
Falling Wedge:
A falling wedge pattern is typically a bullish reversal pattern, indicating that the current downward trend is weakening and a potential breakout to the upside could follow.
The narrowing of price action shows a decline in both support and resistance levels, with lower highs and lower lows.
The breakout is anticipated above the wedge resistance, potentially marking the beginning of an uptrend.
The VMC Cipher B indicator is similar to the MACD and shows signs of bullish divergence, meaning that while the price has been declining, momentum is building for a potential reversal.
The RSI is hovering around 50.25, which is neutral but can indicate momentum is shifting. If RSI starts increasing above 55, it will confirm bullish momentum.
Stochastic Oscillator is currently at 35.30, this shows the asset is near the oversold zone but still in neutral territory. A move above 40 may confirm a bullish trend reversal.
The HMA histogram shows early signs of turning bullish as the color changes and bars are in the process of shifting positive.
Volume has decreased over the wedge formation, which is typical of such patterns. An increase in volume after the breakout will serve as confirmation for a stronger upward move.
Potential Price Targets:
Immediate Resistance: $0.01360 - This is the wedge resistance. A breakout above this level confirms the pattern.
First Target: $0.01550 - Based on previous price levels, this area is the next resistance once the breakout occurs.
Second Target: $0.01750 - This aligns with the previous significant high and could be a target after the first resistance.
Risk Factors:
Stop-Loss: It’s crucial to place a stop-loss below $0.01200 (below the previous support levels) to manage risk in case of a false breakout.
Volume Confirmation: Ensure that the breakout occurs with significant volume, as low-volume breakouts may lead to a reversal back into the wedge.
Trading Plan
1. Entry:
Enter a long position after a confirmed breakout above the $0.01360 resistance with strong volume confirmation. A 4-hour candle close above this level should confirm the breakout.
2. Stop-Loss:
Place a stop-loss slightly below $0.01200 to manage the downside risk in case the falling wedge pattern fails and the price reverses.
3. Profit Targets:
First Target: Set a take-profit around $0.01550 to capture the first major move after the breakout.
Second Target: For those with a higher risk appetite, target $0.01750, which aligns with the next resistance.
4. Position Size:
Risk only 1-2% of your trading capital on this trade. Given the potential volatility and the falling wedge pattern, it's essential to manage position size conservatively.
5. Monitoring:
Keep an eye on the volume and the RSI/Stochastic Oscillator. If RSI rises above 55 and Stochastic confirms the upward movement, the breakout should gain more strength.
Monitor for any potential fake breakouts. If the price fails to close above the resistance on the 4-hour chart, consider delaying the entry until clear confirmation is given.
The Harmony (ONE/USDT) chart is showing a potentially bullish falling wedge formation, indicating that a reversal from the recent downtrend could occur soon. A breakout above $0.01360 with confirmed volume is crucial for confirming the uptrend. If confirmed, Harmony could target $0.01550 and $0.01750 in the near term, but it's important to employ tight risk management through proper stop-loss placement.

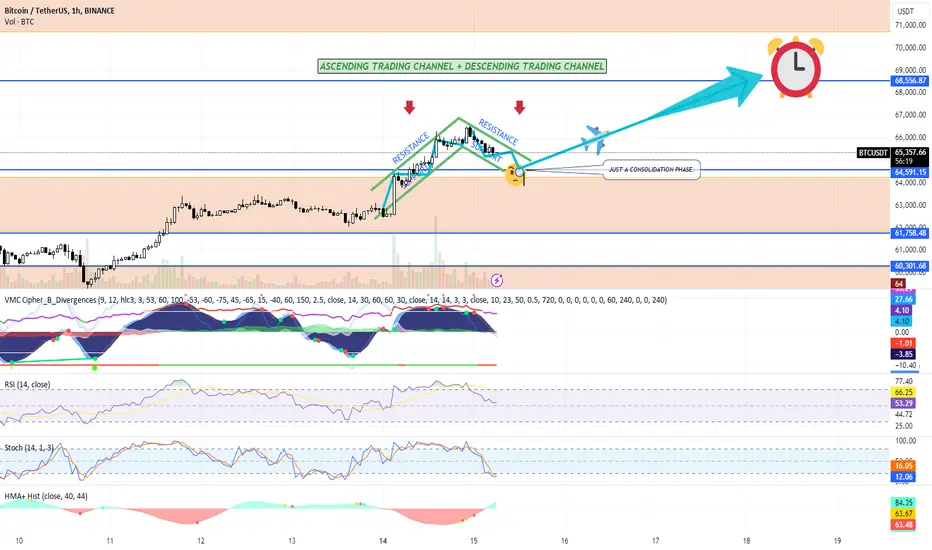
Bitcoin is going up, short consolidation phase TA+TRADE PLANBitcoin's price action against USDT on a 1-hour timeframe with several technical indicators and key levels. Here is my technical analysis + trade plan by Blaž Fabjan
Ascending & Descending Trading Channels:
The price is moving between ascending and descending channels. This can indicate phases of higher highs and higher lows (ascending) followed by lower highs and lower lows (descending), which often signals periods of short-term consolidation or corrections.
Resistance Levels:
Multiple resistances are clearly marked on the chart around the price of $68,556.87 and $67,000. The price has struggled to break above these levels multiple times, making it a critical zone to watch for future price action.
Support Levels:
Support is visible around $61,758.48 and $60,301.68, representing strong areas where the price previously rebounded. These levels are essential for managing downside risk.
Consolidation Phase:
The price appears to be consolidating after rejecting the upper resistance line. This phase suggests market indecision or preparation for a breakout.
VMC Cipher_B Divergences:
Divergences in this indicator show potential weakening of the bullish trend, which could signal a pullback. The green and red dots suggest possible points of reversal, important for catching trend changes.
RSI (Relative Strength Index):
RSI is at 52.96, indicating the market is neutral but slightly leaning toward the bullish side. If RSI breaks above 70, this could signal overbought conditions, while a drop below 30 would indicate oversold.
Stochastic Oscillator:
Currently in the oversold region (18.22), indicating a possible upward reversal soon. This could hint at a short-term bullish move.
HMA (Hull Moving Average) Histogram:
The HMA is showing a mixed trend, but the upward slope hints at mild bullish momentum that needs confirmation from price action or volume spikes.
Trading Plan
Entry Points:
Long Position: Look for a breakout above $67,000 or $68,556.87, especially with strong volume confirming the upward move. You could set a buy stop order slightly above these levels to capture the momentum.
Short Position: If the price rejects resistance and breaks below $64,500 (the recent low), this could indicate a further decline toward support levels around $61,758.48 or lower.
Stop-Loss:
For long trades, place stop-losses just below $64,500 to minimize risk in case of a fake breakout or false bullish signal.
For short trades, place stop-losses above $67,000, as a break above this could invalidate the bearish trend.
Profit Targets:
Upside Targets: First target is around $70,000 (a psychological round number and historical resistance), followed by $71,000.
Downside Targets: The initial target for a short would be $61,758.48. A break below could see prices test $60,301.68, the lower boundary of this channel.
Risk-Reward Ratio:
Ensure that any trade maintains a risk-reward ratio of at least 1:2. For instance, if you risk $1,000, you should aim for a reward of $2,000.
Additional Confirmation:
Wait for additional signals, such as volume spikes or confirmation from indicators like RSI or Stochastic, before entering a position. The market could continue to consolidate before choosing a direction.
Time Horizon:
Given that this is an hourly chart, these trades are more suited for short-term to medium-term traders. Ensure to adjust your stops and targets as the market evolves, and check for any upcoming fundamental events (like economic news or regulatory updates) that could impact Bitcoin's price.
By following this plan, you can manage your trades effectively, balancing risk and reward while being prepared for both bullish and bearish scenarios.
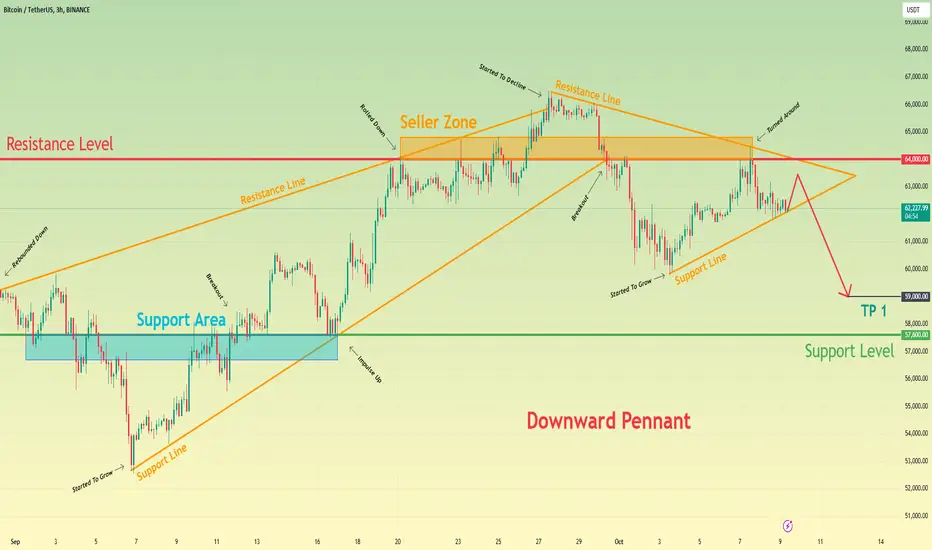
Bitcoin will exit from pennant and continue to fall to 59KHello traders, I want share with you my opinion about Bitcoin. By observing the chart, we can see that the price some days ago entered to wedge, where it at once rebounded from the resistance line and fell to the support line, breaking the support level. After this movement, BTC started to grow and soon reached 57600, which coincided with the support area, broke it, and made a retest. Then it a little, after which made a correction to the support level and then made an impulse up to the resistance line of the wedge, which coincided with the 64000 level with the seller zone. Bitcoin some time traded near this level and later broke it, after which even exited from the wedge, but then it started to decline inside the downward pennant. Later price broke the 64000 level and dropped to the support line of the wedge, turned around and in a short time rose to the resistance level, but a not long time ago it turned around and fell to the support line. Now, the price trades near this line and I think it can rise a little and then continue to decline, thereby exiting from the pennant. For this case, I set my TP at 59000 points. Please share this idea with your friends and click Boost 🚀
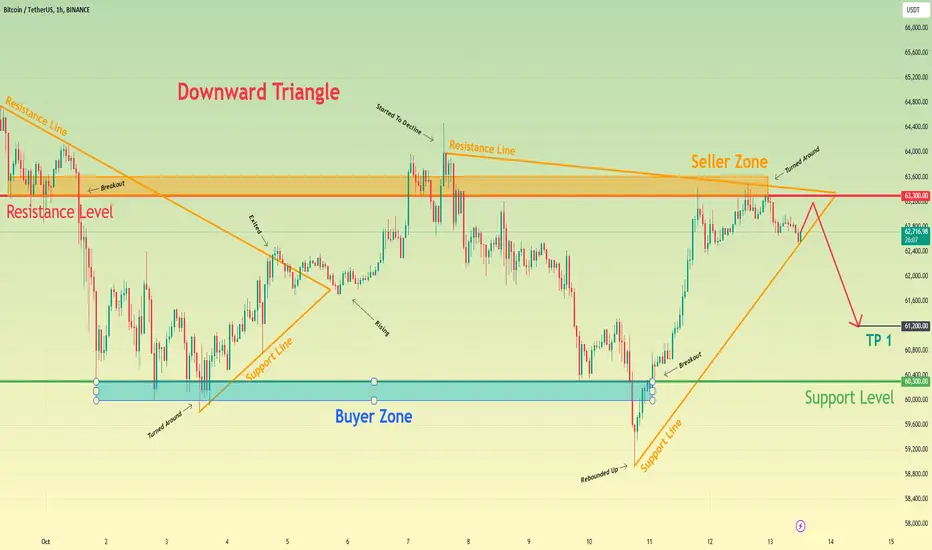
Bitcoin can exit from triangle and continue to declineHello traders, I want share with you my opinion about Bitcoin. Observing the chart, we can see that the price a few moments ago entered a downward pennant, where it soon declined to the resistance level, which coincided with the seller zone and broke it. Then the price dropped to the support level, and even later entered the buyer zone, where it reached the support line and at once turned around and started to grow. In a short time later BTC reached the resistance line of the pennant, exited, and then made the correction. After this, the price rose to the 63300 resistance level, broke it, and even rose higher than the seller zone, but soon turned around and started to decline inside the downward triangle. Price broke the 63300 level and fell to the support level, where some time traded near and later dropped to the support line of the triangle. Soon, BTC turned around and broke the support level one more time and grew to a resistance level, but a not long time ago it turned around and fell to the support line of the triangle. So, in my opinion, BTC can rise a little and then rebound down, thereby exiting from the triangle. Also then it can continue to decline, therefore I set my TP at 61200 points. Please share this idea with your friends and click Boost 🚀
Bitcoin can make small correction and then continue to growHello traders, I want share with you my opinion about Bitcoin. Observing the chart, we can see that the price some time ago entered to upward channel, where it soon reached the resistance level, which coincided with the seller zone, but at once bounced and made a correction to the support line of the channel. Next, the price continued to move up and finally broke the 64900 level, and later reached the channel's resistance line again. But then BTC turned around and started to decline, so, soon, the price broke the resistance level one more time and exited from the upward channel. After this, the price continued to fall inside the downward pennant, where it first fell to the support level, which coincided with the buyer zone. When BTC fell to this level, it at once broke it, some time traded near the buyer zone, and then declined to support line of the pennant. Next, it turned around and rose higher than the 61200 level in a short time, breaking it again, and soon reaching the resistance line of the pennant. A not long time ago, BTC exited from pennant and now it continues to grow. For this case, I think that the price can make a small movement down and then continue to grow to the resistance level. That's why I set my TP at the 64900 level. Please share this idea with your friends and click Boost 🚀

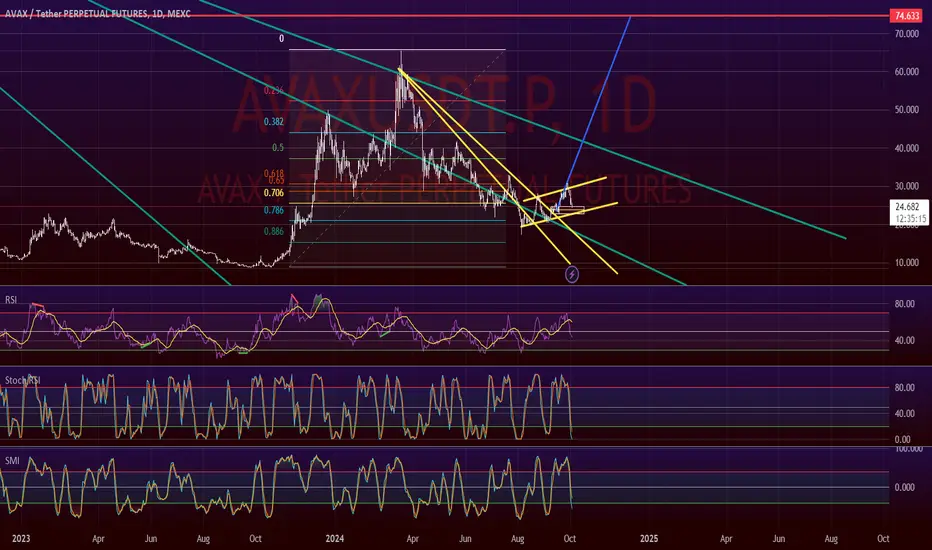
AVAX BULL TO $74It appears that if Bitcoin does not enter a bearish phase, we will experience an altcoin season, presenting optimal long entry opportunities with minimal stop-loss requirements.
Therefore I see AVAX going to $74
Bitcoin can decline a little and then start grow to 64500 levelHello traders, I want share with you my opinion about Bitcoin. Observing the chart, we can see that the price entered to range, where it at once dropped to the support level, which coincided with the buyer zone and then rebounded up. In a short time later, BTC reached a resistance level, which coincided with the seller zone, and then turned around, after which it started to decline. BTC declined to the 57000 support level, and broke it, thereby exiting from range, but soon turned around and started to grow inside the upward channel. Inside the channel, the price reached the 57000 level again, broke it, and continued to move up next. Some time later BTC reached a resistance level, which coincided with the seller zone, broke it, but quickly turned around and dropped, breaking the 64500 level and exiting from the channel also. Now, BTC continues to decline, so, I think that price can fall a little more and then start to grow to a resistance level. For this case, I set my TP at a 64500 resistance level. Please share this idea with your friends and click Boost 🚀

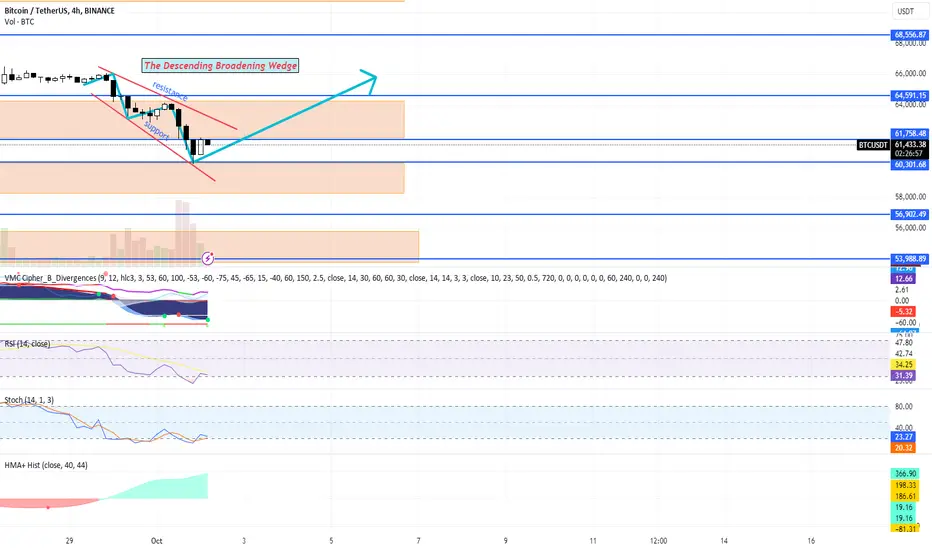
Bitcoin (BTC/USDT) 4h timeframe TA+Trade plan by BFDescending Broadening Wedge
Pattern Description: This is a bullish reversal pattern. As shown, the price of Bitcoin is testing the support line of the wedge, which typically suggests that a breakout to the upside might occur after the completion of the pattern.
Potential Breakout: The chart indicates a potential breakout above the upper boundary (resistance line) of the wedge, possibly signaling the beginning of an upward move.
Key Support and Resistance Levels
Support Levels:
60,301.68 USDT: This is a near-term support zone where price could find buyers if it revisits these levels.
53,988.89 USDT: A deeper support level shown on the chart, which might come into play if Bitcoin faces a significant sell-off.
Resistance Levels:
64,591.15 USDT: A strong resistance zone that Bitcoin would need to surpass for a sustained upward move.
68,556.87 USDT: A higher resistance level that could become the target in the case of a breakout.
Indicators Analysis
VMC Cipher B Divergences: It appears to show divergence. A green dot below indicates potential bullish divergence, suggesting price may increase soon.
RSI (Relative Strength Index): The RSI is at 31.48, which indicates oversold conditions. This level usually implies that the asset is undervalued, signaling a potential buying opportunity.
Stochastic Oscillator: The stochastic reading is at 23.61 (blue line) and 20.43 (red line), indicating oversold conditions as well. This adds further strength to the bullish argument, aligning with the RSI's signals.
HMA (Hull Moving Average): The HMA histogram shows green bars, suggesting a bullish trend might be forming or momentum is starting to shift to the upside.
Trading Plan
Long Position Setup
Entry:
A breakout above the resistance line of the descending broadening wedge would be the ideal entry signal. You may consider entering around 61,750–62,000 USDT.
Take Profit:
First take-profit target could be around 64,591 USDT (resistance zone).
If momentum is strong, a secondary target can be set around 68,556 USDT.
Stop Loss:
Place a stop loss just below the recent low at 60,000 USDT, as a break below this level would invalidate the bullish wedge pattern and signal further downside.
Alternative (Cautious) Approach
Wait for confirmation of a breakout with a strong candle close above the wedge's resistance line, paired with bullish indicators on lower timeframes (e.g., 1-hour chart).
Risk Management:
Risk no more than 1-2% of your portfolio on this trade, adjusting position size accordingly.
Final Considerations
Monitor for any false breakouts as Bitcoin could retest the wedge's resistance line before confirming the breakout.
Keep an eye on volume; a breakout with strong volume increases the likelihood of the wedge pattern playing out successfully.
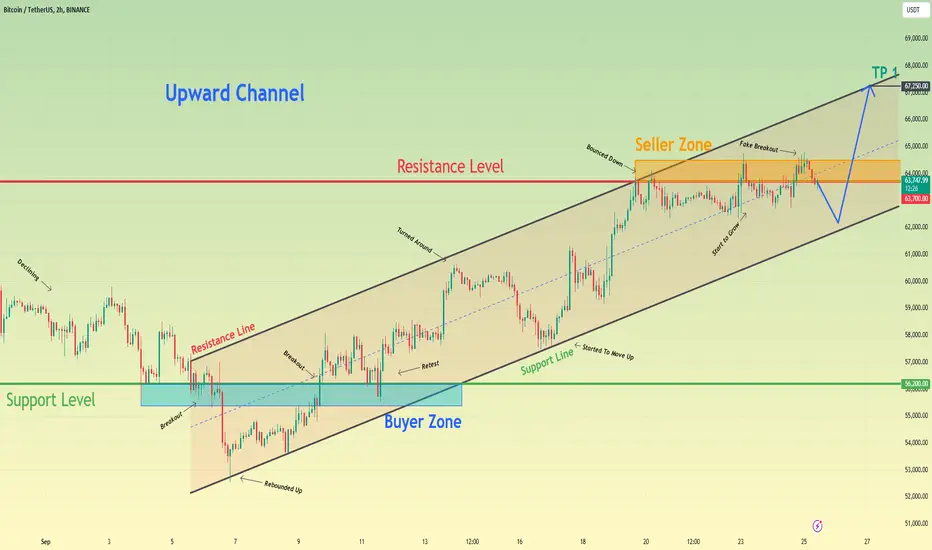
Bitcoin can make small correction and then start to move upHello traders, I want share with you my opinion about Bitcoin. Looking at the chart, we can see how the price some time ago declined to the support level, which coincided with the buyer zone and even soon broke this level. After this, price declined a little more and then moved up inside the upward channel. In a short time, BTC broke the 56200 level again and then made a retest. After this movement, BTC rose a little more and even almost reached the resistance line of the channel, after which it turned around and declined to support line of the channel. Some time later Bitcoin rebounded from this line to the resistance line, which coincided with the resistance level with the seller zone, and tired to break it, but failed. Later, the price some time traded near this level, and a not long time ago made a fake breakout of the 63700 resistance level. Now BTC trades very close to this level, therefore I think that the price can correct almost to the support line and then start to grow to the resistance line of the upward channel, thereby breaking the resistance level. For this case, I set my TP at 67250 points, which coincides with the resistance line. Please share this idea with your friends and click Boost 🚀
Rule of 160: History Predicts Start Of Bull-Run This Week!In this analysis I want to take a closer look at previous bull-cycles and Bitcoin's behaviour in the months following the halving.
The vertical yellow line is the date of the halving. The purple rectangle is the price action of the 160 days following the halving.
We can very clearly see a few interesting similarities between the last three cycles:
- The price pumps prior to the halving.
- The price trades sideways for 160 days after the halving.
- The "real" bull-run starts after the sideways price action has ended.
If we follow the Rule of 160, the start of the next big bull-run would be somewhere around 27 september, which is this week!
I'm aware that market conditions are different now than they were back then. Still, BTC is a very cyclical asset and has historically followed calendar based trends.
There's data to suggest that we have to come down (check my previous posts), but there's also data like this that suggests that the price will increase.
Time will tell. Interested to hear your opinions!

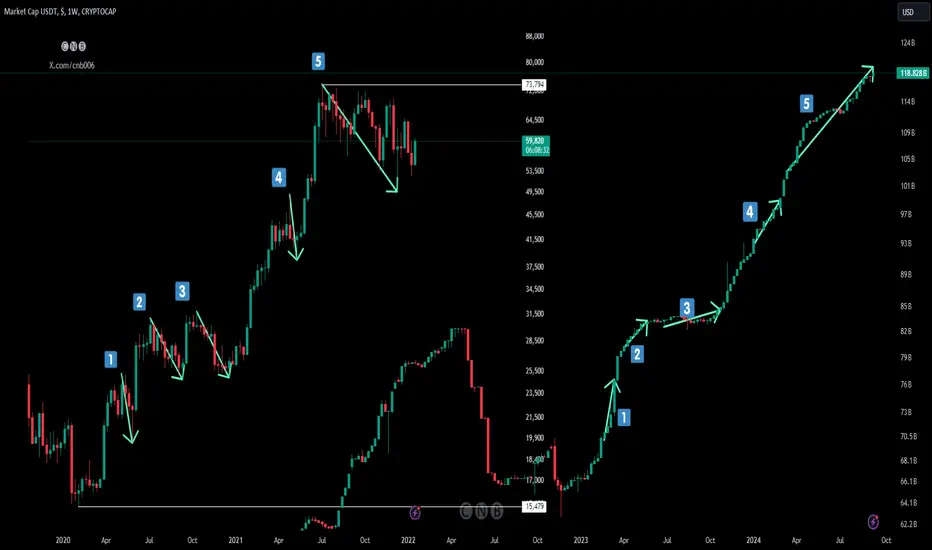
USDT Market cap & Bitcoin Price Update"$15k to $74k"...In this bitcoin rally, market dumped total 5 times 📉
But every time the CRYPTOCAP:USDT market cap is just going UP📈 Whales are pumping market by buying every dip🚀
After touching $74K, btc price dumped -32% but USDT Market cap pumped almost +16%
It indicates that usdt is printed daily to buy the dips!
pbs.twimg.com
_
2017 : USDT MCAP 1.4B - BTC ATH 20K
2021 : USDT MCAP 82B - BTC ATH 69K
2024 : USDT MCAP is now 118B - BTC Price is $60K
USDT pumped +44% but btc still below previous ATH
The Bull Run is not over!
pbs.twimg.com
Please hit the LIKE button to support my work and share your thoughts in the comment section.
Thanks
cnb006
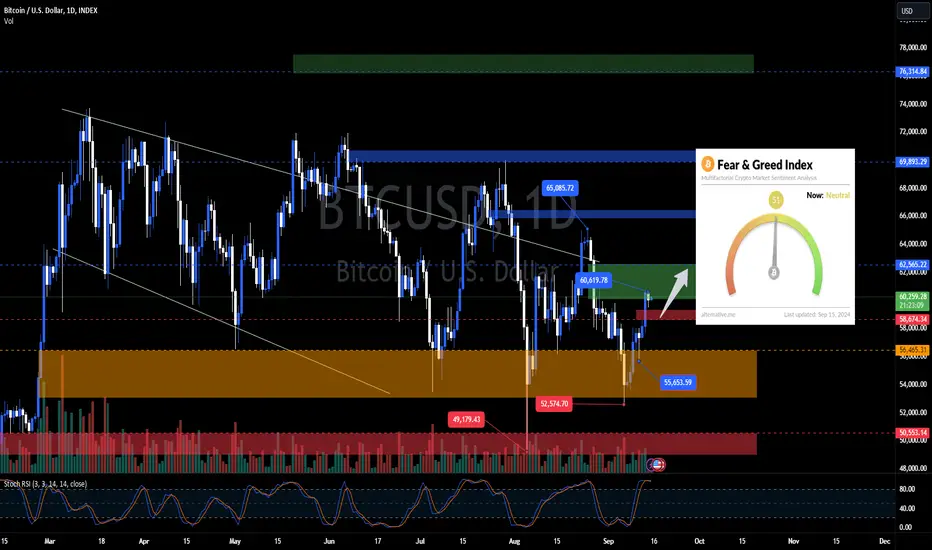
BTC Correction to 59K – Next 61K?GM crypto bro's, happy weekend! This morning, the Fear and Greed Index remains neutral at 51. BTC made a slight correction last night to the 59K area. The next big possibility is still 61K - 62K.
Today's market update is mostly the same as yesterday. As always, the market is dynamic; don’t be FOMO. Stay safe, keep calm, and remember anything can happen in the crypto market. Always manage your risk. That’s all for today’s crypto update—this is Akki signing off with one chart. Have a nice day!
BTC Eyes 55K, Red Zone in Sight?GM crypto bro's, it seems the happy weekend is still far away 🗿 with BTC still at risk of another drop. This morning, the Fear and Greed Index is at 29 (Fear), finally moving up a bit after two days in Extreme Fear territory. The Stochastic RSI remains in the oversold area, but a slight uptick might begin tomorrow.
From a price action perspective, BTC might test the nearest level at 55K. However, if it fails to break through, there’s a high chance of a deeper drop. The closest possible red zone is 50K - 48K, and if that breaks too, next station: BTC 44K 💀.
Always hope for the best but prepare for the worst. Let's hope BTC doesn’t dump to 44K 🗿. As always, maintain your risk. That's it for today's crypto update. This is Akki, signing off with one chart. Have a nice day!

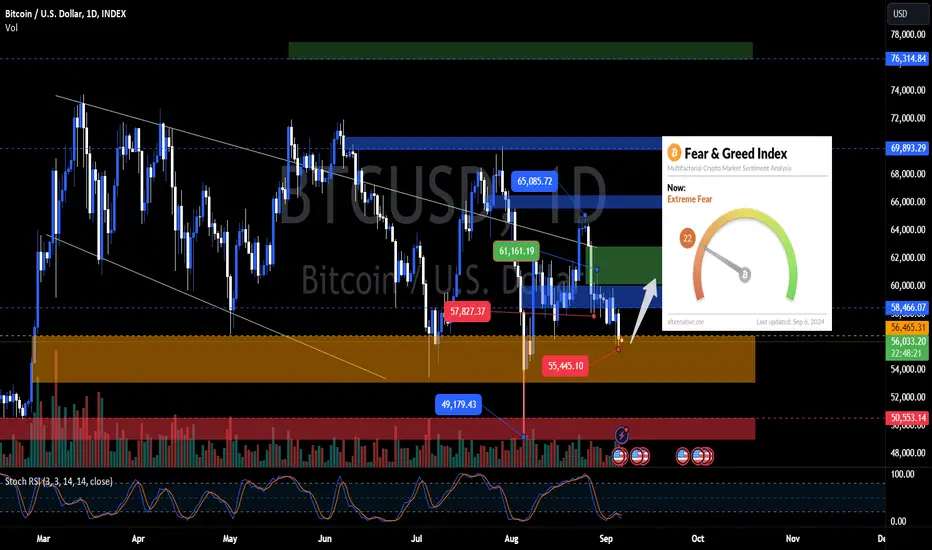
BTC Dumps to 56K - Extreme Fear in the Market!GM crypto bro's! This morning, BTC has dumped again to 56K. The Fear and Greed Index is in the extreme fear zone at 22, and it looks like the Stochastic RSI won't be leaving the oversold area anytime soon.
That's why I always remind you to stay cautious in this highly volatile crypto market, because anything can happen. Based on the current price action, the probability of dropping below 54K seems low, as mentioned in the market update on 02/09/2024.
But remember, this is just my personal analysis and only a probability. As always, maintain your risk management, and that's all for today's crypto update. This is Akki, signing off with one chart. Have a nice day!