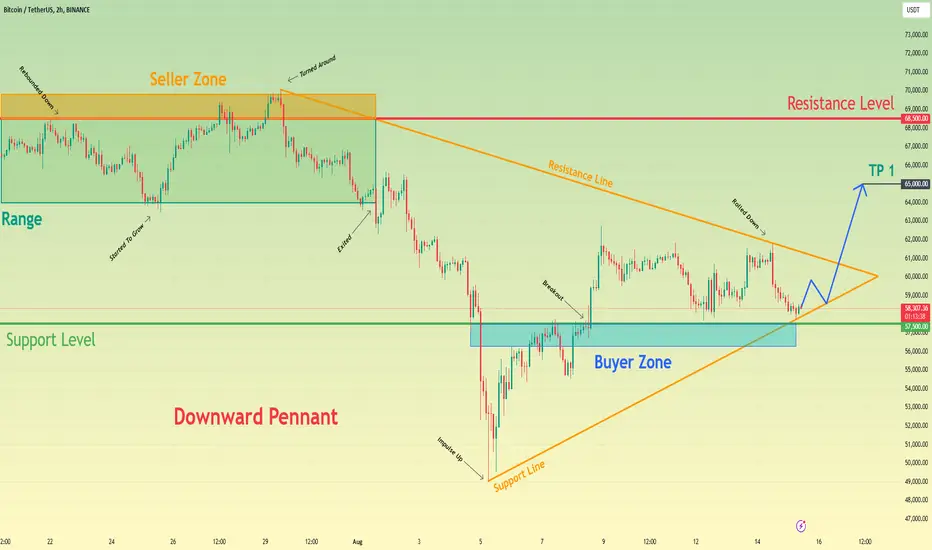
Bitcoin can little fall and then continue grow to 64700 pointsHello traders, I want share with you my opinion about Bitcoin. Observing the chart, we can see that the price some time ago declined to the resistance level, which coincided with the seller zone. After this price started to grow and soon rose from the seller zone to 70100 points, but at once turned around and started to decline inside the pennant. Inside the pennant, BTC broke the 64700 level and fell to the support level, which coincided with the buyer zone and also soon broke this level too. Next, the price reached the support line of the pennant and at once rebounded and in a short time rose to the resistance line of the pennant, breaking the 56600 level one more time. Later, BTC exited from the pennant and started to trades in range, where it rose a little more and then made a correction movement until to bottom part, which coincided with the support level. After this movement, Bitcoin rebounded and rose to the top part, after which some time traded near and a not long time ago dropped to 58000 points. Then it started to grow, and I think BTC can decline a little and then continue to move up. For this case, I set my TP at a 64700 resistance level, which coincided with the top part of the range. Please share this idea with your friends and click Boost 🚀
Btc-usdt

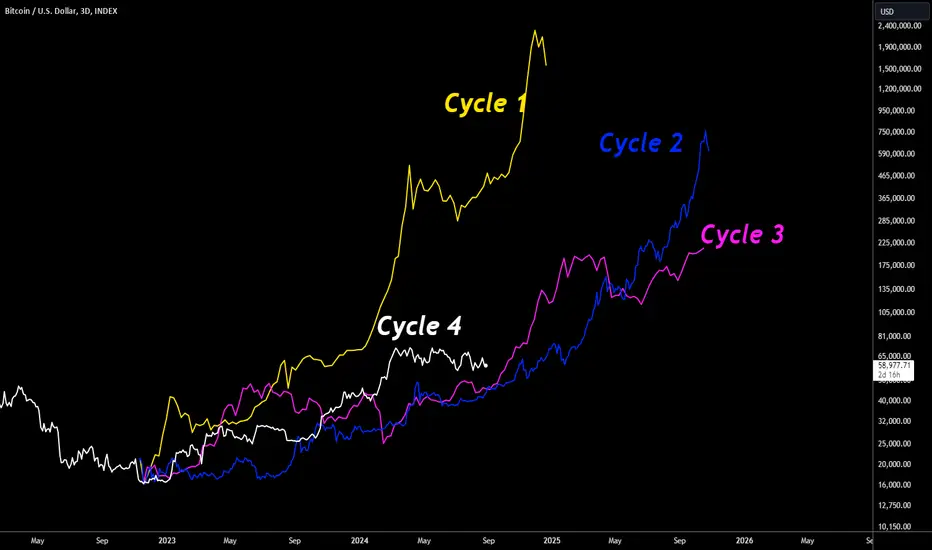
Bitcoin Is Perfectly On Track This CycleIn this analysis I want to take a closer look at Bitcoin's current bull-cycle and compare it with the previous cycles. I count from December 2011 onwards.
As seen on the chart, the first cycle (yellow) is an outlier in both duration and growth. We will likely never experience something like that again.
The most interesting cycles to compare the current cycle to ar the second (blue) and the third (purple).
As Bitcoin matures as an asser, it will likely experience diminishing returns. In other words; lower total gains from bear bottom to bull top.
However, cycle 4 is outperforming both previous cycles at their respective times. The most logical explanation would be that we had the BTC Spot ETF this year, which caused massive bullish pressure from institutional investors. Chances are that we have to endure a couple more neutral/bearish months in order to get below the blue and purple lines before we can see any substantial growth to >100k.
All in all, this cycle is on track with the previous cycles. If it were to follow the last two, we can expect BTC to top somewhere in the last quarter of 2025.
Happy to hear your thoughts!
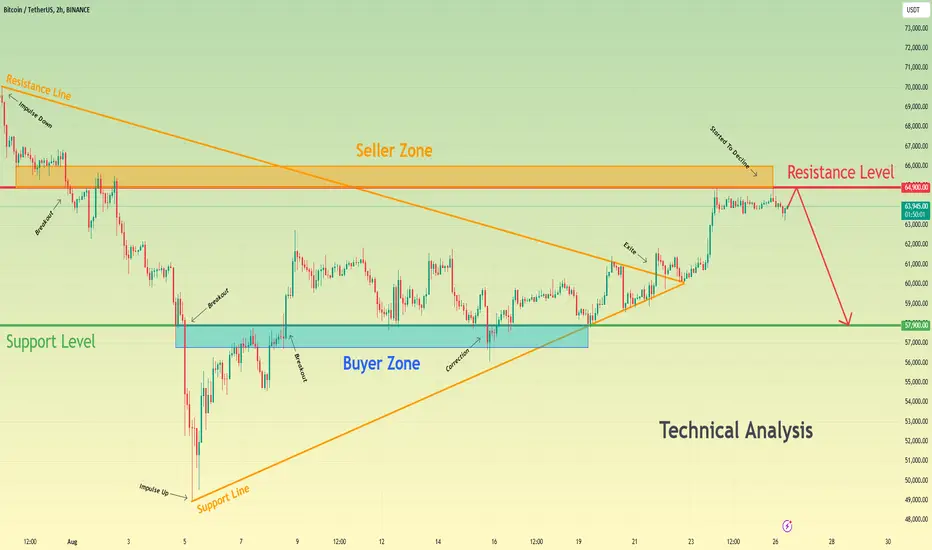
Bitcoin can rebound from resistance level and start to declineHello traders, I want share with you my opinion about Bitcoin. Looking at the chart, we can see how the price some time ago entered to triangle, where at once made an impulse down from the resistance line to the support line, breaking the 64900 and 57900 levels. After this, the price turned around and repeated impulse up to the support level, which coincided with the buyer zone and broke this level again. Next, BTC rose a little more, after which some time traded near and later made a correction to the 57900 level. Then the price bounced and rose to the resistance line of the triangle, some time trading near and later exiting from this pattern. After this movement, Bitcoin continued to move up to the resistance level, and when it reached it, price little time traded near and not long time ago started to decline. In my opinion, BTC can reach a resistance level again and then start to decline to the 57900 support level. For this case, my TP is at this level. Please share this idea with your friends and click Boost 🚀
Bitcoin can exit from triangle and continue rise to 65600 levelHello traders, I want share with you my opinion about Bitcoin. Observing the chart, we can see that the price some days ago started to grow inside the upward channel, where it soon reached a resistance level, which coincided with the seller zone. Later price broke the 65600 level and rose to the resistance line of the channel, after which rebounded and made a correction to the support line of the channel. Next, the price rose back, but soon turned around and entered to triangle, where it in a short time declined from the resistance line to the support line, thereby breaking the 65600 and 57500 levels and exiting from the upward channel. Then Bitcoin turned around and made impulse up from the support line, breaking the 57500 support level, which coincided with the buyer zone, and then made a retest. Also later, the price declined to almost the support line of the triangle, after which bounced and at the moment trades very close to the resistance line of the triangle. In my opinion, BTC can little correct to support line and then rebound up, thereby exiting from the triangle pattern. After this, price will continue to move up to the 65600 resistance level, so, that's why this level is my TP. Please share this idea with your friends and click Boost 🚀

BTC - Long Trade IdeaBTC looks prime to continue up to take out the plethora of BSL above it's ATH after recently trading into a 3-month BISI.
On the lower timeframes, my POI for an entry with the current candles is the 2-day iFVG. On the hourly timeframe, the 4-hour gap within that POI would be interesting to monitor.
My stop is below a reasonable swing point that should not be traded into unless a large liquidation is on the cards, but the bodies should respect that I have outlined.
My first target is ATH, after that it is completely discretionary as there is nothing on the left side of the chart. For prediction's sake, I am anticipating 100k to be the next milestone for Bitcoin.
- R2F

Bitcoin can start to decline from resistance level to 56KHello traders, I want share with you my opinion about Bitcoin. By observing the chart, we can see that the price some time ago rebounded from the support line and reached the support level, which coincided with the buyer zone. Soon, BTC broke this level, but then it made correction to the support line, after which turned around and bounced up until to the 61000 resistance level. When Bitcoin reached this level, it broke it and entered to seller zone, but soon turned around and started to decline inside the downward channel. In the channel, the price broke the support line and fell a little below the 61000 level. Later it turned around and in a short time rose back to the seller zone, after which turned around and bounced down to the support line of the channel, which coincided with the 56000 level also. Recently price started to grow and now continues to grow to a resistance level. For this case, I think that BTC can reach a resistance level and then drop to a support level inside the downward channel. So, that's why my TP is a 56000 level. Please share this idea with your friends and click Boost 🚀

#BTC/USDT
#BTC
#BITCOIN
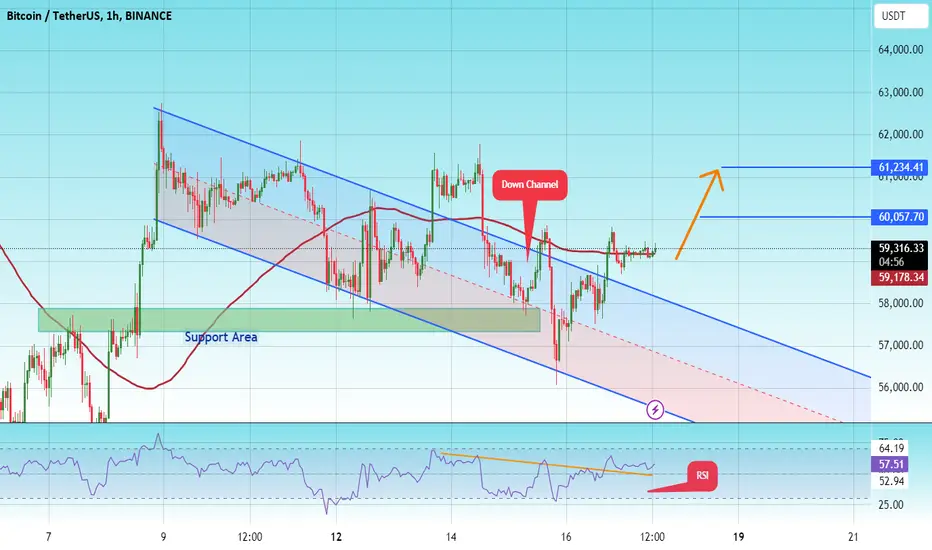
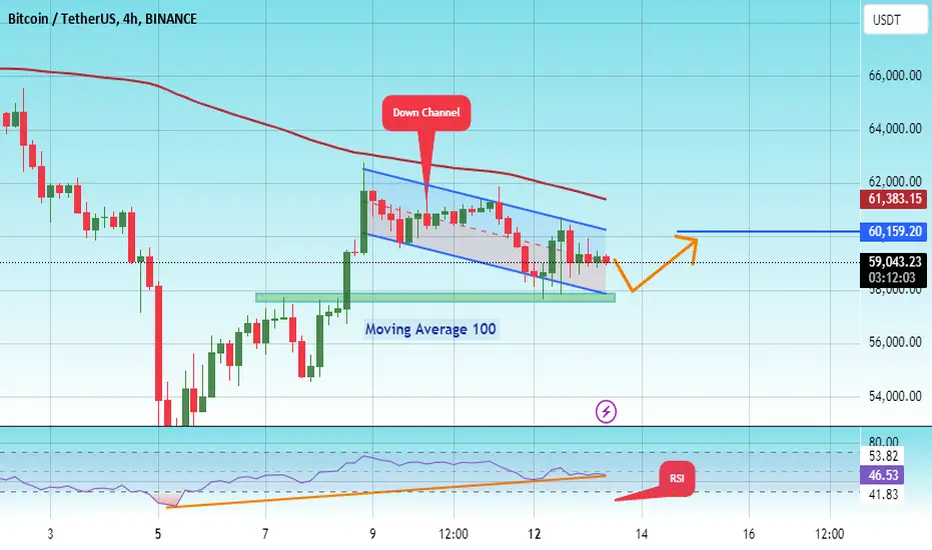
The price is moving in a descending channel on the 1-hour frame and is adhering to its borders well. The price reached the upper limit of the channel and closed above it, which supports the rise.
The price also touched the 100 moving average and is expected to rebound from it.
The price is now at $59,200, which is the entry price.
The first target is $60,000.
The second target is $61,200.
We have a downtrend on the RSI, but from
BTC/USDT targeting 68KBINANCE:BTCUSDT targeting 68K.
Bitcoin's correction is going by trendline, it looks it is going to hit 68K once again.

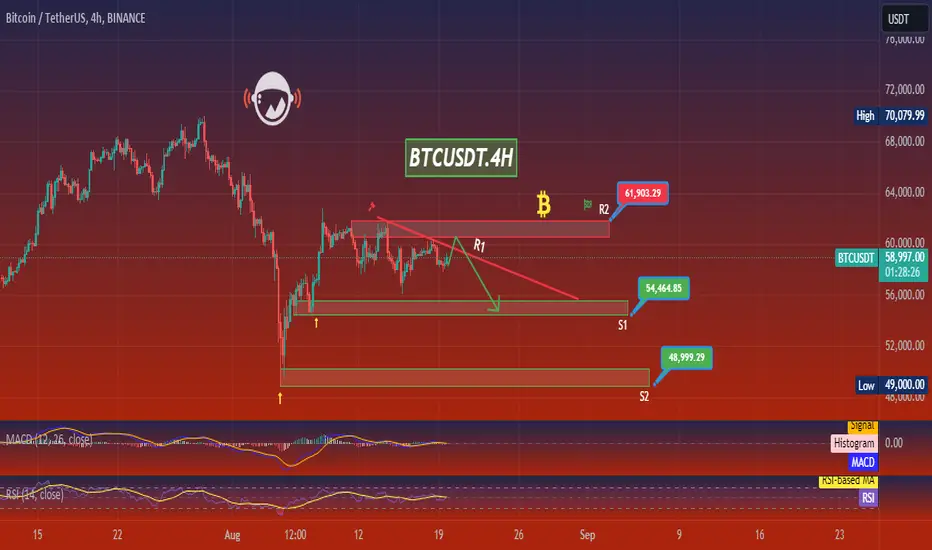
BTCUSDT.4HReviewing the BTC/USDT chart on a 4-hour timeframe, it is evident that Bitcoin has encountered significant volatility with a recent downtrend in play. This analysis will focus on the current technical configurations and their potential implications.
Key Observations:
Price Movement: Bitcoin has been experiencing a series of lower highs and lower lows, a bearish signal within the observed timeframe. The current price is near a crucial resistance level (R1) at approximately $54,464.85.
Resistance and Support Levels:
Resistance Levels (R1 and R2): R1 is currently being tested. A break above this could lead to a test of R2 at $61,903.29.
Support Levels (S1 and S2): S1 at $48,999.29 and S2 at around $44,000 offer critical cushions where buyers might step in if the price retraces further.
MACD Indicator: The MACD line is below the signal line but is showing signs of convergence, suggesting a potential weakening in bearish momentum. However, it remains below zero, indicating that the bearish trend is not entirely reversed.
RSI Indicator: The Relative Strength Index is hovering around 50, indicating a neutral position. This suggests that the market is neither oversold nor overbought, providing no strong momentum cues in either direction.
Technical Analysis and Conclusion:
The market is at a crossroads with Bitcoin testing the resistance at R1. A successful break above this level could indicate a short-term bullish reversal, potentially driving the price towards R2. However, the overall market structure still leans bearish given the recent trends.
Traders should watch for either a confirmed breakout above R1, which could be seen as a buying opportunity towards R2, or a rejection at this level, which may lead to a pullback towards S1 or even S2.
Trading Strategy:
Bullish Scenario: If BTC breaks above R1 with significant volume, consider entering a long position with a target at R2. Set a stop-loss just below R1 to minimize potential losses from a false breakout.
Bearish Scenario: Should BTC fail to sustain a break above R1 and shows signs of weakness, a short position could be considered, targeting S1. Placing a stop-loss just above R1 could be prudent to limit downside risk.
In either case, it is essential to monitor market news and global economic indicators closely, as external factors can heavily influence Bitcoin's price movements. Adjust trading strategies dynamically to accommodate changes in market conditions.
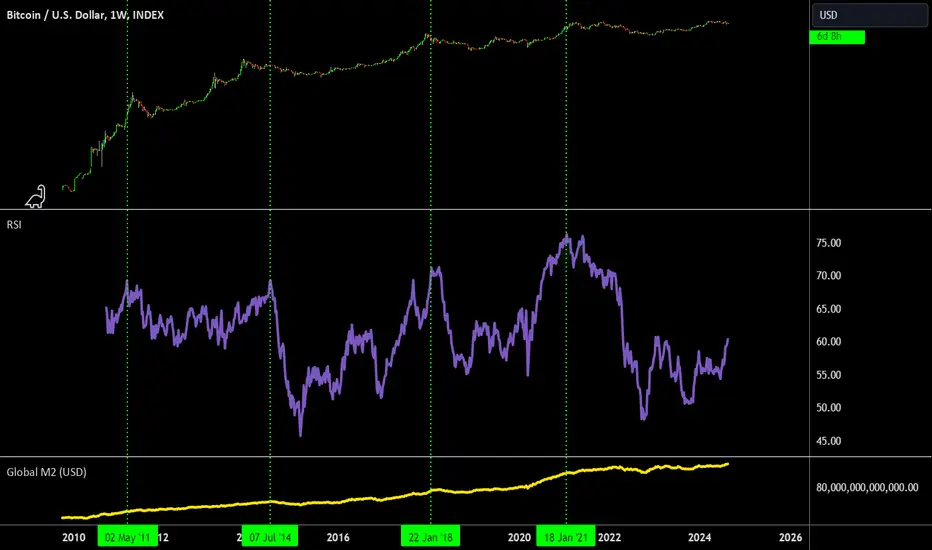
The REAL Bull-Market Has Yet To Come: Here's Proof!In this analysis I want to talk about the M2 Global Money Supply indicator. This indicator basically shows how much money there is in circulation and how much is being printed.
The indicator itself is not that usefull since it's just going up (more money is printed over time). However, the rate at which money is printed is more interesting, hence I slapped an RSI indicator on top of it.
As seen on the chart, the RSI of the Global M2 shows that Bitcoin tops around the time that the RSI tops. It's not accurate enough for day-trading, but at least useful for to detect long-term moves.
The RSI of the Global M2 has always topped around the 70-75 points. It's currently sitting at 60.3, so there's quite some room left to grow (last time it took almost a year to go from 60 >75).
Furthermore, we can see that the "real" bull-market or Hype Phase starts once the RSI is above 65 and continues to climb.
In short, the "real" bull-market has not started yet and BTC has much more room to grow over the next 1-2 years.
Happy to hear your thoughts on this analysis.
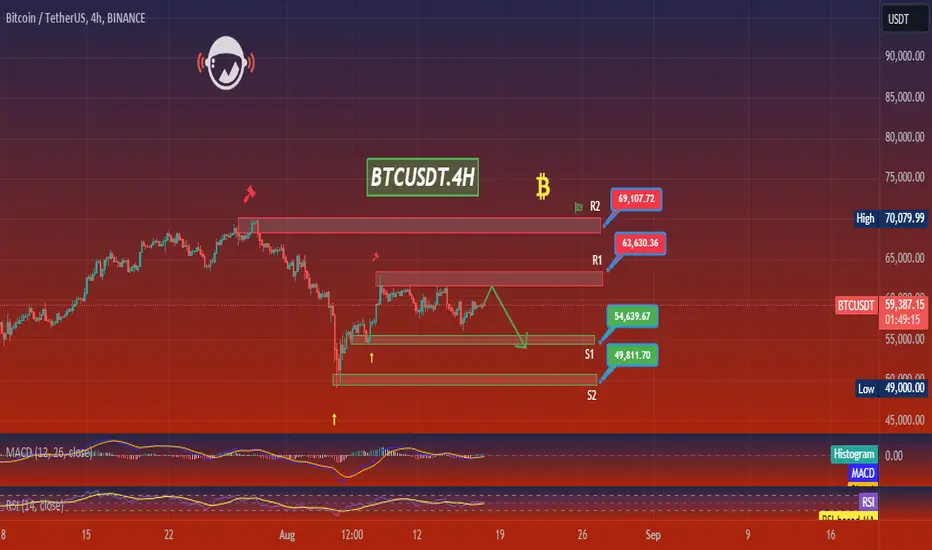
BTCUSDT.4HThe chart you've shared for BTC/USDT on the 4-hour timeframe provides a detailed view of Bitcoin's price movement, resistance, and support levels, along with technical indicators such as the MACD and RSI. Here's an analysis based on the information from the chart:
Current Situation
Price Level: As of the latest data point, Bitcoin is trading at $59,578.58.
Recent Price Action: The chart shows Bitcoin experiencing a significant drop followed by a recovery phase where it's currently consolidating.
Support and Resistance Levels
Resistance Levels (R1 and R2):
R1: $63,630.36
R2: $69,107.72
Support Levels (S1 and S2):
S1: $54,639.67
S2: $49,811.70
Technical Indicators
MACD: The MACD line is below the signal line but appears to be converging, suggesting a potential bullish crossover might occur if buying momentum increases.
RSI: The Relative Strength Index is currently at 48.06, indicating neither overbought nor oversold conditions, supporting a potential for either direction in the short term.
Analysis and Conclusion
From my analysis, Bitcoin is currently in a phase of consolidation within a defined range between the nearest support and resistance levels. The indicators suggest a neutral to slightly bullish outlook in the near term, pending further signals from the MACD and RSI.
Trading Strategy
Bullish Scenario: If Bitcoin breaks above the resistance at $63,630.36 with significant volume, it could signal further upside towards the next resistance at $69,107.72.
Bearish Scenario: A break below the support level at $54,639.67 could lead to a test of the lower support at $49,811.70, indicating a continuation of the bearish trend.
Final Thoughts
As a trader, it's crucial to monitor these levels and indicators closely while also being prepared for any sudden market movements caused by external factors. Setting appropriate stop-losses and taking profit levels according to one's risk tolerance and trading strategy is recommended.
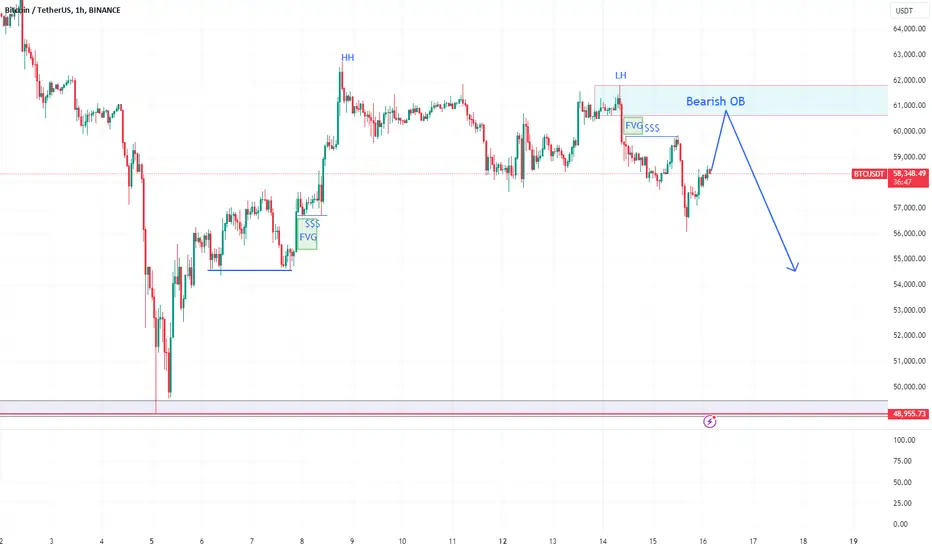
Looking for Sell BTC around 60600(8/16/2024)Bearish Shadow is still chasing BTC. After a good retracement from the 49-50k zone, BTC faced some selling pressure around the 62700$. The pressure finally pushed the price to 56.1k $ yesterday. right now price action is showing us HH and LH and, we can see Liquidity above the 59800$ and FVG above it.
We believe the price will eventually reach the zones as mentioned earlier, then we are looking for a bearish setup around 60600$(this is important!) .
Our technical view has been shown in the chart.
If you like it then Support us by Like, Following, and Sharing.
Thanks For Reading
Team Fortuna
-RC
(Disclaimer: Published ideas and other Contents on this page are for educational purposes and do not include a financial recommendation. Trading is Risky, so before any action do your research.)
Bitcoin can rebound up from support line of pennant to 65K pointHello traders, I want share with you my opinion about Bitcoin. Looking at the chart, we can see how the price some time ago entered to range, where it at once reached a resistance level, which coincided with the seller zone and then rebounded down to the bottom part of range. After this movement, the price in a short time rose until to top part of the range, but soon turned around and started to decline inside the downward pennant. Later BTC quickly declined until to support level, which coincided with the buyer zone, thereby breaking the 68500 level and also exiting from range. Soon, the price broke the 57500 level too and dropped to the support line of the pennant, after which at once made a strong impulse up. After this movement, BTC broke the support level one more time and some time traded near this level. Next, it reached the resistance line of the pennant pattern, but not a long time ago fell back. At the moment, it trades near the support line of the pennant and I think that the price can make a small movement up first and then correct to the support line again. Next, Bitcoin will rebound up from this line, exit from the pennant, and continue to grow, therefore I set my TP at 65000 points. Please share this idea with your friends and click Boost 🚀
#BTC/USDT#BTC
#BITCION
The price is moving in a descending channel on the 4-hour frame and is adhering to its limits well
The current price is $59,102. It is expected to fall to touch the lower limit of the channel at $57,700, which is the entry price
There is a strong support point at this level, green
Targeting the upper limit of the channel at $60,000
This boot supports the lower limit as we are still below the moving average 100
But what supports the rise after touching the lower limit is the presence of an upward trend on the RSI
Bitcoin can drop to support level, exiting from pennantHello traders, I want share with you my opinion about Bitcoin. By observing the chart, we can see that the price some days ago rose in an upward channel, where it reached the support level, which coincided with the buyer zone and soon broke this level. Then BTC made a retest and at once rebounded up until to resistance line of the channel, which coincided with the resistance level with the seller zone. After this movement, the price made a little correction, after which broke the 65600 level, and some time traded near, and even made a fake breakout. Next, the price rose to 70000 points and started to decline inside the downward pennant, where it soon broke the resistance level, thereby exiting from the upward channel also. After this, BTC dropped until to support line of the pennant, breaking the 57100 level, but at once turned around and in a short time rose higher this level, breaking it one more time and reaching the resistance line of the pennant pattern. At the moment, the price trades near this line and I think Bitcoin can make movement up, thereby exiting from the pennant and then will fall to the 57100 support level, therefore I set my TP for this level. Please share this idea with your friends and click Boost 🚀

BTCUSDT.4HToday, I’m examining the 4-hour chart of Bitcoin (BTC) against USDT on the Binance exchange. BTC is currently trading around $60,155.49, showing a marginal increase of $28.20 in the recent 4-hour period.
Key Resistance and Support Levels:
The chart illustrates a significant resistance at R1 ($69,107.72), a level that has not been breached recently, suggesting strong selling pressure beyond this point. On the downside, the main support level (S2) is positioned at $49,811.70. There is also an intermediate support level (S1) marked, which could provide temporary relief or halt further declines if tested.
Technical Indicators Analysis:
• MACD: The MACD line is close to the signal line but remains below it, indicating slight bearish momentum. However, the histogram is almost flat, suggesting a lack of strong momentum in either direction.
• RSI: The Relative Strength Index is at 57.57, which is near the neutral 50 mark. This suggests a balance between buying and selling pressures, with a slight tilt towards buying interest.
Analysis:
BTC’s current position near the middle of its recent range suggests a consolidation phase. The proximity to significant support and resistance levels, coupled with neutral indicators, implies uncertainty in the immediate direction. The market could be waiting for more decisive signals or external factors before making a significant move.
Conclusion and Trading Strategy:
Given the current setup, my strategy would be one of caution and readiness to act on clear signals. The approach would involve monitoring BTC closely for any significant changes in volume or sentiment that might push it towards testing the resistance at R1 or falling back to the support at S2. A breakout above R1 could signal a bullish trend continuation, potentially making a good buying opportunity, while a drop below S2 might suggest entering a short position or selling existing holdings. Setting stop-loss orders just below S1 and above R1 would be a prudent way to manage risks associated with unexpected market moves.

BTCUSDT.1DIn my latest technical analysis of the Bitcoin (BTC/USDT) daily chart, I've identified several significant technical indicators and price levels that are crucial for understanding the potential future movements of Bitcoin. Notably, the Moving Average Convergence Divergence (MACD) shows a significant bearish divergence, as indicated by the substantial gap between the MACD line and the signal line. This suggests strong bearish momentum, which could mean further declines unless there's a positive crossover in the near future.
The Relative Strength Index (RSI) at 31.47 is hovering near the oversold territory, indicating that the selling pressure might be nearing its peak. An RSI below 30 typically suggests that the asset is oversold, which could potentially lead to a price rebound if buyers step back in.
Looking at the price action, Bitcoin has recently tested the support level at $49,565.4 (S1). This is a critical point; if it holds, it may serve as a springboard for a potential recovery towards resistance levels at $60,428.64 (R1) and possibly extending to $73,001.98 (R3) if a bullish trend resumes. The chart also depicts a scenario where Bitcoin might bounce between these levels, indicated by the green and red arrows representing potential bullish and bearish movements respectively.
However, it's crucial to consider that a break below the support at $49,565.4 could lead to a further drop towards the next significant support level at $38,706.45 (S2). Such a movement would likely confirm the continuation of the bearish trend, necessitating a cautious approach for traders.
In conclusion, Bitcoin's market is currently at a pivotal juncture. My strategy would involve closely monitoring the $49,565.4 support level. A confirmed bounce from this level could provide a buying opportunity, targeting the first resistance at $60,428.64. However, a break below this support would be a bearish signal, suggesting potential exits or short positions towards the lower support at $38,706.45. Traders should remain vigilant and responsive to price actions and key technical indicator signals.

Bitcoin can continue to decline inside downward channel to $58KHello traders, I want share with you my opinion about Bitcoin. By observing the chart, we can see that the price entered to the range, where it soon reached the 68300 resistance level, which coincided with the seller zone with the top part of the range and then started to decline. In a short time, the price fell to the bottom part of the range, which coincided with the current resistance level, and at once turned around and quickly rose to the 68300 level. Then BTC exited from range and even rose a little higher than the 68300 level, but soon made a correction below, after which in a short time rose back. Next, the price turned around and started to decline inside the downward channel, where firstly it broke the 68300 level and later declined to the 64000 level. Soon, BTC broke this level too and fell to the support line of the channel, but a not long time ago it rebounded and started to grow. So, in my opinion, BTC can make a small movement up and then continue to decline inside the downward channel. For this case, I set my TP at 58000 points, which coincides with the support line of the channel. Please share this idea with your friends and click Boost 🚀

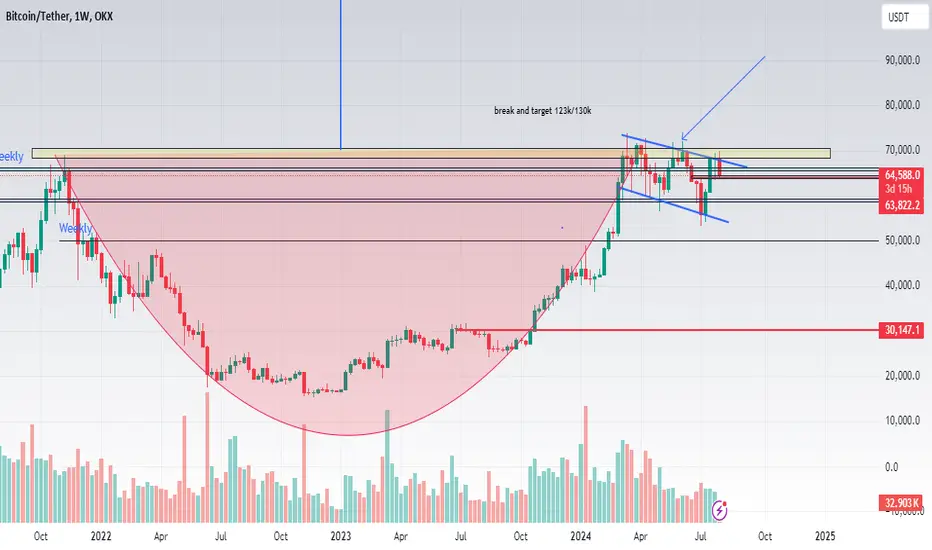
BTC, cup and handle on weekly chart!OKX:BTCUSDT we have a massive cup and handle on a weekly chart, the break out of 71k we could take us at price target around 120/130k, we can also see 50k before the bull start to push.
Bitcoin can break resistance level and then continue to growHello traders, I want share with you my opinion about Bitcoin. By observing the chart, we can see that the price a not long time ago entered to upward channel, where it soon broke the 64400 support level, which coincided with the support area. After this movement, BTC rose a little more and then made a correction to the support area, where later made a strong impulse up until to resistance level. When the price reached the 68200 level, which coincided with the seller zone, it at once turned around and in a short time declined to support line of the channel. Then price exited from the channel and fell to the support area, where it turned around and started to grow near the support line. Soon, the price rose to the resistance level again, but this time it broke this level and even rose a little higher than the seller zone, but a few moments ago BTC turned around and dropped to the support line, breaking the 68200 level one more time. Now, the price continues to trades near this line, so, in my opinion, BTC can make a small movement down, lower than the support line, and then bounce up to the resistance level and break it. After this, the price will make retest inside the seller zone and then continue to grow. For this reason, my 1st TP is resistance level, 2nd TP - is 70400 points. Please share this idea with your friends and click Boost 🚀

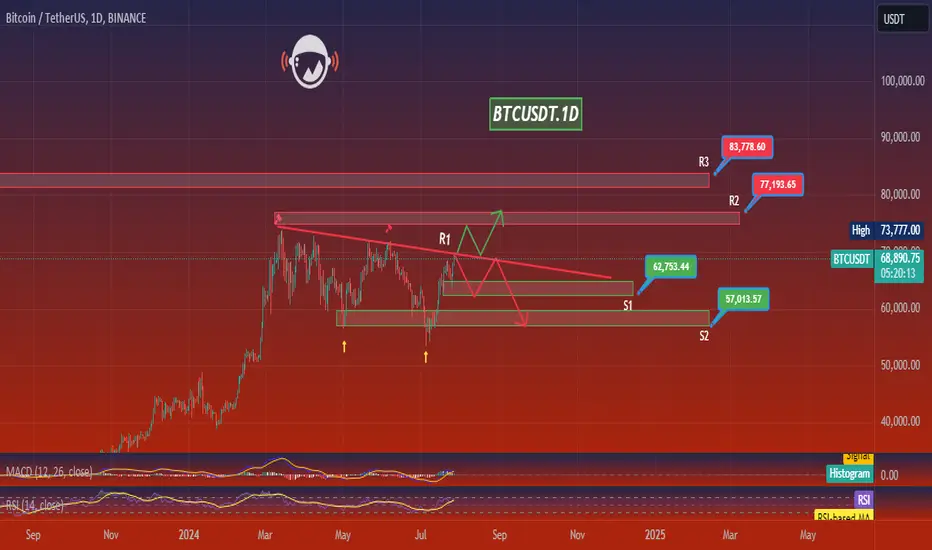
BTCUSDT.1DReviewing the BTC/USDT daily chart, I've identified key technical elements that provide insights into Bitcoin's current market dynamics and potential future movements.
Current Situation:
BTC/USDT is currently trading at approximately $68,775.98, reflecting a rise of about 1.28% for the day. The price action over recent months shows a somewhat volatile trend with a pattern of higher lows, suggesting an underlying bullish sentiment.
Technical Analysis:
Support and Resistance Levels:
S1 (Support 1): Positioned at $62,733.44, this level has served as both support and resistance throughout 2024, indicating its significance. Holding above this level is crucial for maintaining the current bullish momentum.
S2 (Support 2): At $57,013.57, this level represents a stronger psychological and technical support, marking a previous consolidation zone.
R1 (Resistance 1): The immediate resistance is at $77,193.65. This level needs to be breached to confirm continuation of the upward trend towards historical highs.
R3 (Resistance 3): At $83,778.60, approaching this level would likely require a significant bullish catalyst, such as positive regulatory news or macroeconomic factors favoring cryptocurrencies.
Moving Average Convergence Divergence (MACD):
The MACD line is above the signal line and appears to be maintaining a bullish trajectory, although the histogram shows some decrease in momentum. This could suggest a potential consolidation or slight pullback before further upward movement.
Relative Strength Index (RSI):
The RSI at 61.12 suggests that Bitcoin is neither overbought nor oversold, operating within a healthy range. There's room for upward movement without immediate concerns of being overbought.
Conclusion:
As of now, the bullish signals dominate the chart with both MACD and RSI indicating positive momentum, albeit with a caution of potential consolidation due to the histogram's behavior. My strategy would involve closely watching the $62,733.44 support level. A hold above this level can be seen as a confirmation of continued bullish sentiment, potentially aiming for the $77,193.65 resistance. Conversely, a break below could signal a shift in market dynamics, necessitating a reassessment of the bullish outlook.
For traders and investors, it's advisable to place stop losses just below key support levels to protect against unexpected downturns. Additionally, keeping an eye on global economic indicators and crypto-specific news will be crucial in navigating the volatility inherent in Bitcoin's market.
Bitcoin can rebound up from support line of channel to 70500Hello traders, I want share with you my opinion about Bitcoin. By observing the chart, we can see that the price reached the support area, which coincided with the current support level, and then turned around and dropped to the 56700 support level. Later, BTC broke this level and even fell lower than the buyer zone, but soon turned around and started to grow inside the upward channel, where it reached the 56700 level and broke it again. Next, the price continued to grow to the resistance line of the upward channel and then the price exited from this channel. But BTC continued to move up inside another one upward channel, where it soon reached 63200 current support level and broke it too. After this movement, the price rose until the channel's resistance line, but not long ago it turned around and made a correction movement to the support line. At the moment, BTC continues to grow near this line and I think that the price can rebound from the support line to the resistance line of the upward channel. For this case, I set my TP at 70500 points, which coincided with the resistance line. Please share this idea with your friends and click Boost 🚀

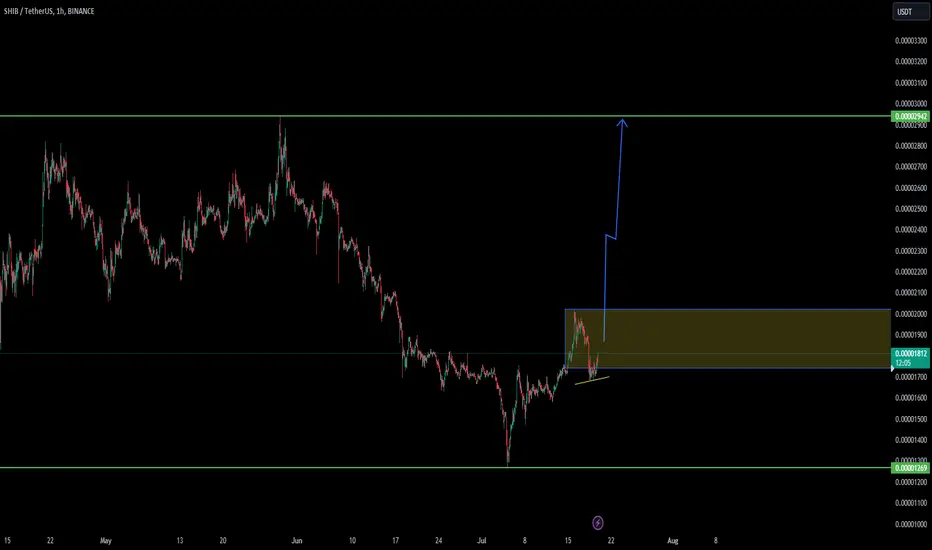
THE GOLDEN RETURN OF SHIBADepending on the low time frame the first activation for SHIB/USDT
We expect that there is a good chance of an increase in volume.
in the coming time, we will follow SHIBAUSDT
The top NO 1 USDT whale holds the most SHIBA.
90% of the unexpected volume is around 30%, there is a good chance it can do with time 60% and up.
Shiba is a value coin that is doing an unexpected increase over time.