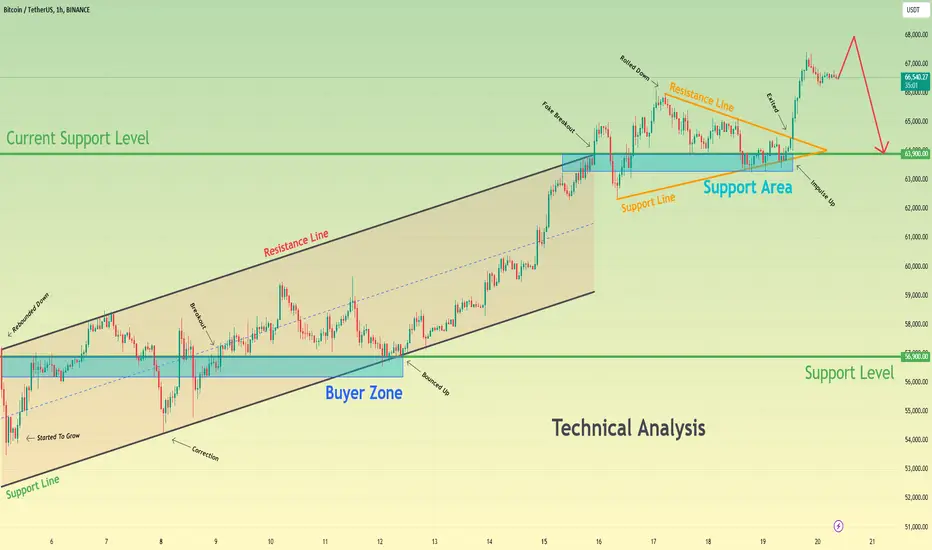
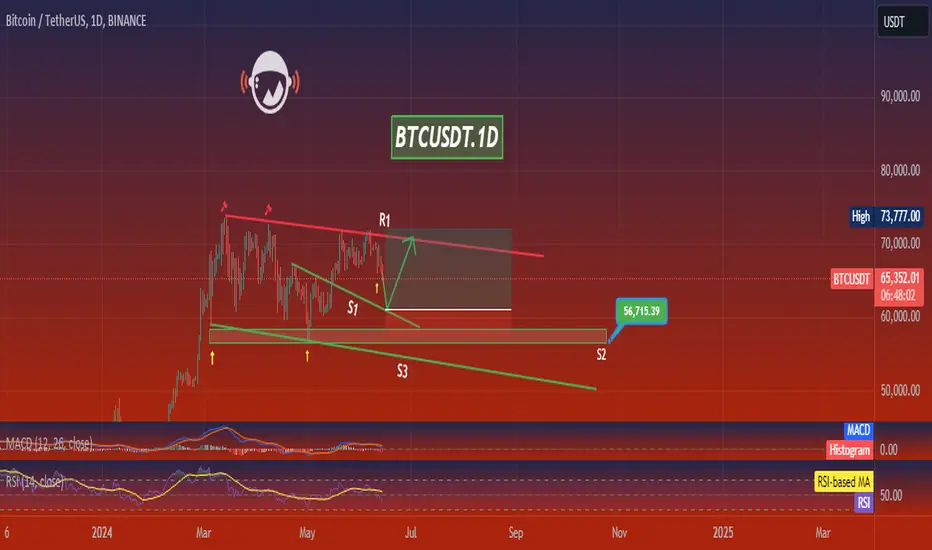
Bitcoin can reach 68K points and then start to declineHello traders, I want share with you my opinion about Bitcoin. Observing the chart, we can see that the price some time ago rebounded down and then started to grow inside the upward channel, where it soon reached the resistance line, but at once made a correction to the support line. After this movement, the price rebounded from the support line and quickly broke the 56900 level one more time, which coincided with the buyer zone and some time traded near this level. Later Bitcoin fell to the support level and at once bounced and continued to grow to the resistance line of the channel, which their moment coincided with the current support level. Price exited from the channel and made a fake breakout of the 63900 level, after which started to trades inside the wedge, where it rebounded from the support line and rose to the resistance line, breaking the 63900 level again. After this movement, BTC corrected to the support area, where it reached the support line of the wedge and made an impulse up, exiting from this pattern. Recently, the price reached 67000 points, and now trades a little below, so, I think the price can rise to 68000 points and then start to decline to the support level. For this case, I set my TP at 63900 level. Please share this idea with your friends and click Boost 🚀
Btc-usdt
BTCUSDT.1DIn my rigorous analysis of the BTC/USDT daily chart, I explore various technical dimensions that help in shaping an effective trading strategy.
Current Market Position:
The price of BTC/USDT is currently at $64,002, reflecting a 1.60% decrease in the latest session. This movement indicates significant volatility and necessitates an in-depth technical examination to predict future directions.
Trend Analysis:
BTC has shown some consolidation after a bullish run, evident from the trading range defined by several key resistance and support levels. The recent price behavior suggests a struggle between bears and bulls to establish control.
Support and Resistance Levels:
S1 at $58,923.16 and S2 at $53,398.13: These support levels are crucial. A break below S1 could indicate a bearish downturn towards S2, whereas stability or a bounce at S1 might suggest continued consolidation or an upward reversal.
R1 at $67,571.03 and R2 at $74,056.94: R1 is the immediate resistance, with R2 providing a higher target in case of a bullish breakout. Surpassing R1 would potentially open the way for a test of R2, signaling strong bullish momentum.
Technical Indicators:
Relative Strength Index (RSI): The RSI at 58.25 shows that BTC is neither overbought nor oversold, hovering near the midpoint. This suggests a potential for either direction, depending on market forces and upcoming news or economic data.
Moving Average Convergence Divergence (MACD): The MACD line is above the signal line but shows signs of converging. This could indicate a weakening bullish momentum or a potential bearish crossover if the trend continues.
Strategic Trading Insights:
Given the current market setup, my strategy would involve a balanced approach. I would closely monitor the price action near the support level of S1 ($58,923.16). Holding above this level might offer a buying opportunity, anticipating a potential test of R1 ($67,571.03). Conversely, a breakdown below S1 would warrant caution, potentially adjusting positions to prepare for a further slide towards S2.
For entry, I'd consider a long position if there's a clear bounce from S1 with adequate volume support, setting a stop-loss just below S1 to mitigate risks. On the flip side, should the price break below S1 convincingly, I'd explore short positions, targeting S2 while maintaining a tight stop above the broken support.
Conclusion:
The BTC/USDT trading pair presents a complex scenario with significant levels at S1 and R1 likely to dictate the short-term market trend. Traders should stay alert to these pivotal levels and adjust their strategies based on solid technical signals and market dynamics. Implementing stringent risk management and keeping abreast of market news are imperative to navigate the anticipated volatility effectively.
Bitcoin can rebound from resistance level and start to declineHello traders, I want share with you my opinion about Bitcoin. Looking at the chart, we can see how the price a not long time ago entered a wedge, where it at once rebounded from the resistance line and broke the 63700 resistance level, which coincided with the seller zone. After this, BTC fell to the support line of the wedge and then started to grow and when it reached the resistance line of the wedge in the seller zone, the price turned around and rebounded down to the support line. Then price continued to decline, thereby exiting from the wedge and later even fell lower than the 56500 level, which coincided with the buyer zone. But soon BTC turned around and started to grow inside the upward channel, where it some time later broke the 56500 level and continued to trades near this level. A few moments later BTC made a strong impulse up from this level to the resistance level, thereby exiting from the channel and even recently making a fake breakout of the 63700 level. To this day, the price trades near this level and I think that it can rebound from the resistance level and start to decline. So, I set my TP at 60000 points. Please share this idea with your friends and click Boost 🚀

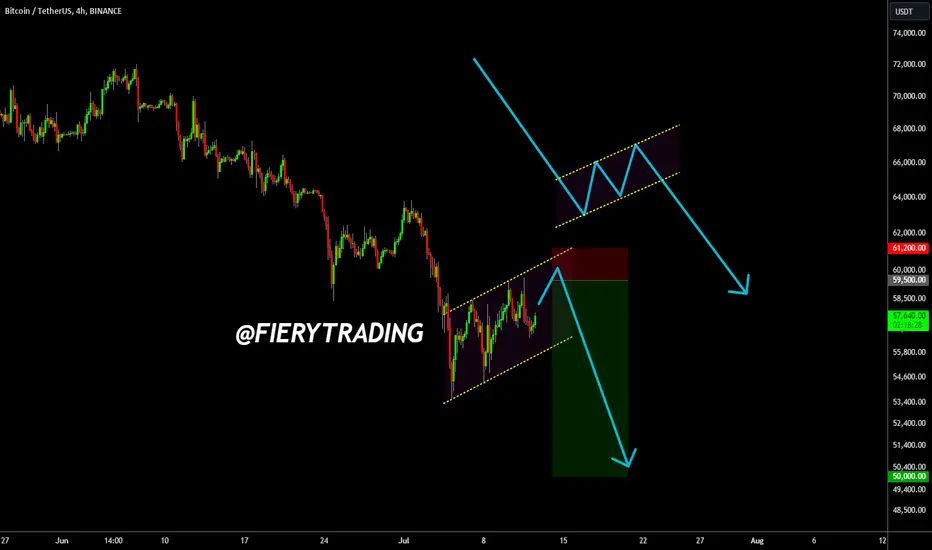
Bitcoin Bear-Flag Signal: Prepare For Dump!After the massive losses in June, Bitcoin has at the very least found a temporary bottom in July.
In my view, this is nothing more than a temporary pause to let the long-term oscillators get less extreme. The most likely scenario will be that the Bear Flag pattern will play out over the next few weeks.
This is a risky bet, since we're going to trade from the top resistance instead of waiting for the price to fall through the support. However, the R/R ratio is much better.
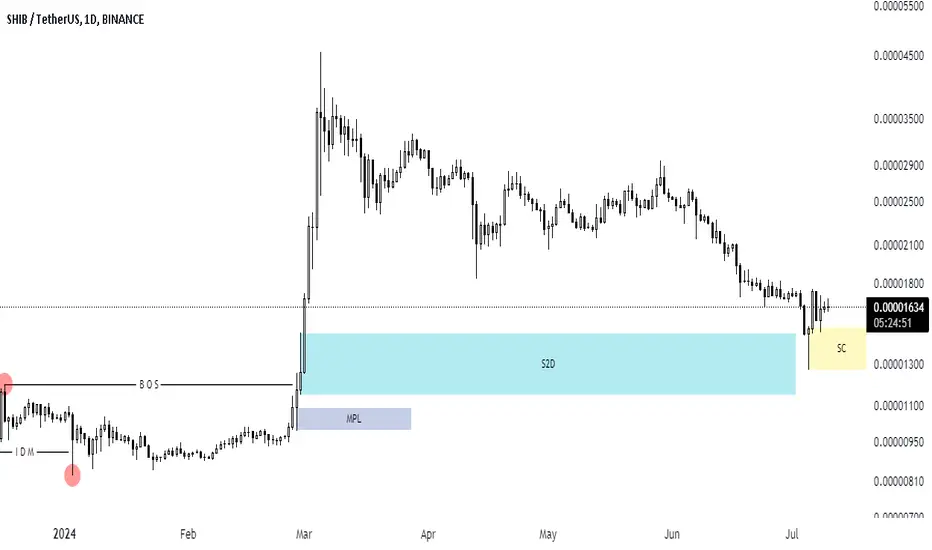
SHIB is ready for PUMP!#SHIB in dayli timeframe is in a bullish structure and recently touched its S2D flip zone and made a SCOB confirmation.
So it can go up from here , specially because of its upside momentum and last downside momentum .
Its not a financial advice ,DYOR.
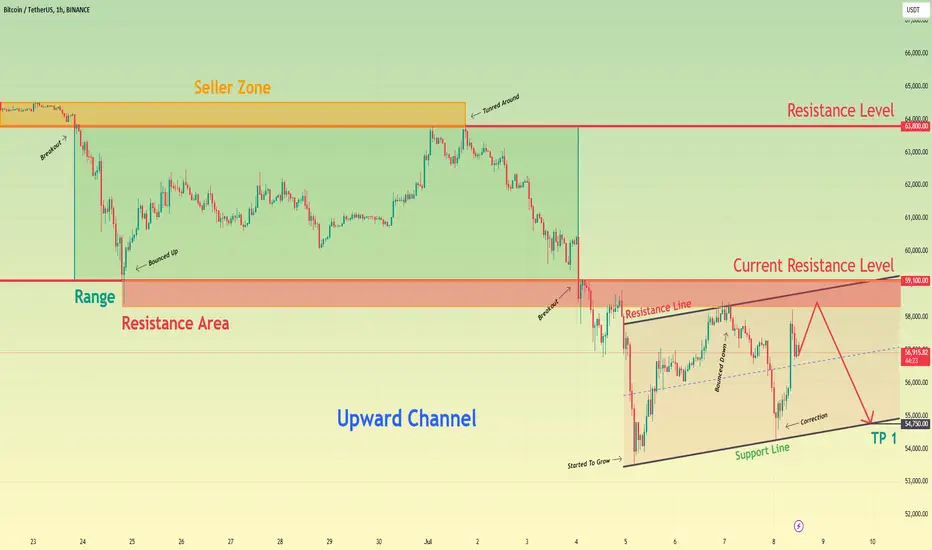
Bitcoin can reach resistance area and then start to declineHello traders, I want share with you my opinion about Bitcoin. Looking at the chart, we can see how the price some time traded in the seller zone and then broke the 63800 level, after which fell to the current resistance level. After this, the price started to trades inside the range, where it rebounded from the 59100 level and in a short time rose to the 63800 level, but then it turned around and started to decline. The price quickly fell to the current resistance level, broke it, thereby exiting from the range also, and continued to fall. When BTC declined to 53500 points, it turned around and started to grow inside the upward channel, where it in a short time rose to the resistance line of the channel. After this movement, the price rebounded and made a correction to the support line, after which BTC bounced and recently rose almost to the resistance area, which coincided with the current resistance level. In my opinion, the price can reach the resistance area, after which Bitcoin will turn around and start to decline to support line of the channel. For this case, I set my TP at 54750 points, which coincided with this line. Please share this idea with your friends and click Boost 🚀
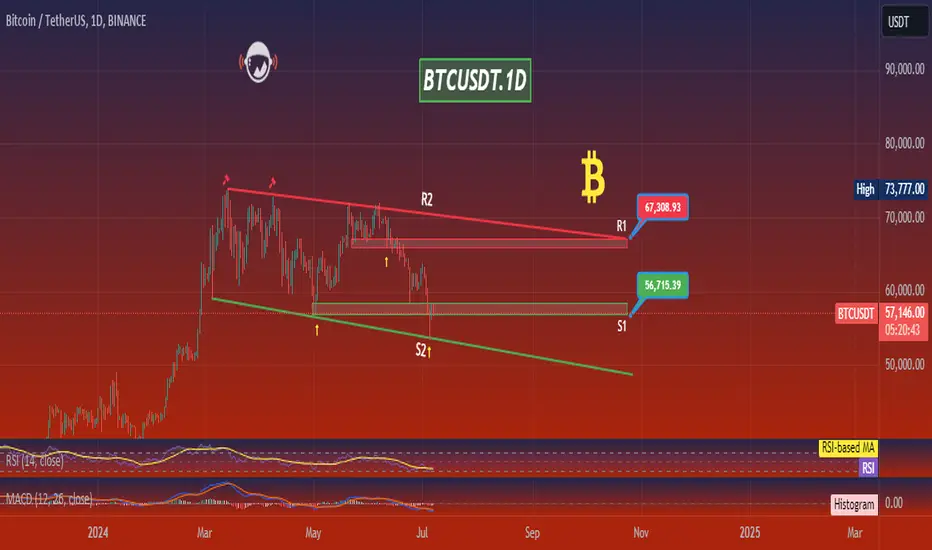
BTCUSDT.1DAnalyzing the BTC/USDT chart, it's evident that Bitcoin is at a crucial juncture in its trading pattern. The price of Bitcoin, currently around $57,135.99, lies just above the critical support level at $56,715.39 (S1). This level is significant because it has acted as both support and resistance in the past, indicating its importance in the market's sentiment towards Bitcoin.
Looking at the resistance levels, the first major resistance (R1) lies at $67,308.93. This level would be key for any bullish reversal or continuation patterns. Overcoming this resistance could potentially lead to testing higher levels, which might bring the price closer to its previous highs.
The RSI at 34.75 suggests that the market is nearing oversold conditions, which might attract buyers looking for value in anticipation of a potential price increase. The MACD, currently below the signal line, indicates bearish momentum, although the histogram shows a slight reduction in downward momentum.
Conclusion:
Given Bitcoin's position near the support level of $56,715.39, this could be an opportune moment for me to consider entering a position if I believe in a bullish scenario for the short to medium term. I will closely monitor this level for any signs of stability or a bounce, which could suggest a potential reversal. A stop-loss slightly below this support would be prudent to minimize potential losses should the downtrend continue.
Conversely, should the price break below this support convincingly, it could indicate further declines, potentially making it a good point to either exit positions or wait for more favorable buying opportunities at lower levels. Additionally, any move above the R1 at $67,308.93 would necessitate reassessing the bullish scenario and possibly adjusting targets to higher resistance levels. As always, integrating this technical analysis with broader market news and sentiment is crucial to fully inform any trading decisions.
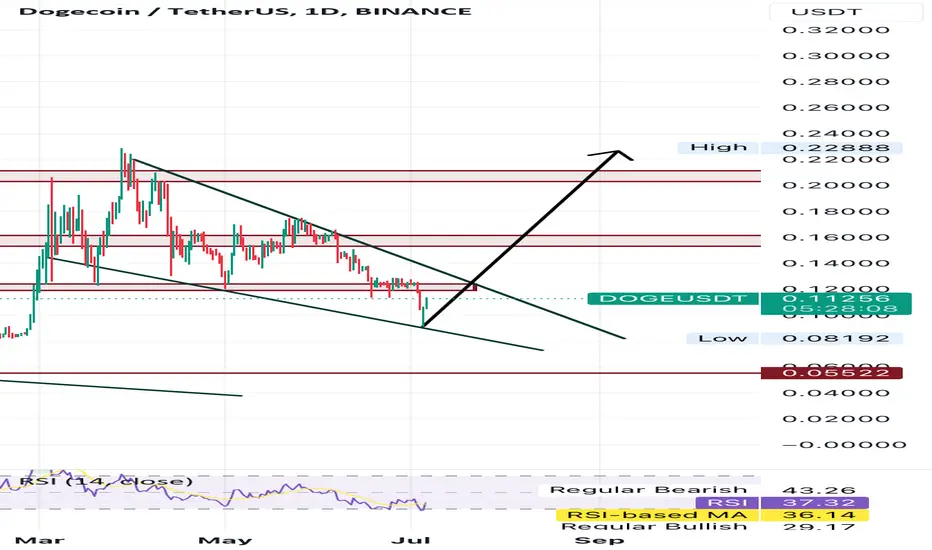
DOGE/USDT Bullish Breakout PredictionDaily DOGE/USDT Analysis
In the daily chart of Dogecoin against Tether (DOGE/USDT), the price has been moving within a descending wedge pattern. Recently, the price made contact with the bottom of this wedge, and with the current bullish momentum indicated by a 7.05% increase, there is a strong possibility of a breakout from this pattern upwards.
Technical Analysis:
Descending Wedge: Dogecoin has been consolidating in a descending wedge, which is typically a bullish reversal pattern.
Recent Bounce: The recent contact with the bottom of the wedge and subsequent bounce suggest a potential upward breakout.
Relative Strength Index (RSI): The RSI is at 37.69, indicating that Dogecoin is near oversold territory and may be due for a reversal.
Price Prediction:
Based on the analysis, it is predicted that Dogecoin will soon break out of the descending wedge upwards. After a potential short-term correction, the price is likely to move towards the target of $0.22888. This presents a good buying opportunity with significant potential upside.
Disclaimer:
I am not a financial advisor, and these predictions should not be taken as financial advice.
Bitcoin can decline a little more and then make impulse upHello traders, I want share with you my opinion about Bitcoin. Observing the chart, we can see that the price started to decline inside the downward channel, where it some times traded near the 64600 resistance level, which is located inside the seller zone, and later bounced up to the channel's resistance line. After this movement, BTC rebounded from the resistance line and quickly fell lower than the 64600 level, breaking it, after which some time traded below this level and then dropped to the support line of the channel, which coincided with the current resistance level with the resistance area. Then the price started to grow and in a short time rose to the resistance line of the downward channel and left it, after which tried to grow more, but failed and quickly declined to the 59100 level. Also recently, the price broke this level, and made a retest, and at the moment, the price felling lower even than the resistance area. In my opinion, BTC can decline to 56k points, after which the price will turn around and make a strong upward movement to the resistance level. Then it can break resistance level and continue to move up, so, that's why I set my TP at 61000 points. Please share this idea with your friends and click Boost 🚀

MASA NEW INCREASE VOLUME AND BREAKSince the breakdown of BTC more coins are into a downtrend
MASA seems to be able to make a high chance for an increase in the coming time frames.
We will see if MASA can make new trend confirmations and break.
$0,09 can become the first 15% first target

Bitcoin can make correction to support level and then bounce upHello traders, I want share with you my opinion about Bitcoin. Looking at the chart, we can see how the price a few moments ago entered to the range, where it some time traded near the resistance level, which coincided with the seller zone and then rebounded up to the top part of the range. After this movement, the price turned around and quickly declined to the 67600 level, and later broke it, thereby exiting from the range also and continuing to decline inside the downward channel. Inside the channel, the price fell until to the support level, which coincided with the buyer zone, and then made a fake breakout of this level, thereby exiting from the channel. After this, the price tried to grow, but soon turned around and fell back to the 60200 support level. But a not long time ago price turned around and started to grow, so, at the moment I think that BTC can make a correction to the support level again and then turn around and continue to grow. For this case, I set my TP at 65000 points. Please share this idea with your friends and click Boost 🚀

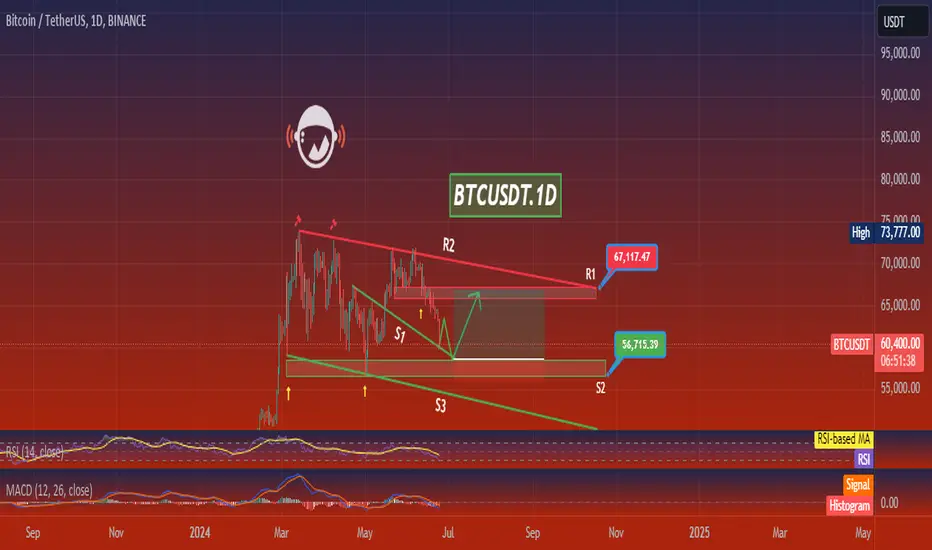
BTCUSDT.1DThe current trading price of Bitcoin against USDT is $60,021.58, reflecting a recent decline of approximately 5.04%. The chart displays a complex scenario with multiple key technical levels.
Key Support and Resistance Levels:
Resistance 1 (R1): $67,117.47 - This level represents a significant resistance, which Bitcoin struggled to overcome in recent attempts.
Resistance 2 (R2): Not marked on the chart, but it would likely be above $67,117.47, possibly near the previous highs.
Support 1 (S1): $56,715.39 - This level has previously acted as both support and resistance, making it a crucial point for traders to watch.
Support 2 (S2): Not clearly marked but indicated by previous lows below $56,715.39, possibly around $50,000.
Technical Indicators:
MACD: The Moving Average Convergence Divergence (MACD) is below the signal line, indicating bearish momentum. The separation between the MACD line and the signal line is increasing, suggesting strengthening bearish pressure.
RSI: The Relative Strength Index (RSI) is at 30.58, just above the oversold territory. This indicates that Bitcoin is very close to being oversold, which could potentially lead to a rebound or at least a stabilization of price declines.
Analysis Conclusion:
The current technical landscape for BTC/USDT is cautiously bearish. The recent price action beneath key resistance levels and the bearish indications from both the MACD and RSI suggest potential further downside. However, the proximity of the RSI to oversold conditions may limit the downside risk and could signal a possible buying opportunity if other market conditions align.
Traders should closely monitor the $56,715.39 support level, as a break below this could open the door to lower prices, potentially around the $50,000 mark. Conversely, a rebound from this support or an RSI recovery above the oversold region could suggest short-term bullish opportunities, particularly if Bitcoin can challenge and break above the $67,117.47 resistance.
Bitcoin can rise a little and then continue fall inside channelHello traders, I want share with you my opinion about Bitcoin. By observing the chart, we can see that the price some days ago declined lower than the support level, which coincided with the buyer zone, after which it entered to the pennant, where at once made impulse up, breaking 61200 again. Then the price made correction to the support level and then started to grow to the resistance line of the pennant pattern, after which turned around and fell to the support line. Next, the price bounced up, exiting from this pattern, and also rose higher than the 70200 resistance level, which coincided with the seller zone, but soon turned around and started to decline inside the downward channel. In the channel, BTC broke the resistance level one more time and fell to the support line of the channel, after which rebounded up, and tried to grow, but soon price continued to decline. Now, BITCOIN continues to decline inside the downward channel, so, in my opinion, the price can grow to the resistance line of the downward channel and then it will continue to decline to the support level. For this case, I set my TP at the 61200 support level. Please share this idea with your friends and click Boost 🚀
Bitcoin can bounce from buyer zone to resistance line of channelHello traders, I want share with you my opinion about Bitcoin. Observing the chart, we can see that the price some time ago bounced from the support line and started to grow to the resistance level, which coincided with the seller zone and even soon exited to this zone, breaking the 70800 level. But later, BTC turned around and started to decline inside the downward channel, where at once broke the 70800 level one more time and support line soon too. Next, the price fell to the support line of the channel, after which rebounded up to the resistance line. Bitcoin at once turned around from the resistance line of the channel and in a short time declined to the support level, which coincided with the buyer zone. Then the price bounced up and tried to rise, but failed and made a correction to the 65200 level, after which made little movement up again and quickly fell back. Recently Bitcoin started to grow, so, in my opinion, it can decline to the buyer zone, after which the price will turn around and rebound up to the resistance line of the downward channel. For this case, I set my TP at 67300 points, which coincided with the resistance line. Please share this idea with your friends and click Boost 🚀
Bitcoin's Best Worst-Case ScenarioPreface: BTC's long-term trend is till bullish, so most likely scenario at this point is a continuation of the trend. Still, it's important to consider different views.
Bitcoin has been trading within the 70k-60k area for the better part of three months at this point. This came after making a (minor) new all-time high. This is the first all-time high that occured before the halving, so rather special.
Worst-case scenario for the bulls would be that we lose the long-term uptrend. Best worst-case would be a strong reversal from the bottom support. This support has been holding for >5 years, so I'd assume that a lot of buyers will be waiting around the support.
If we extrapolate history, Bitcoin should top out somewhere in Q4-2025. A move towards the support during the next few months and then a year of straight bull would fit this view.
More info on how I came to Q4-2025 here:
Do you think Bitcoin is going to make a new all-time high soon? New bear market? Share your thoughts.

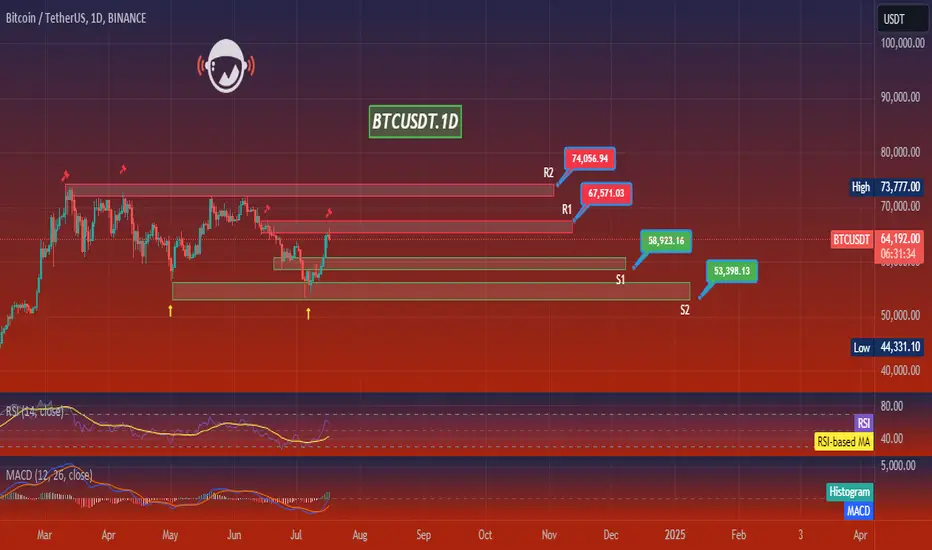
BTCUSDT.1DIn this technical analysis of the Bitcoin/USDT daily chart on Binance, we observe a few key indicators and their potential implications for the cryptocurrency's price action.
Price Action and Support/Resistance Levels
The chart illustrates a period of fluctuation within a defined range, showing strong resistance around $73,777 and multiple support levels marked as S1, S2, and S3, with the current price near $65,463.97. Notably, there is a significant support level at $56,715.39, which could play a crucial role if a downward trend were to resume.
Technical Indicators
MACD (Moving Average Convergence Divergence): The MACD line is not visible, but the histogram below the price chart suggests a potential increase in bearish momentum as it appears to be in the negative territory. This indicates that the market might be gaining downward momentum or that a reversal from recent gains could be imminent.
RSI (Relative Strength Index): The RSI, at a value of around 53.87, is near the midpoint of 50, which typically indicates a neutral market condition. This positioning does not strongly support either a bullish or bearish trend in the immediate term, suggesting a possible continuation of the current consolidation phase.
RSI-based MA (Moving Average based on RSI): This indicator is also neutral, aligning with the RSI’s implication of ongoing market indecision.
Conclusion
Considering the current indicators and the price’s position relative to its recent range, Bitcoin seems to be in a consolidation phase with potential tests of both support and resistance levels in the near future. The negative tilt in the MACD histogram and the neutral RSI readings suggest a lack of strong bullish momentum, pointing to possible sideways movement or slight bearish pressure in the short term. Investors and traders should watch for a breakout above the current resistance or a breakdown below support levels to gauge the next significant move in the market. The key will be monitoring these levels and indicators closely for any signs of a definitive trend.
BTCUSDT.1DLooking at the daily chart for BTC/USDT, the technical indicators reveal key dynamics and potential future movements in the price of Bitcoin.
Price Action and Structure: The BTC/USDT pair is currently trading at around $69,673.83, marking a significant uptick of 5.31% for the day. This recent movement brings the price closer to the critical resistance level (R1) at $71,128.00. Over the past few months, the price has experienced fluctuations within a defined range, with resistance and support levels tested multiple times.
Resistance Levels: The immediate resistance R1 at $71,128.00 is pivotal. A decisive close above this level could signal further bullish momentum, potentially targeting the high of $73,777.00 and then the psychological barrier at $75,176.44.
Support Levels: Current support levels are observed at S1 ($65,799.19) and S2 ($56,715.39). The support at S1 has recently acted as a springboard, pushing the price upwards. A breach below this support might lead to a test of S2, significantly lower, indicating a substantial bearish shift.
Moving Average Convergence Divergence (MACD): The MACD line is below the signal line but appears to be converging towards it, suggesting a potential bullish crossover in the near term. This potential crossover, coupled with the histogram's rise towards the zero line, signals strengthening momentum.
Relative Strength Index (RSI): The RSI is at 55.95, which is moderately bullish. It indicates some buying interest but is not yet in the overbought territory (above 70), which suggests that there might be room for further upward movement before the market becomes overheated.
Conclusion:
The BTC/USDT chart exhibits a bullish sentiment in the short term, especially if it can sustain above S1 and break through R1. The approaching MACD crossover and the RSI's favorable position further bolster this outlook. However, traders should remain cautious of potential resistance at $71,128.00 and $73,777.00, where profit-taking might occur. Setting stop-loss orders slightly below S1 could provide downside protection. If the price breaks and holds above R1, targeting the next resistance levels would be a prudent strategy, keeping an eye on the RSI for signs of entering the overbought zone.

LONG Bitcoin during RED days always!Morning lads,
Figured I'd share my view on BTC for the following weeks.
There's a chance that instead of a channel, its a descending triangle on the daily, bringing prices to 50k.
But Im gonna keep that in mind and hope we move up!
This trade would help alts tremendously as well..
Trade thirsty, my friends..
Bitcoin can start fall to support level, breaking support lineHello traders, I want share with you my opinion about Bitcoin. Looking at the chart, we can see how the price fell to the support line, some time traded near, and later made a strong impulse up to the 66500 level, which coincided with the support area and soon broke this level. After this, the price made little movement down, after which repeated impulse up to the resistance level coinciding with the seller zone. But at once BTC turned around and made a correction to the support area, and also the price started to trades in the range. In range, the price rebounded from the support area and tried to move up, but failed and fell back. After this movement, BTC started to grow, and in a short time rose to a 71500 resistance level, some time traded near and then bounced down. But a not long time ago it turned around and started to grow again. So, at the moment, I think that price can make little movement up to 70k points, after which turns around and starts to decline to the support level. breaking support line inside a range. For this case, I set my target at the 66500 level. Please share this idea with your friends and click Boost 🚀

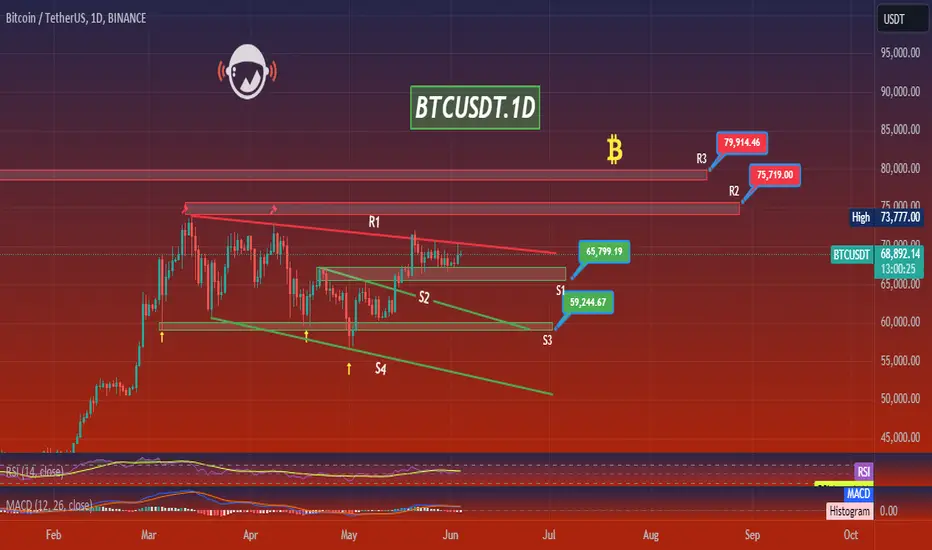
BTCUSDT.1DThe daily chart for Bitcoin (BTC) against USDT showcases key technical aspects that provide insights into potential future movements:
Resistance Levels:
R1 ($65,799.19): This level has previously acted as a strong resistance where price failed to break higher, suggesting significant selling pressure at this point.
R2 ($75,719.00) and R3 ($79,914.46): These levels represent further psychological barriers and possible profit-taking points if the price were to rally.
Support Levels:
S1 ($59,244.67): This is the nearest support level, currently underpinning the price. A breakdown below this could lead to further declines.
S2 (not explicitly marked with a price but indicated on the chart), and S3 and S4: Lower supports which, if breached, could signify a bearish market sentiment.
Current Market Position:
The price of BTC is currently at approximately $68,972.39, hovering just below R1 and above S1. This positioning indicates a consolidation phase within these boundaries.
Technical Indicators:
MACD (Moving Average Convergence Divergence): The MACD line is below the signal line but close, indicating a potential for a bullish crossover which could signal upward momentum if it occurs.
RSI (Relative Strength Index): The RSI is at 56, suggesting that there is room for price growth before reaching the overbought territory (typically above 70).
Trend Analysis:
The presence of an upward trendline from previous lows provides a visual representation of the current uptrend. This trendline acts as a dynamic support that can guide the price higher.
The current price is testing this trendline, and a sustained break could determine the short to medium-term market direction.
Trading Strategy:
Bullish Scenario: If BTC breaks and holds above R1, it would indicate potential for a move towards R2 and R3. Traders might look to enter long positions on a breakout above R1 with stop-losses placed just below this level.
Bearish Scenario: A drop below S1 could trigger a move towards lower support levels. Short positions could be considered if there is significant volume supporting the downward move, with stop losses just above S1.
Conclusion: Monitoring the reaction of BTC at these critical levels (R1 and S1) and the behavior around the trendline will be key. A decisive move either above R1 or below S1, supported by strong trading volume, would help confirm the market's direction. As always, it is crucial for traders to consider external factors such as market news and global economic conditions that could impact cryptocurrency markets.
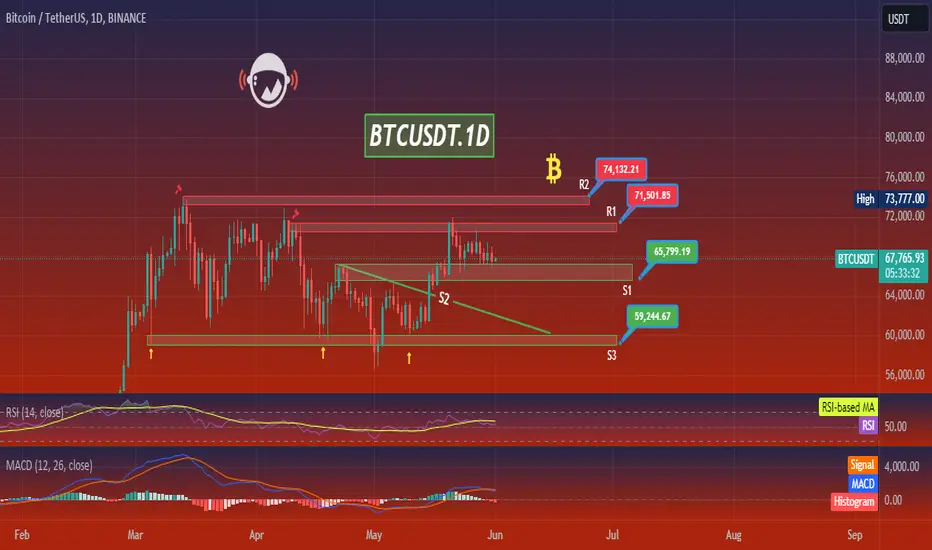
BTCUSDT.1DHere’s a detailed technical analysis of the BTC/USDT daily chart:
Price Action and Structure:
BTC/USDT has been exhibiting a sideways trading pattern, bounded by well-defined support and resistance levels. This horizontal channel highlights the consolidation phase that Bitcoin is currently experiencing. The chart shows repeated tests of these boundaries, indicating a struggle between buyers and sellers to gain control.
Technical Indicators:
1. RSI (Relative Strength Index): The RSI is at 57.34, which is in the upper half of the neutral zone. This indicates a slight bullish momentum but is still far from the overbought territory (70 level), suggesting there might be room for upward movement without immediate pressure of being overextended.
2. MACD (Moving Average Convergence Divergence): The MACD histogram shows a positive value, and the MACD line is above the signal line. This setup typically signals bullish momentum. However, the proximity of the lines suggests that the bullish strength is not very strong, and caution is warranted.
Support and Resistance:
• Support (S1 and S2): The key support levels are identified at $65,799.19 (S1) and $59,244.67 (S3). Maintaining above S1 is crucial for the bulls to prevent a drop towards S3, which would likely indicate a more significant bearish sentiment.
• Resistance (R1 and R2): Resistance levels are set at $71,501.85 (R1) and $74,132.21 (R2). A break above R1 could pave the way for testing R2, indicating a strong bullish trend.
Projection and Strategy:
Given the current consolidation, a breakout above R1 could signal the start of a bullish phase, potentially targeting R2 as the next significant resistance level. Conversely, a breakdown below S1 could shift the market sentiment to bearish, aiming for S3. Traders should look for volume-supported breakouts or breakdowns from these levels to confirm a stronger trend direction.
Conclusion:
BTC/USDT is at a critical juncture within its trading range. A breakout or breakdown from this range could dictate the trend for the upcoming weeks. Traders should closely monitor key levels and accompanying trade volumes for signs of direction. As always, external factors such as regulatory news or macroeconomic changes should also be considered, as they can have substantial impacts on Bitcoin’s price action.
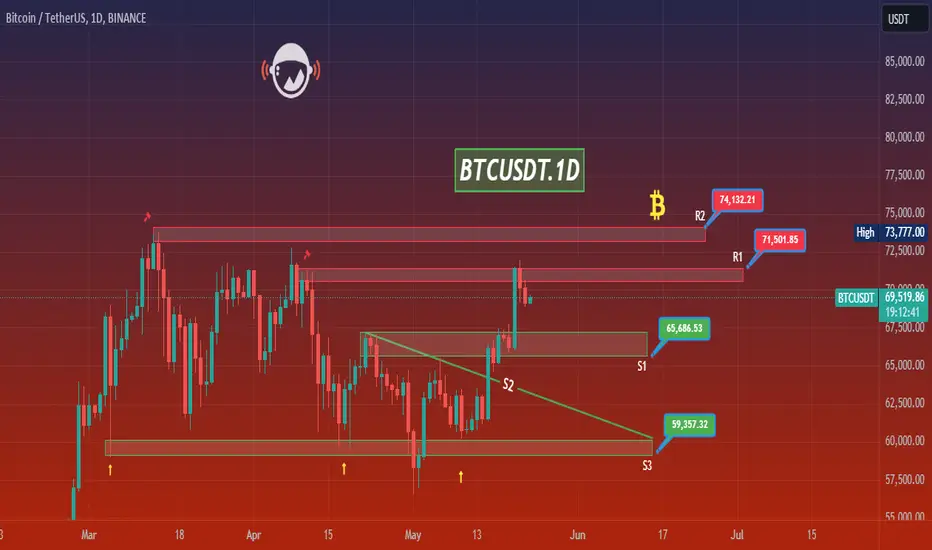
Bitcoin can correct to support area and then rebound upHello traders, I want share with you my opinion about Bitcoin. Looking at the chart, we can see how the price declined inside the downward channel, where it bounced from the resistance line and fell to the 61000 support level, which coincided with the support line of this channel. Then BTC broke this level, exiting from the downward channel also and declining a little lower, but soon turned around and started to grow inside the upward channel. In this channel, Bitcoin quickly rose to the resistance line, breaking the 61000 level again, and then corrected the 61000 support level, which coincided with the buyer zone. After this, the price continued to grow and later reached the current support level, which coincided with the support area. Soon, BTC broke it and even exited from the upward channel, but a not long time ago Bitcoin turned around and declined to support area. As well recently prices rebounded from this area and started to grow. So, in my opinion, Bitcoin can correct to support area and then rebound up, therefore I set my target at the 72500 level. Please share this idea with your friends and click Boost 🚀
BTCUSDT.1DBTC/USDT daily chart, several key technical indicators and levels stand out, providing insights into potential price movements.
Trend and Resistance Analysis:
The chart shows that Bitcoin (BTC) has experienced significant volatility, with the current price hovering around 66,707.40 USD. The price is currently testing the resistance level marked as R1, around 67,373.58 USD. A successful break above this level could see the price testing the next resistance at R2, which is around 71,320.28 USD. The overall trend appears to have a slight upward trajectory as the price has managed to break above a significant downward trend line.
Support Levels:
There are several key support levels identified. The immediate support level is labeled as S1 at approximately 66,000 USD. Below this, the next significant support levels are S2 at around 59,357.32 USD and S3 at approximately 56,447.95 USD. These levels have historically provided strong buying interest, which could prevent further declines if the price retraces.
RSI and MACD Indicators:
The Relative Strength Index (RSI) is currently at 58.91, indicating that the asset is in a neutral to slightly bullish zone. The RSI has been trending upwards, which suggests increasing buying momentum. The Moving Average Convergence Divergence (MACD) indicator shows a bullish trend with the MACD line (blue) above the signal line (orange)
, supported by a positive histogram. This suggests that bullish momentum is currently stronger.
Volume Analysis:
The volume pattern indicates that the price increases are accompanied by substantial trading volume, reinforcing the bullish sentiment. The volume spikes at key price levels suggest strong market participation during upward movements.
Conclusion:
In conclusion, the BTC/USDT pair is showing signs of a potential bullish breakout if it manages to stay above the R1 resistance level. The indicators, including a rising RSI and a bullish MACD, support the likelihood of continued upward movement. However, traders should remain cautious of potential retracements to the support levels at S1, S2, and S3, which could offer buying opportunities. Monitoring the price action around these critical support and resistance levels will be crucial for making informed trading decisions.
Overall, the market sentiment appears cautiously optimistic, with key levels and indicators suggesting a potential continuation of the upward trend, provided the resistance levels are successfully breached and maintained.