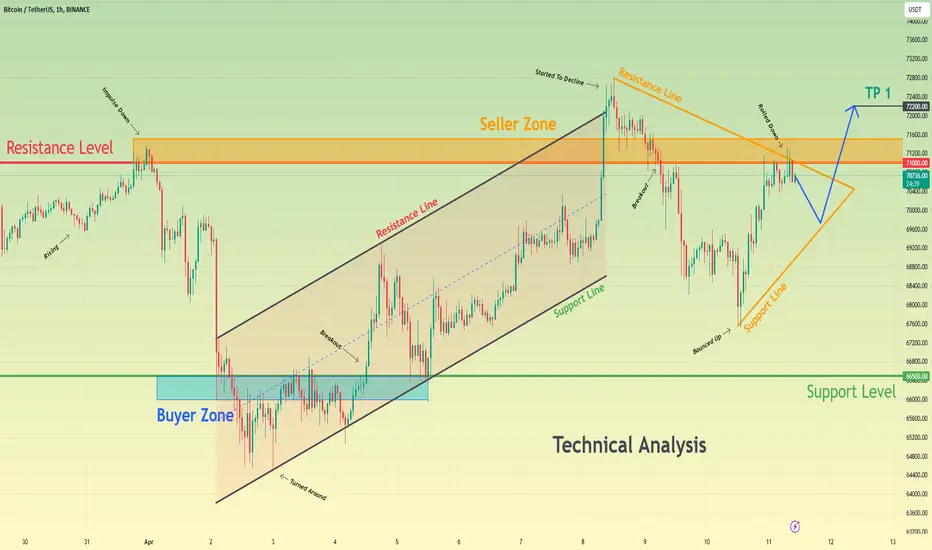
After exiting from pennant, BTC can make retest and bounce upHello traders, I want share with you my opinion about Bitcoin. Observing the chart, we can see that the price a long time ago reached a resistance level, which coincided with the seller zone, and then made a downward impulse to 56500 points, thereby breaking the 60200 level. But later BTC turned around and made a strong impulse up to the resistance level, breaking the 60200 level, which coincided with the buyer zone one more time. Also, the price entered the seller zone, where it rose to 65300 points and then at once turned around and started to decline, breaking soon the 64600 level again. As well price continued to decline inside the pennant, pattern, where it corrected almost to the support level. After this, BTC rose to the resistance line, but at once rebounded then and fell to the 60200 level and then started to grow to the resistance line of pennant again. When BTC reached this line, the price broke it, thereby exiting from the pennant pattern and now it trades near. In my opinion, Bitcoin can decline to this line, making retest and then rebound up. For this reason, I set my target at the 64600 resistance level. Please share this idea with your friends and click Boost 🚀
Btc-usdt

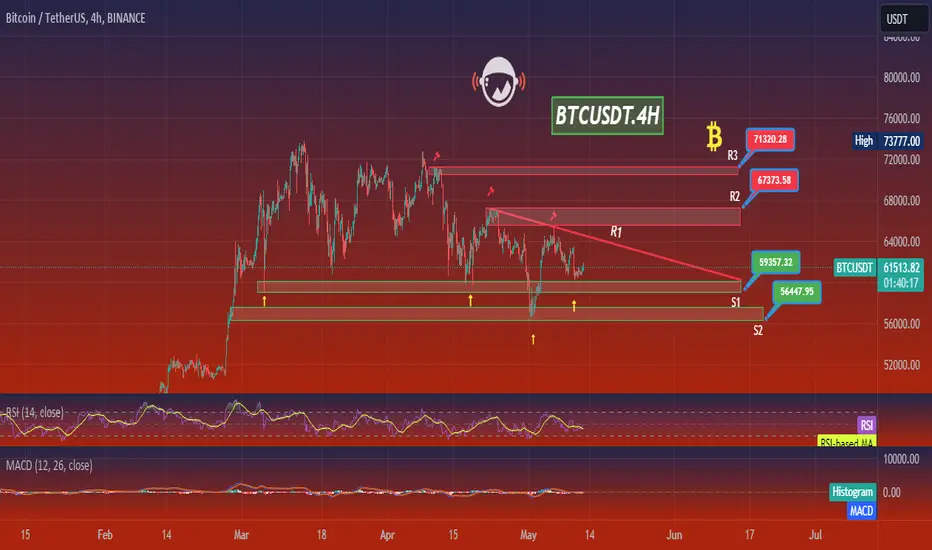
BTCUSDT.4HLet's dive into the 4-hour chart for BTC/USDT to extract insights and devise a potential trading strategy based on the observed technical data.
Key Resistance and Support Levels:
Resistance 1 (R1): $59,357.32 - This level is acting as the immediate ceiling for price actions, which if broken, could indicate increased buying momentum.
Resistance 2 (R2): $67,373.58 - A higher resistance point that could be a medium-term target if R1 is convincingly surpassed.
Resistance 3 (R3): $71,320.28 - This represents a significant peak and a tough resistance to overcome.
Support 1 (S1): $56,447.95 - The primary support level based on recent lows, providing a potential floor.
Support 2 (S2): This appears to be even lower than S1, but the chart does not specify an exact value.
Technical Indicators:
Relative Strength Index (RSI): The RSI stands at 48.42, which is near the neutral zone but slightly leans towards bearish sentiment. This positioning suggests that the price might still have some room before it reaches the oversold condition.
Moving Average Convergence Divergence (MACD): The MACD is currently below the signal line, indicating bearish momentum. The MACD histogram also suggests that the bearish momentum might be increasing as the bars are growing in size on the downside.
Trend Analysis:
The chart shows a descending trend line, indicating that the overall momentum has been bearish. The price is consolidating below this trend line, suggesting resistance against an upward move.
Conclusion:
The BTC/USDT market currently exhibits a bearish bias, as indicated by both the MACD and the descending trend line. Traders might consider looking for shorting opportunities at resistance levels, especially if the price fails to break above the trend line and shows reversal signs such as rejection candles or increased selling volume.
For a bullish scenario, a break and close above the trend line and subsequent breach of R1 at $59,357.32 could invalidate the bearish outlook, potentially targeting R2 at $67,373.58. However, given the current indicators, maintaining a cautious approach with tight stop losses near resistance levels would be prudent.
Entering trades on pullbacks to significant resistance levels or breakdowns below support levels with confirmatory signals from RSI and MACD could optimize entry points. Monitoring the RSI for signs of divergence or an approach towards oversold conditions could provide additional clues about potential reversals or slowing momentum.
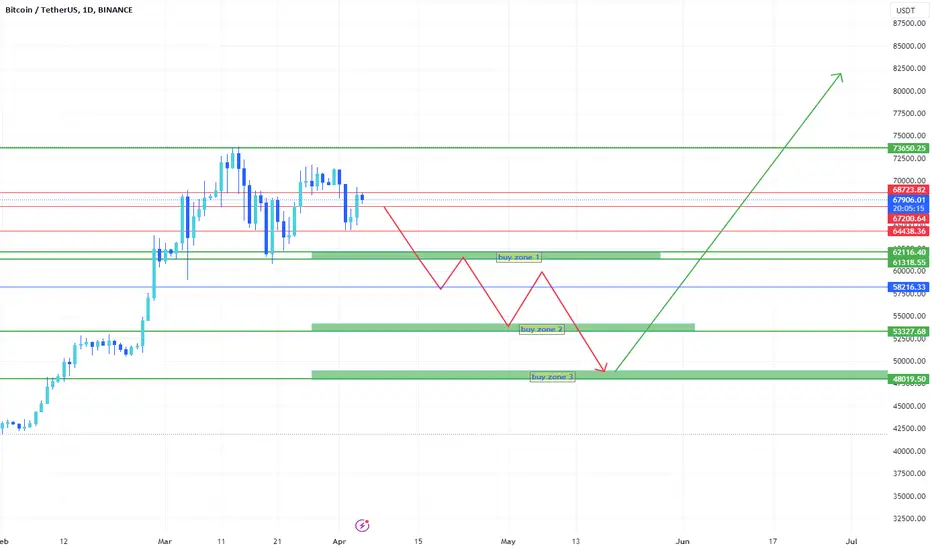
From day 12 to day 7 of juneThis is my prediction based on what is most agreedable move in the Total cripto market and USDT.D (USDT DOMINANCE).

Bitcoin can decline to support line of downward channelHello traders, I want share with you my opinion about Bitcoin. By observing the chart, we can see that the price some days ago entered to range, where it firstly declined to the current resistance level, which coincided with the support area and at once started to grow. In a short time price reached the 71000 resistance level, which coincided with the seller zone and tried to break. BTC failed and made a correction movement, after which in a short time rose back and finally broke the 71000 level, but can't fixed and soon declined back to the current resistance level, breaking the 71000 level one more time. Soon, BTC exited from range and then entered to downward channel, where it first rose to the resistance line, but later declined back to the support line of the channel, breaking the 62000 level. Then price made an impulse from the support line to the resistance line of the channel, after which rolled down to the support area, where now continues to trades near the current resistance level. I think that Bitcoin can continue to decline to support line of the downward channel, therefore I set my target at 55000 points, which coincided with this line. Please share this idea with your friends and click Boost 🚀

BTCUSDT.4HThe 4-hour chart for BTC/USDT provides an excellent perspective on the current market dynamics, highlighting potential trade setups based on technical analysis.
Key Resistance and Support Levels:
Resistance 1 (R1): $6,729.71 - This is the immediate resistance level which the price needs to breach to confirm further bullish sentiment.
Resistance 2 (R2): $7,384.73 - A more substantial resistance level which, if surpassed, could signal a stronger upward trend.
Support 1 (S1): $5,906.59 - Acting as the primary support, this level needs to hold to prevent further bearish momentum.
Support 2 (S2): $5,608.28 - If S1 is breached, S2 could serve as the next critical line of defense against a deeper retracement.
Technical Indicators:
Relative Strength Index (RSI): The RSI is currently at 41.28, suggesting that there is potential for upside as it is below the neutral 50 mark but not yet oversold.
Moving Average Convergence Divergence (MACD): The MACD is below the signal line, which typically indicates bearish momentum. However, the histogram shows that negative momentum is waning, suggesting that a reversal or consolidation might be near.
Trend Analysis:
The price is showing a descending pattern, characterized by lower highs, which is evident from the descending trend line. This suggests an overarching bearish pressure. However, the recent formation might suggest a consolidation phase or potential reversal if the price can break the descending trend line and hold above.
Conclusion:
Considering the technical outlook on the BTC/USDT 4-hour chart, the market is at a pivotal point. Traders should watch for a potential reversal if the price can sustain a breakout above the descending trend line. A successful break above R1 at $6,729.71 could validate a bullish bias, potentially targeting R2 at $7,384.73.
However, given the current bearish setup indicated by the MACD, it's essential to remain cautious. If the price fails to break above the descending trend line and falls below S1 at $5,906.59, it might accelerate losses towards S2 at $5,608.28. Traders should consider using tight stop-loss orders to manage risks and possibly wait for a clearer signal, such as the RSI moving above 50 or the MACD crossing above the signal line, before taking more definitive positions.
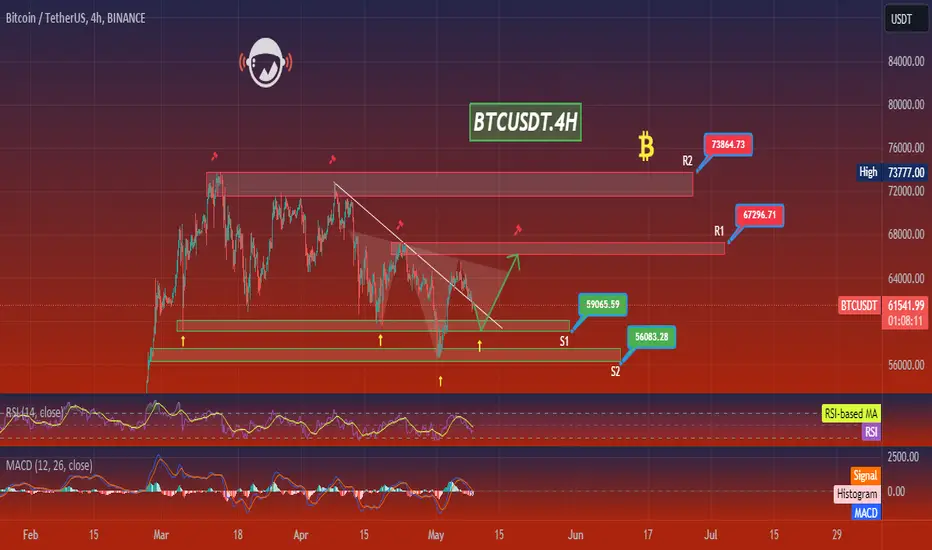
BTCUSDT.4HAnalyzing the 4-hour chart for BTC/USDT, I'll examine several key technical components to guide my current investment decisions.
Key Resistance and Support Levels:
Resistance 1 (R1): $67,296.71 - This level signifies a recent peak where the price faced significant resistance.
Resistance 2 (R2): $73,864.73 - A higher peak that represents a tougher psychological and technical barrier.
Support 1 (S2): $59,065.59 - A key support level that the price has tested recently.
Support 2 (S3): $56,083.28 - The next significant support level, reflecting a possible fallback point if S2 breaks.
Technical Indicators:
Relative Strength Index (RSI): At 54.32, the RSI indicates neither overbought nor oversold conditions, suggesting that there is room for movement in either direction without immediate pressure from traders looking to take profits or cut losses.
Moving Average Convergence Divergence (MACD): The MACD line is below the signal line with a histogram value in the negative territory, suggesting bearish momentum. It's essential to watch for any crossover above the signal line as it may indicate a shift to bullish momentum.
Trend and Pattern Analysis:
Descending Trend Line: The price has broken below this key trend line, indicating a potential reversal in the previously bullish sentiment. The validity of this breakout should be monitored closely for confirmation of a trend change.
Price Action: There have been lower highs and lower lows recently, suggesting a short-term downtrend. However, the price stabilization near the current levels could mean a consolidation phase before the next significant move.
Candlestick Patterns:
Recent candlestick patterns indicate a struggle between buyers and sellers, with no clear dominance yet. The absence of significant bullish or bearish engulfing patterns near current levels suggests indecision.
Conclusion:
Given the current market setup on the BTC/USDT 4-hour chart, caution is advised. The break below the descending trend line might suggest bearish momentum, but the lack of strong selling pressure and the RSI's neutral position could imply potential consolidation or a reversal if new bullish signals emerge. Investors should consider setting stop losses below $56,083.28 to manage risk effectively. A watchful eye on the RSI and MACD for signs of a crossover or return to bullish territory could be crucial in the short to medium term. My strategy would involve a cautious approach, possibly waiting for more definitive signals before taking significant positions.

Bitcoin can break support line and continue fall to 61000 pointsHello traders, I want share with you my opinion about Bitcoin. By observing the chart, we can see that the price a not long time ago started to trades inside the downward channel, where it rebounded from the resistance level, which coincided with the seller zone and rose to the channel's resistance line. After this movement, BTC turned around and quickly declined to support line of the channel, breaking the 64500 resistance level, but soon backed up to the seller zone. Later, the price finally broke the 64500 level and some time traded below, after which BTC rose to this level, which coincided with the resistance line of the channel, and rebounded down to the 59200 support level, which coincided with the support area. Also, Bitcoin left the downward channel and soon broke the 59200 level too. After this, the price turned around and made impulse up to the resistance level, breaking the 59200 level one more time and when BTC reached the 64500 level, it rolled down to the support line. Now, I think Bitcoin can reach the resistance level again and then rebound down lower than the support line, breaking it. For this case, I set my target at 61000 points. Please share this idea with your friends and click Boost 🚀

BTCUSDT.1DThe daily chart for Bitcoin (BTC/USDT) illustrates a continued downtrend with the formation of a descending triangle pattern, which is typically considered bearish. Bitcoin's current price is $63,034.98, and it has recently tested a significant support level (S1) at $59,065.59 without breaking below. Another key support level (S2) lies further below at $56,083.28.
On the resistance side, the first significant level (R1) to watch is at $67,154.38. A break above this could signal a potential shift in the market sentiment from bearish to bullish, targeting higher resistance levels such as $74,007.06 (R2).
The RSI stands at 47.63, indicating a neutral market sentiment but edging closer to bearish territory. The MACD is below the signal line, which supports the bearish momentum observed in the price action.
For traders, the key strategy would involve watching how Bitcoin interacts with these pivotal levels:
A rebound from S1 could offer a short-term buying opportunity, aiming for a retest of R1.
A break below S1 could see a continuation of the bearish trend towards S2, offering a potential short position setup.
A breakout above R1 might invalidate the bearish outlook and provide a bullish signal, with R2 as the next target.
As always, traders should wait for confirmation of these movements through additional indicators and market volume to substantiate the trend changes or continuations.

Bitcoin to 50k... BET or FACT?I have reasons to believe in a correction of at least 20%.
1. Market euphoria.
2. ATH.
3. 78.6 retracement after the gigantic fall.
4. Temporary massive sale.
Personally, I think it is not a good idea to sell. It is best to wait for better prices to buy.
Below 55k, its a good idea to BUY.
Take care.
JB.-
Bitcoin can turn around and start to grow to resistance levelHello traders, I want share with you my opinion about Bitcoin. Observing the chart, we can see that the price a not long time ago rebounded from the current resistance level, which coincided with the resistance area and tried to rise, but failed and fell back, after which at once repeated movement up and reached the 65400 resistance level. Then price made a little correction and started to decline inside the downward channel also, where later BTC rebounded from the support line and in a short time rose to the resistance line, breaking the 65400 level, which coincided with the seller zone. Price some time traded near the resistance line of the channel and later turned around and declined lower than the 65400 resistance level, breaking it one more time. After this, the price continued to decline in the channel to the current resistance level, and when BTC reached this level, the price recently broke it, thereby exiting from the downward channel too. Soon, the price declined lower than the resistance area to 56800 and now continues to decline. In my opinion, Bitcoin can make a little correction move and then start to grow to the 60800 current resistance level, which is my target also. Please share this idea with your friends and click Boost 🚀
Bitcoin !! maybe its Time for some Correction around 54k ! Hello traders this my update about bitcoin for short term. good luck for everybody .
Be careful there is a big manipulation is coming before and after the bitcoin halving.
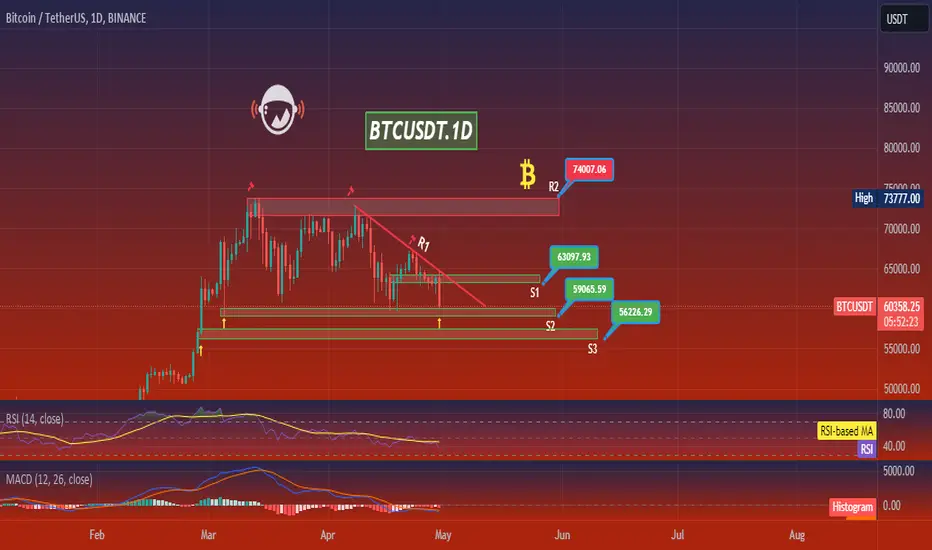
BTCUSDT.1DThe daily chart for Bitcoin (BTC/USDT) illustrates a downward trend with a descending trendline that marks the resistance level (R1). Currently, Bitcoin is priced at $60,082.01, with a significant support level (S1) at $63,097.93, which it has recently broken through. The next support levels are at $59,065.59 (S2) and $56,226.29 (S3).
The resistance marked by the descending trendline and the resistance level (R2) at $74,007.06 highlight areas where sellers have previously entered the market, capping upward price movements. The price failing to maintain above S1 suggests that the bearish momentum may continue.
The RSI is at 36.25, which is close to being oversold, indicating that the market could potentially see a reversal or at least a temporary halt in the downward momentum if buyers step in. The MACD is below zero and shows a continuation of the bearish momentum as the histogram bars are expanding in the negative territory.
For traders, monitoring the price action near the next support levels (S2 and S3) could be critical. A rebound from these levels could provide long entry opportunities, ideally with confirmation from bullish divergence in the RSI or a bullish crossover in the MACD. If the price continues to decline through these supports, it could indicate a stronger bearish trend with lower targets in view. Conversely, a break above the trendline and R1 could signal a potential reversal to bullish conditions, targeting higher resistance levels.
Bitcoin can exit from pennant, turn around, and then start riseHello traders, I want share with you my opinion about Bitcoin. Looking at the chart, we can see how the price some days ago reached the 68800 level, which coincided with the seller zone and soon broke it, after which continued to move up. Later, the price rose to the resistance line and then at once made a downward impulse to the support line, which coincided with the support level and buyer zone, thereby breaking the 68800 level again. Then the price started to rise to the resistance level, and when BTC reached it, the price broke it one more time and rose to the resistance line, but then Bitcoin at once bounced down to the support line, breaking the resistance level. Next, the price rebounded from the support line and made an impulse up a higher resistance level with line, breaking them, after which BTC turned around and started to decline inside a downward pennant. Inside the pennant, the price broke the 68800 level, and soon the support line too, after which Bitcoin fell lower buyer zone to the support line of the pennant, breaking the 61500 level as well. But a not long time ago price turned around and made an impulse up to the resistance line, making a fake breakout of the 61500 level, after which BTC rebounded from this line and fell to the support line. Now, the price continues to trade near this line and I think Bitcoin can exit from the pennant and decline to the support level. After this movement, the price will turn around and start to grow, therefore I set my target at the 65800 level. Please share this idea with your friends and click Boost 🚀

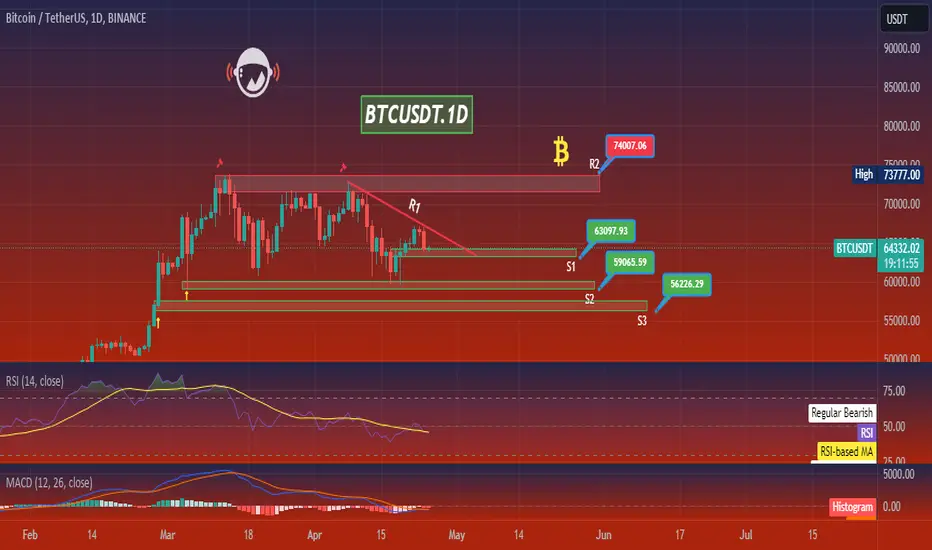
BTCUSDT.1DThe daily chart for Bitcoin (BTC/USDT) shows that Bitcoin is currently in a consolidation phase, with the price hovering around $64,406. The chart displays key resistance (R1) at $67.028.28 and subsequent resistance (R2) around the all-time high of $73,777.00. Support levels are evident at $63,097.93 (S1), $59,065.59 (S2), and a stronger historical support at $56,226.29 (S3).
The RSI is neutral, hovering around 45.60, which doesn't signal an overbought or oversold market. The MACD is slightly below the signal line, indicating bearish momentum, though the histogram shows it’s lessening, which could prelude a potential reversal or stabilization.
Trading strategy could focus on the breakout or bounce from these key levels. A break above R1 could indicate potential bullish momentum, while a fall below S1 might suggest further decline towards S2 or S3. As always, confirmation from other indicators and volume should be considered for a comprehensive analysis.
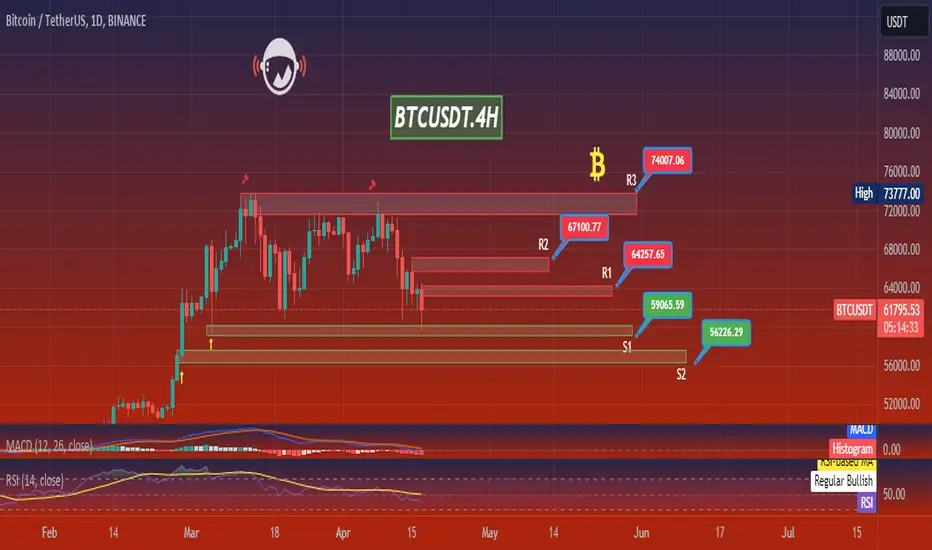
BTCUSDT.4HIn this technical analysis of the BTC/USDT 4-hour chart, we see that Bitcoin has been trading within a defined range, showcasing key resistance (R) and support (S) levels. The price is currently hovering around R1 at $64,257.65, with immediate support (S1) at $59,065.59.
A bearish trend was evident as the price made lower highs, confirmed by the Relative Strength Index (RSI) lingering below the 50 mark, indicating that the bears have had the upper hand recently. The histogram on the Moving Average Convergence Divergence (MACD) is in the negative territory, which further supports the bearish sentiment.
The RSI is close to the oversold region, which could imply a potential reversal or at least a temporary pullback. Traders might be watching for a break above R1 as a sign of bullish momentum, potentially aiming for R2 at $67,100.77 and the high pivot at $73,777.00. Conversely, a break below S1 may lead to further decline towards S2 at $56,226.29.
It’s worth noting that the RSI and MACD are just two indicators, and they should be used in conjunction with other technical analysis tools and fundamental analysis for a more comprehensive trading strategy. This analysis is based on current chart patterns and indicators, and the crypto market is known for its volatility, so I would keep an eye out for any news or events that could impact market sentiment.
🔥 Bitcoin In Area Of DANGER: Macro Signal! 🚨In this analysis I want to take a look at one of my more popular indicators; Bitcoin's Logarithmic Price Bands. In case you want to know more about this indicator, please check out the link on the bottom of this post.
Back in March I made an analysis with the same title, where I argued that Bitcoin had entered an area of danger (the yellow mid band of the indicator).
The yellow band has historically proven to be a strong resistance. With BTC retesting the bottom support of the yellow band there's a serious risk of BTC falling through, resulting in further selling.
It's too early to tell whether BTC will correct all the way back to the green band, like last cycle. Nevertheless, the indicator has again proven to offer significant long-term trading opportunities.
How low do you think that BTC will go? Happy to hear your thoughts 🙏

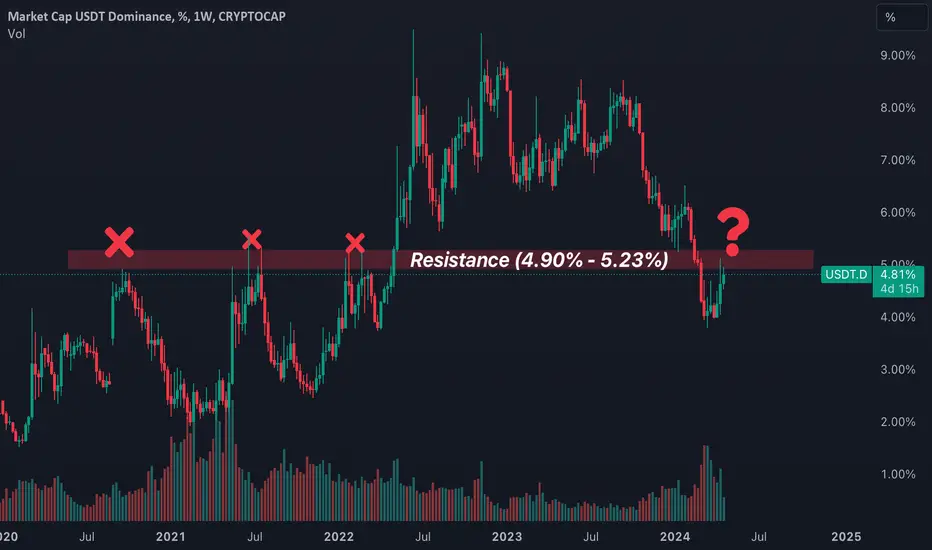
USDT Dominance
It's Strongly Rejecting The Resistance (4.90% - 5.23% )....
BreakOut Will Lead Crypto Market To Bleed
BreakDown Will Turn Crypto Market Into Bullish
USDT Dominance Works Opposite To Crypto Market
Let’s Wait And Watch Which Side Will Be Played Out!
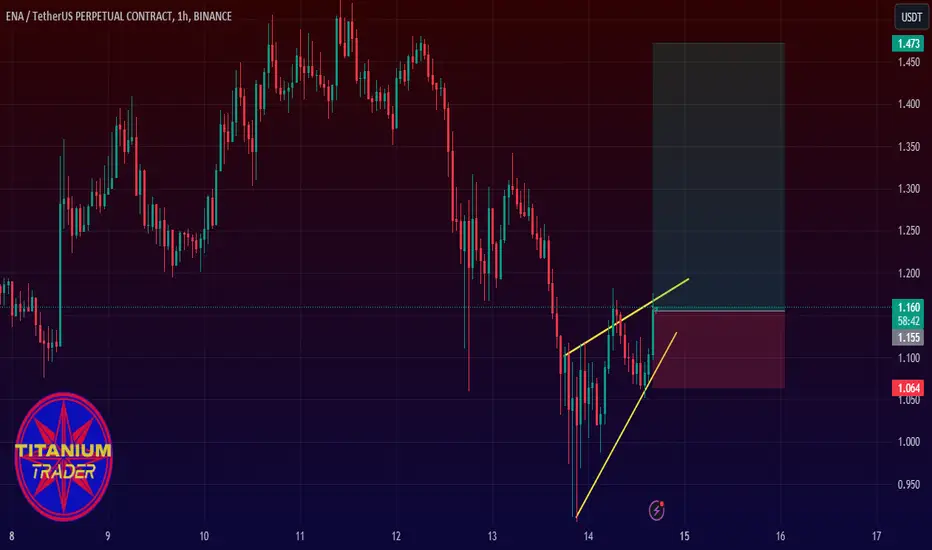
ENA EYES ON 40% GROWTHENA is one of those coins which recovered fast after huge dump, currently showing bullishness.
Successful momentum might lead towards 1.50
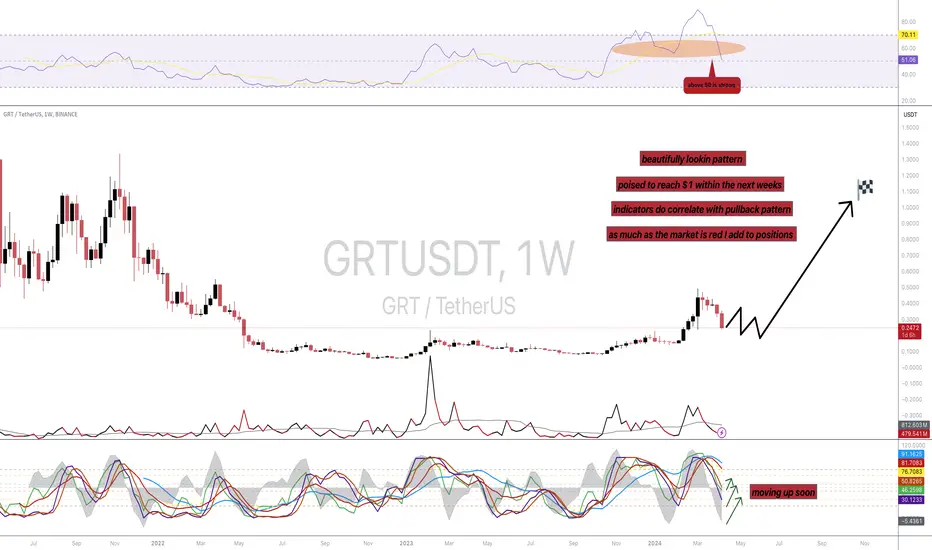
RED! Long RED!Evening fellas,
This chart to me looks like one of the best.
I think its a cup and handle formation building-up.
Keep an eye on it.
Trade thirsty.
Bitcoin can make small correction and then continue growHello traders, I want share with you my opinion about Bitcoin. By observing the chart, we can see that the price recently rose to the resistance level, which coincided with the seller zone and even entered to this zone. However, it soon turned around and made a downward impulse lower the 66500 level, breaking it and the 71000 level too. After this, the price declined lower buyer zone, but later BTC turned around and started to move up in upward channel, where the price soon reached the 66500 level and broke it again. Then price in a short time rose to the channel's resistance line, after which it fell to the support level back, and then at once continued to move up. Soon, Bitcoin reached a resistance level, after which it broke it and soon exited from the channel, but then the price turned around and started to decline in a downward pennant. In this pattern, the price declined lower 71000 level, breaking it one more time, and soon fell to the support line of the pennant, after which BTC in a short time rose back to the resistance level. But a not long time ago, the price rolled down from this level and now trades close to the resistance level and line of the pennant. So, in my opinion, Bitcoin can fall to the support line and then bounce up to the seller zone, thereby exiting from the pennant and breaking the resistance level. After this, I also think BTC will continue to move up, therefore I set my target at 72200 points. Please share this idea with your friends and click Boost 🚀
NEOUSDT 1W LONG📈Hi all. Timeframe 1 week. NEOUSDT, after a decline, is in accumulation with increased volumes. Fractal of past decline and accumulation, and subsequent growth. I’m considering recruitment to the spot now, with a possible addition from the green zone. Also long during breakout/retest. Let me remind you that the entry at the retest is the safest, but it may not be there if there is a strong exit from the accumulation. It all depends on your trading strategy. Marked goals and levels on the chart.

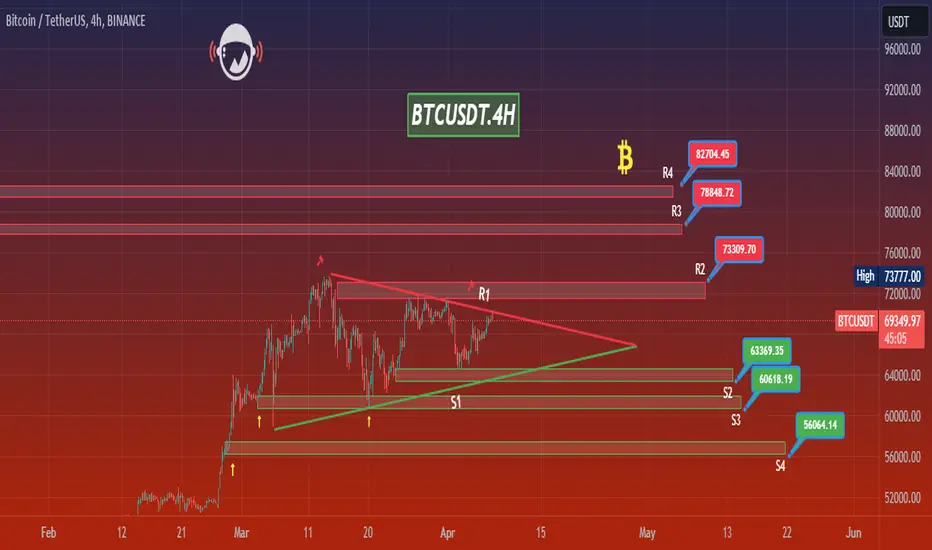
BTCUSDT.4HIn this 4-hour Bitcoin (BTC) to USDT (Tether) chart, we're seeing several technical indicators and tools applied to determine the market's trajectory. This includes the RSI (Relative Strength Index), MACD (Moving Average Convergence Divergence), and multiple support (S1, S2, S3, S4) and resistance levels (R1, R2, R3, R4).
The RSI is showing a value slightly above 50, suggesting a neutral to mildly bullish sentiment as it is not within the overbought (above 70) or oversold (below 30) areas. Meanwhile, the MACD is providing a bullish signal with the MACD line (blue) above the signal line (orange), indicating that upward momentum may be building.
The price appears to be approaching a resistance level (R2) at approximately $73,390.70, which could act as a barrier to further upward movement. Should the price break above R1, it could suggest a continuation of the bullish momentum, potentially aiming for the next resistance level at R3 ($78,848.72) and beyond.
On the downside, the nearest support level (S1) lies at around $63,369.35. This level, along with subsequent supports S2 ($60,618.19) and S3 ($56,064.14), could serve as areas where buyers might step in to prop up the price if a retracement occurs.
Notably, the chart also shows an ascending triangle pattern forming, with the flat upper resistance line and the rising lower support line converging. This pattern often indicates continuation, so if I were assessing this chart, I’d be watching for a potential breakout above R1, which might be confirmed by increasing volume.
However, trading within the triangle could continue until a breakout or breakdown occurs. Hence, it’s critical to monitor how the price reacts to these levels. A breakout accompanied by high volume would increase the likelihood of the move being sustained.
In conclusion, while the chart suggests a potential bullish scenario, a trader must be prepared for any outcome, including false breakouts or reversals. As such, I’d have a risk management strategy in place, possibly setting stop losses below the latest swing low or support levels. It's also important to stay informed on the broader market sentiment and news that could impact Bitcoin's price.
Bitcoin can reach resistance level and then rebound downHello traders, I want share with you my opinion about Bitcoin. Observing the chart, we can see that the price some days ago rebounded from the support line and made a strong upward impulse to the support level, which coincided with the buyer zone. After this, BTC in a short time broke the 60800 level, made a retest, and continued to move up to the resistance level, which coincided with the seller zone. Price even entered to seller zone, but soon turned around and declined lower the 71250 level, making a fake breakout. Also then price started to trades in the range, where firstly it broke support line and fell to the support level. Then Bitcoin rebounded from the 60800 support level and made impulse up to the seller zone, but when it reached this area, the price at once exited, making a fake breakout of the resistance level. Next, the price some time traded near the resistance level and then declined below, but a not long time ago BTC turned around and started to grow, so now it trades near the 71250 level. Now, I think that Bitcoin can reach a resistance level and then rebound down. For this case, I set my 1st Take Profit at the 65000 level. Please share this idea with your friends and click Boost 🚀
