btcusd started bull run soonThe upcoming Bull Run for Bitcoin is expected to reach significant levels of capacity, with updates on prices coming as signals are received. The Bull Run is anticipated to occur by today at 8 pm or possibly sooner. In the worst-case scenario, it might happen overnight while we're asleep, based on Pacific Time, but indicators suggest a high likelihood of it happening soon.
The surge in activity is attributed to the low volume of whales, indicating a mega Bull Run. This signal emerged on march 30th and is closely tied to volume, particularly reflecting retail traders selling at losses. The whales, large investors in the cryptocurrency market, have evidently decided that it's time to accumulate again.
While there's a possibility of delay, it's also conceivable that the Bull Run could happen even quicker than anticipated. This information is shared based on observations and analysis of whale activities.
@houseofcryptotrader
Btc-usdt

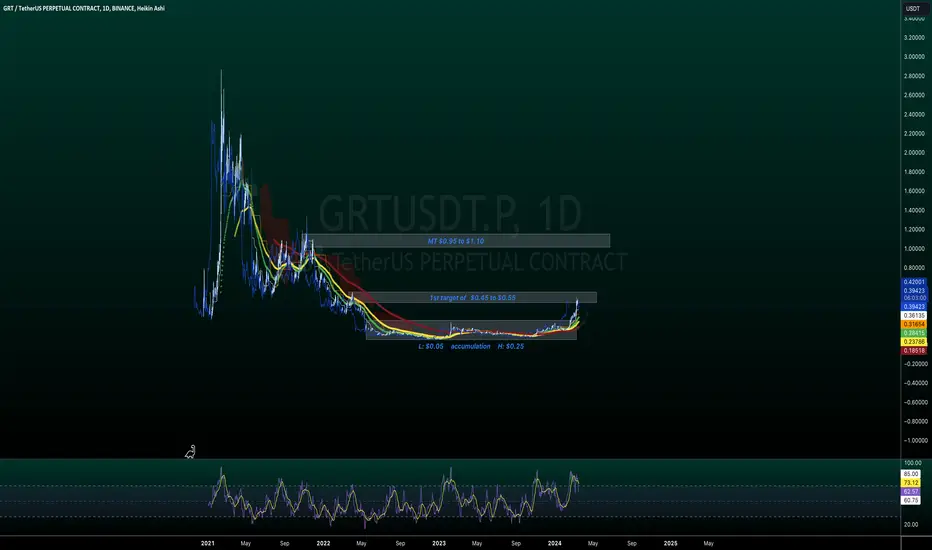
GRT a simple fact. It's bound to succeed Hello again,
This is a setup that I was able to join later in the game with a position around the $0.25 cents but I do consider that a price of accumulation anyway.
It's a little bit higher now but I see it's got the potential to reach $1 dollar easy. So it's a long for me and I'll see you there at the $1 mark.
Trade thirsty, my friends!
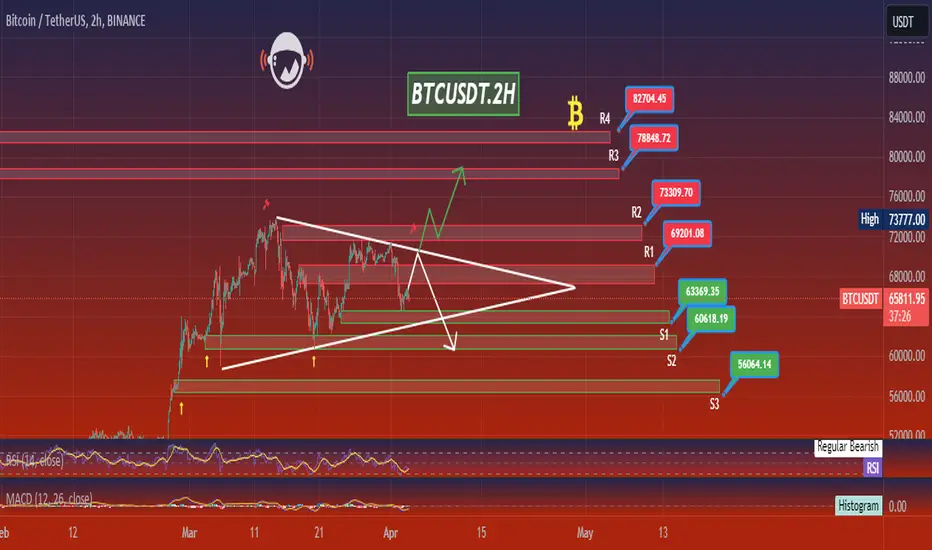
BTCUSDT.2HLooking at this chart, I'm observing Bitcoin's price action against Tether (USDT) on the Binance exchange. We're using a combination of technical indicators and price levels to gauge potential future movements.
Firstly, the chart shows a symmetrical triangle pattern forming, which indicates a period of consolidation. A symmetrical triangle is typically considered a continuation pattern, meaning that the previous trend is likely to continue once the price breaks out. However, the direction of the breakout (upward or downward) is not determined by the pattern itself but by other indicators and market sentiment.
The Ichimoku Cloud is present here, which consists of several components. The cloud (Senkou Span A and B) acts as support and resistance levels. The price is currently below the cloud, suggesting a bearish sentiment. The Ichimoku Base Line (Kijun-sen) is above the Conversion Line (Tenkan-sen), which typically indicates bearish momentum.
We've also got pivot point levels marked as R1, R2, R3, and S1, S2, S3. These levels are used to determine potential support and resistance levels based on previous highs, lows, and closing prices. Currently, the price is hovering just above the S1 pivot point level. If it breaks below S1, the next levels to watch would be S2 and potentially S3 for support.
The Relative Strength Index (RSI) is just below 40, which is neither in the overbought nor oversold territory but is edging closer to oversold levels. This could indicate that there might be some buying pressure coming in soon, but it's not a guarantee.
The Moving Average Convergence Divergence (MACD) shows the signal line above the MACD line, and the histogram is in the negative territory, which supports the bearish momentum seen in the price action and the Ichimoku Cloud indicators.
In summary, the current setup is leaning more bearish, with the price below the Ichimoku Cloud and pivot point supports. The symmetrical triangle pattern suggests a breakout is imminent. If I were trading this setup, I would watch for a decisive breakout from the triangle pattern and confirm it with other indicators such as the RSI and MACD before making a trade. If the price breaks above the triangle and the cloud, that would be a bullish signal, while a break below could see further downside movement. It's important to keep an eye on the volume to confirm the breakout's strength and look out for any potential false breakouts.
BitCoin / BtcUsdta deep fall possibility
be careful for your long positions
( many thanks to Ms.Amiri <3 )
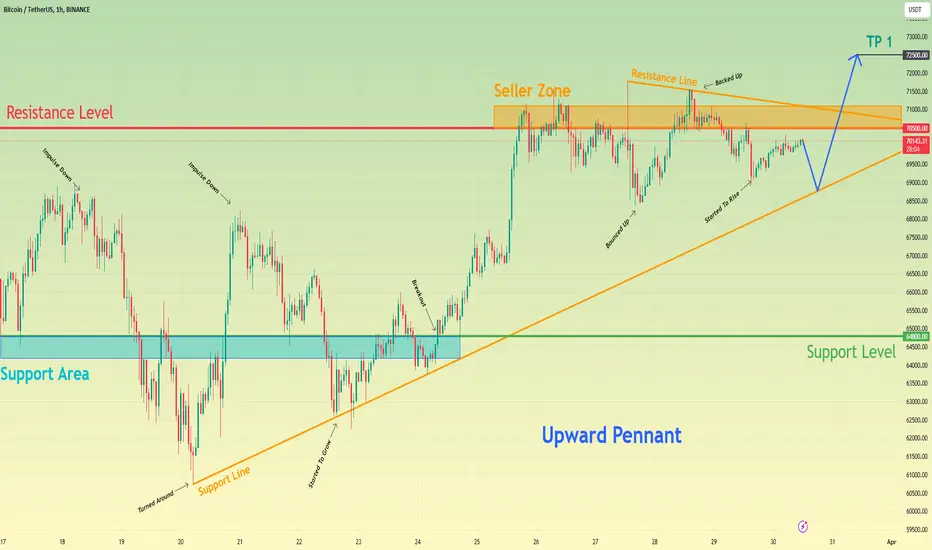
Bitcoin can correct to support line and then make impulse upHello traders, I want share with you my opinion about Bitcoin. A not long time ago price rebounded from the support level, which coincided with the support area, and in a short time rose to 69000 points, after which turned around and made a strong downward impulse to lower the 64800 level, breaking it. After this movement, BTC started to trades in an upward pennant, where rebounded from the support line and quickly rose to 68200 points, breaking the support level again, but soon price repeated a downward impulse and fell back to the support line, breaking the 64800 support level one more time. Soon, BTC started to grow and in a short time reached the support level, broke it, and finally continued to move up to the resistance level, but firstly it made a retest of the support level and only then continued to grow. When the price reached a resistance level, which coincided with the seller zone, BTC broke it, and some time traded in this zone, after which made a small correction below. Later price rose to the resistance line of the pennant, after which rebounded down, and at the moment price trades very close to the resistance level. For this case, I think that Bitcoin can make a correction movement to almost the support line and then the price will impulse up a higher resistance line and 70500 level, thereby exiting from the pennant. After this, I think BTC will continue to grow to 72500 points. Please share this idea with your friends and click Boost 🚀
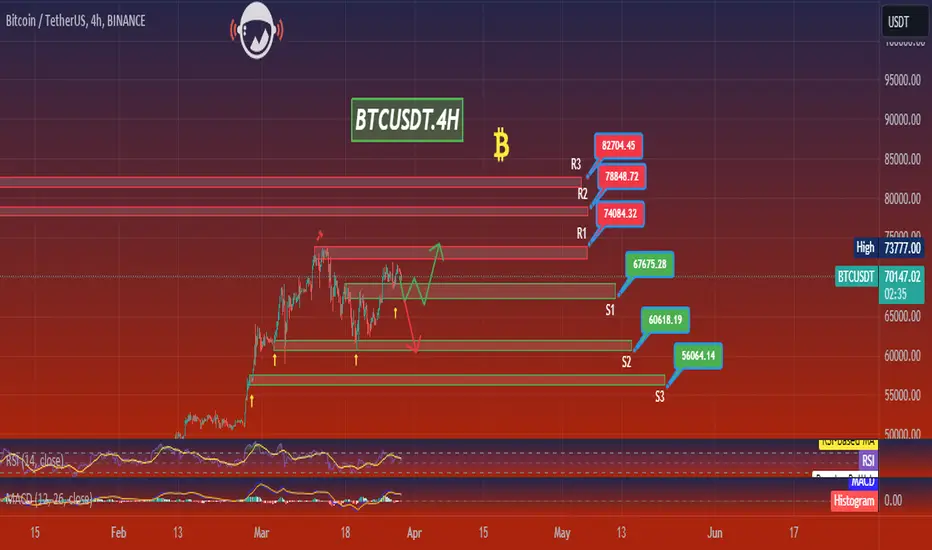
BTCUSDT.4HIn this BTC/USDT chart, the overall structure is bullish, as indicated by the price being well above the Ichimoku Cloud. However, currently, the price action is showing some consolidation after a significant uptrend.
The Ichimoku Cloud's span is wide, which usually represents a strong trend, but the price nearing the Conversion Line (blue) might suggest a short-term retracement or consolidation phase. The Lagging Span is above the price action and cloud, reinforcing the bullish sentiment over the longer period.
The RSI is around 55, which is fairly neutral and gives room for movement either way without immediate overbought or oversold concerns. This is indicative of potential further upward movement if the market sentiment remains bullish.
The MACD shows the histogram trending downward, and the MACD line is below the signal line, suggesting that the bullish momentum is currently weakening. A close watch is necessary here as this might signal the onset of a bearish phase or just a temporary pullback within a larger bullish trend.
Key resistance levels are identified as R1 at 74084.32 USDT, R2 at 78848.72 USDT, and R3 at 82704.45 USDT. These are important barriers for the bulls to overcome to continue the upward trajectory. On the flip side, support levels are found at S1 (67238.06 USDT), S2 (60665.16 USDT), S3 (56202.15 USDT), if a bearish reversal occurs.
My analysis suggests a cautious approach. The potential for continuation of the bullish trend is there, but the recent weakening momentum warrants vigilance. I would consider taking a long position if the price bounces off the Conversion Line with strong volume and an RSI that avoids the overbought territory. A close below the Cloud might shift my stance to bearish, considering short positions towards the nearest support levels.
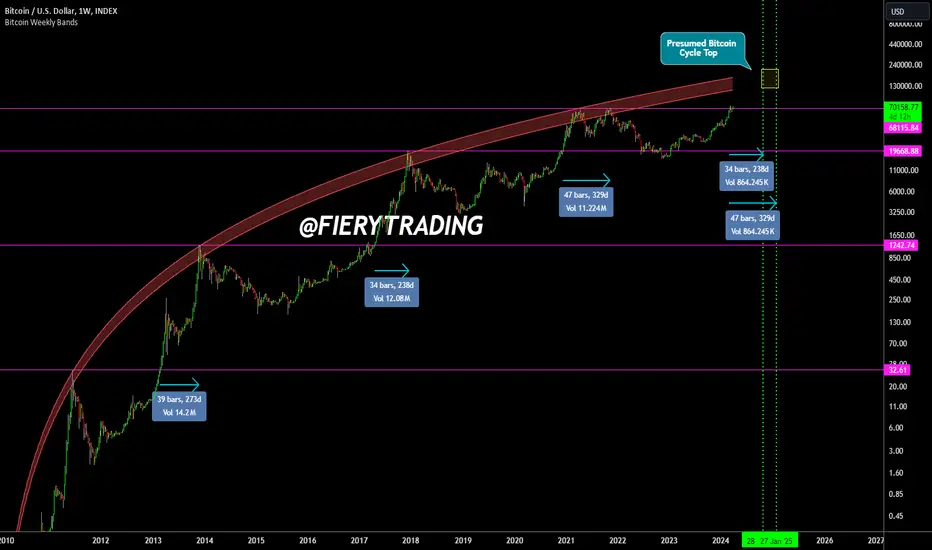
🔥 Bitcoin: The Most Accurate Cycle Top Forecast To Date! 🚨Preface
This analysis is based on historical price action. Since BTC only had a couple of cycles before, the data presented is based on just a few observations. Furthermore, this analysis will use calculations based on a mathematical model based on these few observations.
TLDR/Summary at the bottom.
Goal of this analysis
In this analysis I'm going to take an attempt at making an educated guesss at when Bitcoin will top, and around which value it will top. With the information at hand, I'm reasonably certain that this is one of the best forecasts currently on the market.
Indicators and Assumptions
The first indicator on the chart is the Bitcoin Logarithmic Bands indicator, a personally made indicator which tries to calculate a Bitcoin top during a certain time frame by calculating a bottom and top band within BTC will top. More information below:
The second indicator (or better said, assumption) that we use is the fact that Bitcoin has previously always topped between 34 - 47 weeks AFTER closing a weekly candle above the previous all-time high. I came to this conclusion after making this analysis below:
Making the calculation
34 weeks after the 4th of March = 28th of October.
47 weeks after the 4th of March = 27th January.
If the above will remain true for this cycle, we can expect Bitcoin to top between October 28th 2024 and 27th of January 2025.
Now that we know the dates, we can also easily calculate the values. Naturally, we assume that the Bitcoin Logarithmic bands indicator will hold.
(rounded for readability)
28-10-2024 lower band: 135.000$
28-10-2024 top band: 195.000$
27-01-2025 lower band: 144.000$
27-01-2025 top band: 208.000$
Summary
Based on the "New ATH to Top" model and the "Bitcoin Logarithmic Bands" model, we calculated that Bitcoin will top between 28-10-2024 and 27-01-2025, with a value between 135.000$ and 208.000$.
Enjoy this analysis? Leave a like and a comment 🙏
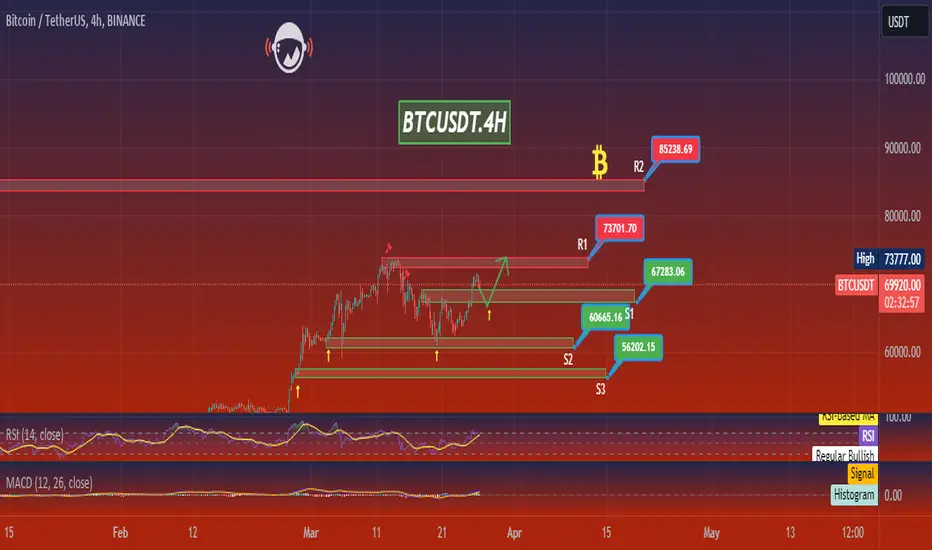
BTCUSDT.4HAs I review the 4-hour chart for BTC/USDT, my focus is immediately drawn to the Ichimoku Cloud. The price action is currently above the cloud, indicating that the market is in a bullish phase in this time frame. The cloud is expanding, which suggests increasing volatility and potential trend strength.
Looking at the Ichimoku components, the conversion line (blue) is above the baseline (red), reinforcing the bullish sentiment. However, the lagging span is within the price action, which typically calls for caution as it may suggest potential resistance or a lack of clear trend.
The RSI is around 63, which is on the higher side but not yet in the overbought region. This implies there could be more room for upside before the market becomes overheated.
The MACD indicator shows the MACD line above the signal line but both are converging towards the zero line, indicating that the bullish momentum may be slowing down. The histogram is small and fluctuating above and below the zero line, reflecting the current market indecision.
Key resistance (R1) lies at 73071.70 USDT, which has not been breached recently. Key supports are identified at 67238.06 USDT (S1) and 60665.16 USDT (S2). The presence of another support level (S3) at 59020.15 USDT suggests significant downside protection.
As a trader, I would be watching for the price to stay above the cloud, and a push above R1 could offer a potential entry point for a long position with a target near the recent high around 73777 USDT. Conversely, a drop below the baseline of the Ichimoku cloud could signify a short-term bearish reversal, and I would then consider a short position with targets at S1 and potentially S2 if the downtrend persists.
Given the current chart configuration and my belief in Bitcoin's long-term value, I would favor a bullish stance but would remain vigilant for any signs of a trend reversal, and keep an eye on market news and global economic factors that could influence Bitcoin's price.
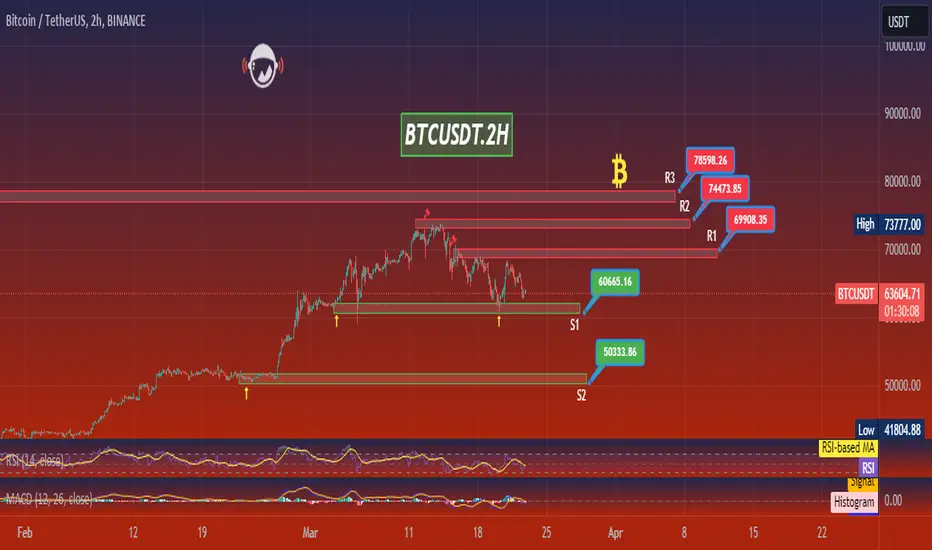
BTCUSDT.2HThis Bitcoin (BTC) chart against the US Dollar (Tether, USDT) on the 2-hour time frame provides a rich set of data for a technical analysis perspective:
Ichimoku Cloud: Price is currently below the Ichimoku Cloud, which typically suggests a bearish trend. The cloud acts as a dynamic resistance area.
Resistance Levels (R1, R2, R3): The chart shows multiple resistance levels. The closest one, R1, is significantly above the current price, indicating that there might be a strong move required for the price to reach these levels again.
Support Levels (S1, S2): There are also two support levels identified. S1 is a short distance below the current price, indicating a potential area where the price might find support if it continues to decline.
RSI (Relative Strength Index): The RSI is hovering around 45, which is somewhat neutral. It indicates there's neither a strong buying nor selling pressure currently driving the market.
MACD (Moving Average Convergence Divergence): The MACD line is below the signal line, and the histogram bars are red and growing, which points to increasing bearish momentum.
Volume: The bars below the price chart depict trading volume, and a mix of red and green suggests a battle between buyers and sellers with no clear winner at the moment.
Conclusion:
The market sentiment for BTC/USDT, based on this chart, seems to be leaning toward the bearish side, as indicated by the price being below the Ichimoku Cloud and the MACD showing a bearish crossover. The RSI's neutral stance suggests that there could be potential for either direction, but current indicators lean more towards a bearish trend.
If considering trading based on this chart, it might be prudent to watch for potential bounces off the support levels for buying opportunities or breaks below support as a signal for potential short positions. The resistance levels serve as targets for any bullish reversals or as potential exit points for short positions. However, a trader should use additional confirmation from other indicators, news, or market sentiments before making any trading decisions. Always remember to set appropriate risk management measures like stop losses, especially in the volatile cryptocurrency market.
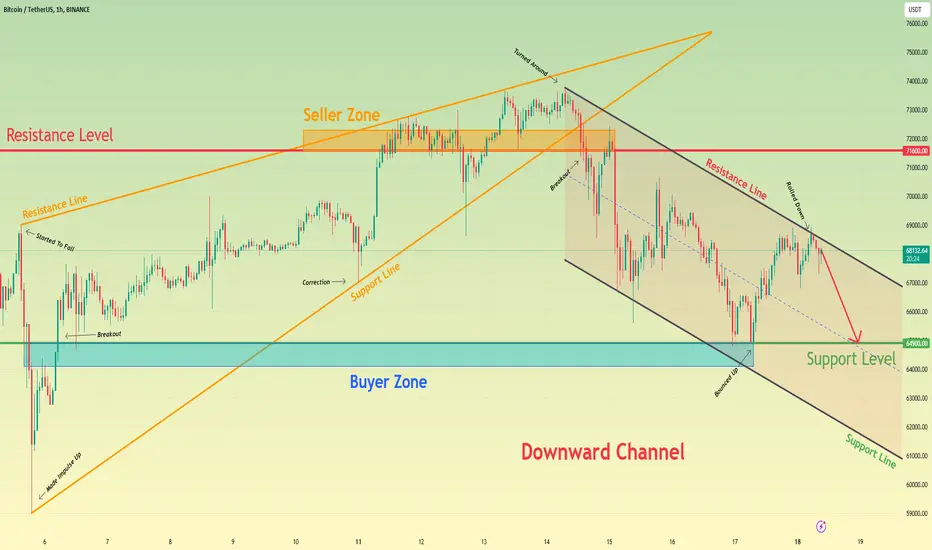
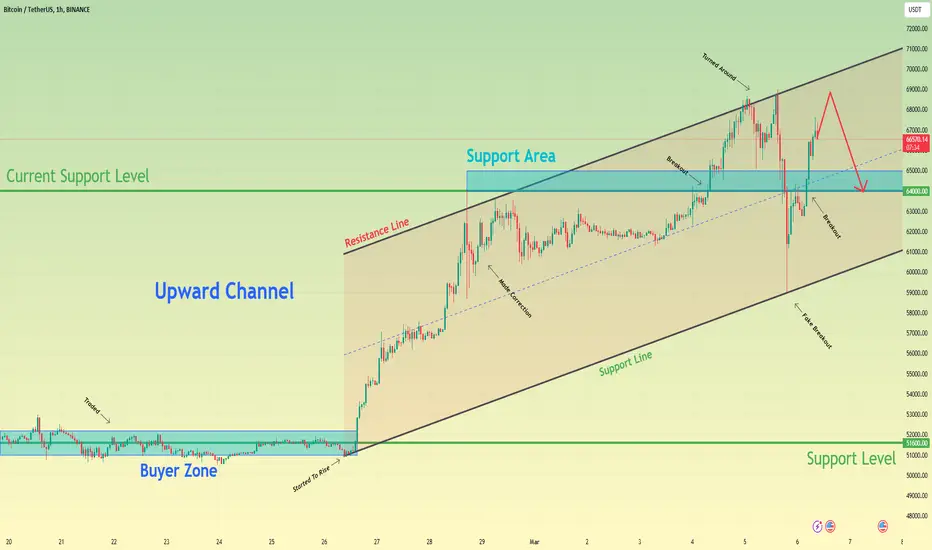
Bitcoin can continue to decline in downward channelHello traders, I want share with you my opinion about Bitcoin. Observing the chart, we can see that the price not long ago entered to wedge, where it first rebounded from the resistance line and quickly declined to the support line, breaking the 64900 level, which coincided with the buyer zone. After this, BTC bounced from the support line of the wedge and made a strong upward impulse higher than the 64900 level, breaking it again, and then the price continued to move up in the wedge. But later, it made a correction to the support line, after which BTC turned around and rebounded up to the resistance level, which coincided with the seller zone. Soon, the price broke the 71600 level and some time traded in the seller zone, after which the price rose almost to the resistance line and turned around. After this, BTC started to decline in a downward channel, thereby exiting from the wedge and also soon broke the 71600 resistance level. In the channel, the price declined to the support level, but recently it rebounded and rose to the resistance line of the channel, and at once rolled down. So, in my opinion, Bitcoin can continue to decline in a downward channel, therefore I set my target at the 64900 support level. Please share this idea with your friends and click Boost 🚀
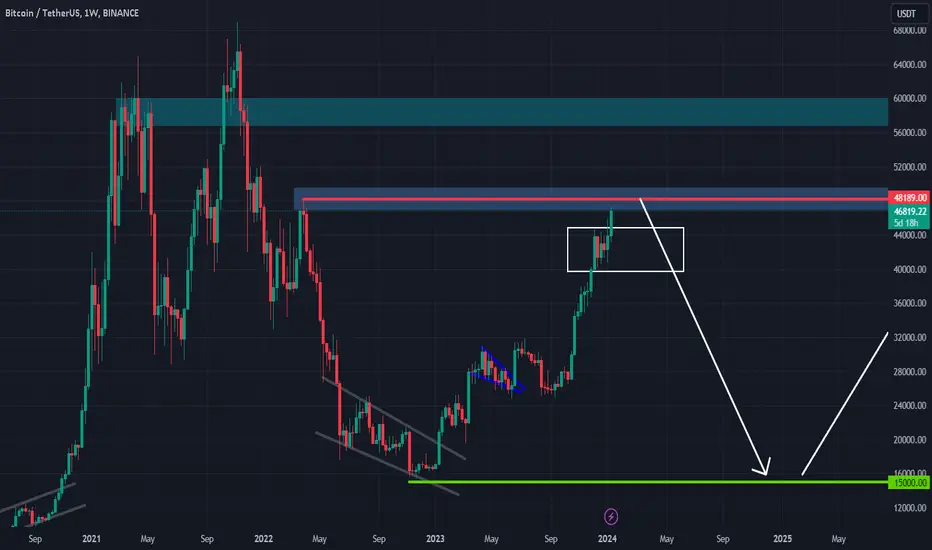
More correction for BTC? USDT just hit the support on weekly!Hello everyone,
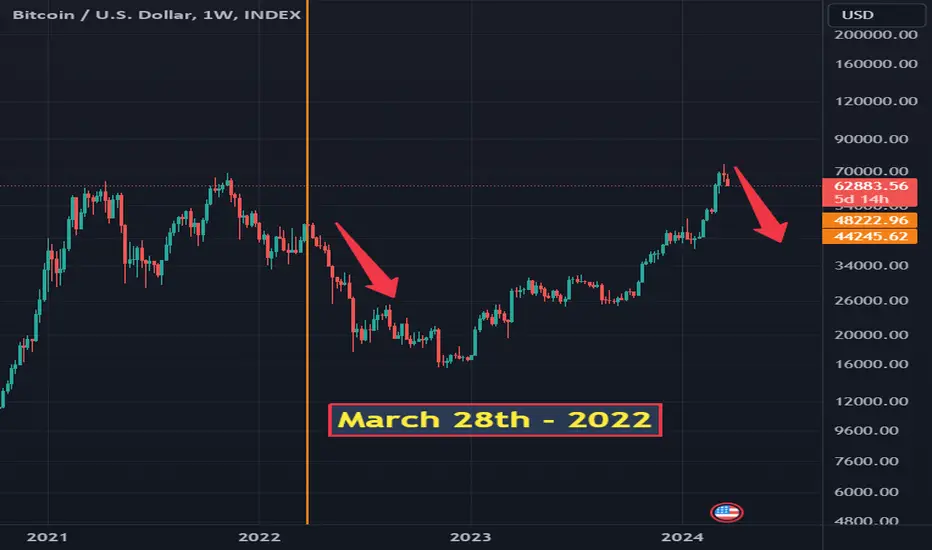
Let's take a closer look at what's happening with USDT (Tether) dominance on the weekly charts and how it might be signaling a key movement in the crypto space. Now, we've noticed that USDT dominance seems to be hitting a support level and is starting to climb up. This is quite significant because USDT dominance reflects Tether's share of the total crypto market cap. When traders and investors start moving their funds into USDT, it's often a move to safety, especially when the market shows signs of volatility or a potential downturn.
Now, here's where it gets interesting. If we flash back to March 28, 2022, we can see a similar situation unfolding – USDT dominance found support, and this correlated with a notable correction in the price of Bitcoin. We're spotting what could be a repeating pattern here. The climb in USDT dominance could be indicating that once again, traders might be hedging against current market movements, signaling caution as we see capital flowing into the stablecoin – a classic move during times of uncertainty.
let's dial into the situation we're seeing here. We've identified a possible pattern with USDT dominance suggesting that we might be in for a market correction. The last time we saw something like this, we were deep in a bear market. Now, the dynamics are slightly different. We're approaching a Bitcoin halving event.
Historically, halvings tend to have bullish implications for Bitcoin due to the reduced supply of new bitcoins entering the market. However, the anticipation of such events can bring about increased volatility. If we're drawing parallels with the last occurrence, we should consider that although history doesn't always repeat itself, it often rhymes.
How much of a correction could we see? That's the million-dollar question. Corrections in a pre-halving period can vary widely. They could be short and sharp, or slightly deeper as traders position themselves ahead of the event. What's important to note is that while we could see a dip in response to the rising USDT dominance, the upcoming halving could also provide a counterbalance to a lengthy bearish trend.
Keep in mind, corrections are a natural part of market cycles, even when an overall bullish sentiment is expected. They offer a reset, a breath for the market to consolidate before the next potential move. The key takeaway here is not the correction itself but how we position ourselves to manage it and potentially take advantage of the opportunities it presents.
As always, my advice is not to fixate on the depth of a potential correction but rather to focus on your strategy. Do you have your risk management in place? Are you diversified enough to handle unexpected shifts? These are the factors within your control.
Let's watch the charts, stay informed on global market trends, and remember, the halving is coming up, which could add a whole new dimension to the typical market ebb and flow. Trade wisely, everyone
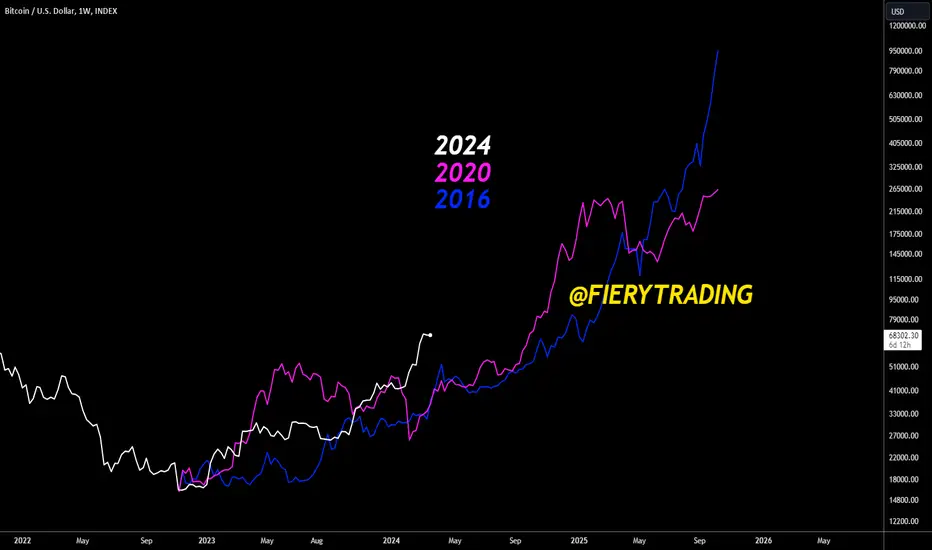
🔥 Bitcoin In The Biggest Bull-Run Since 2016? Let's Discuss!Bitcoin has been performing exceptionally well over the last months. This cycle is the first cycle where Bitcoin has made a new all-time high (ATH) before the halving, instead of after. The most likely cause for this are the massive ETF inflows which boosted the price to new highs.
Historically, Bitcoin has always peaked in Q4 of the next year after the halving. In this case, it would mean that BTC will peak in Q4 of 2025. Seeing that we're already at 70k in Q1 of 2024, this could lead to some issues.
There's a few possible outcomes and explanations that I want to share.
1: This cycle will be similar to 2016 and we will continue to go up in a relatively stable straight line until Q4 of 2025. Bitcoin could reach >300k because of the continued buying power from ETF's.
2: This cycle is outperforming the past cycles, which is not possible due to diminishing returns theory (bull and bear markets will be less extreme). Considering that we "should" top in Q4 of 2025, we will see a long period of sideways/bearish price action in order to get the white line under the blue and purple lines. Top will be in Q4 of 2025, but a lot lower. Think 150k.
3: Diminishing returns theory will hold, but we will top much earlier than Q4 2025. In another analysis that I recently made I discussed the fact that BTC on average tops 40 weeks after a new all-time high has been made. This would lead to a cycle top in Q4 of 2024. With Diminishing returns still in play I'd guess we can top somewhere between 100k-150k.
It's going to be interesting to see which historically accurate theories will be broken this cycle, seeing that this is the first time that BTC made a new ATH before the halving. Best case scenario would be a long cycle with a price as high as possible.
What is your view on a new ATH before the halving? Which scenario do you deem most likely? Share your thoughts.
🔥 Bitcoin Short-Term Reversal Play: Bottom In?BTC has dropped over 10% in the last two days. In my eyes, the bottom could potentially be in based on the parallel channel drawn on the chart.
Alts took another beating. If this reversal plays out both alts and BTC are in for a treat.
For now, I expect a retest 67.500$. Stop below the recent swing-low and a target at the yellow top resistance.

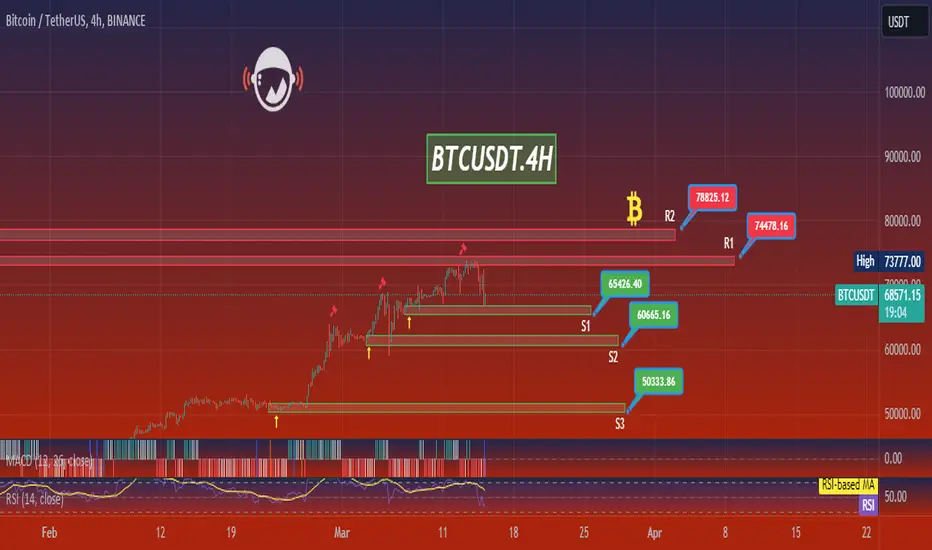
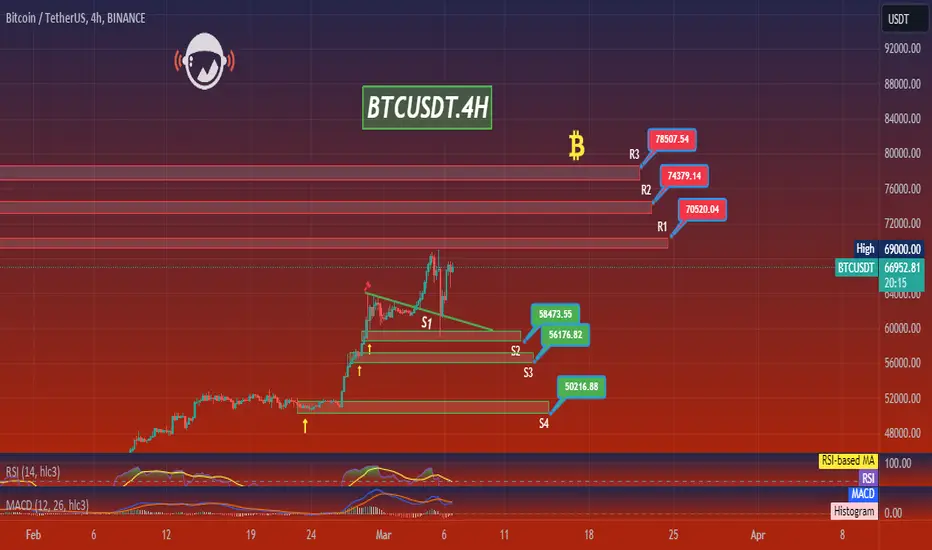
BTCUSDT.4HIn this Bitcoin to Tether (BTC/USDT) chart, we're looking at a downward movement indicated by the recent red candlesticks.
Bollinger Bands: The price has moved sharply down and is currently at the lower Bollinger Band, which often acts as a dynamic support level. A breach below this band could indicate a strong bearish trend, while a bounce from it could signal a potential reversal or consolidation.
Resistance Levels (R1, R2): Resistance levels at 74,379.14 USDT and 78,507.54 USDT have been marked. If a reversal occurs, these levels could act as potential targets for taking profits or reassessing the position.
Support Levels (S1, S2, S3): There are several support levels identified: 65,426.40 USDT (S1), 60,045.16 USDT (S2), and a lower support at 50,313.86 USDT (S3). These levels could be where buyers might step in, providing opportunities to enter long positions with a risk-managed approach.
Volume Bars: The volume bars show significant activity during the downward price move, which suggests that there's conviction behind the sell-off.
RSI: The Relative Strength Index (RSI) is nearing the oversold territory, indicating that the market may be due for a reversal or pause in the downward momentum.
Conclusion:
The combination of hitting the lower Bollinger Band and the RSI nearing oversold levels might provide a basis for a potential reversal or relief bounce soon. I would keep a close eye on the support levels, especially S1, for evidence of buying interest. If the price stabilizes or bounces off S1, it could provide a good risk-to-reward entry point for a long position, with a stop loss placed just below S1 to manage risk. However, if S1 fails to hold, my attention would shift to the next support level at S2.
I'd remain cautious and ready to act on new information, as the high selling volume and the current momentum could indicate further downside. Technical analysis provides guidance but it's not infallible, so I would also consider wider market sentiment and news that could impact the price action.
BTC 313 K $ Target - Satoshi is same Messias , the survivor Everything is visible on chart
Satoshi is same Jewish promisen survivor
Yahadút

🔥 A Simple Guide To Sell The Bitcoin TopIn this analysis I want to talk about the upcoming Bitcoin top, and how to make sure you will exit at the "right" time.
As seen on the chart, every past cycle has topped at, or close at the purple RSI resistance drawn on the bottom half of the chart.
The strategy is simple, sell your BTC's in the month that the RSI has hit the top resistance. And Ideally, buy them back at a discount once the RSI hits the bottom support.
You will likely not catch the exact top, but will catch the top area better than 90% of traders.

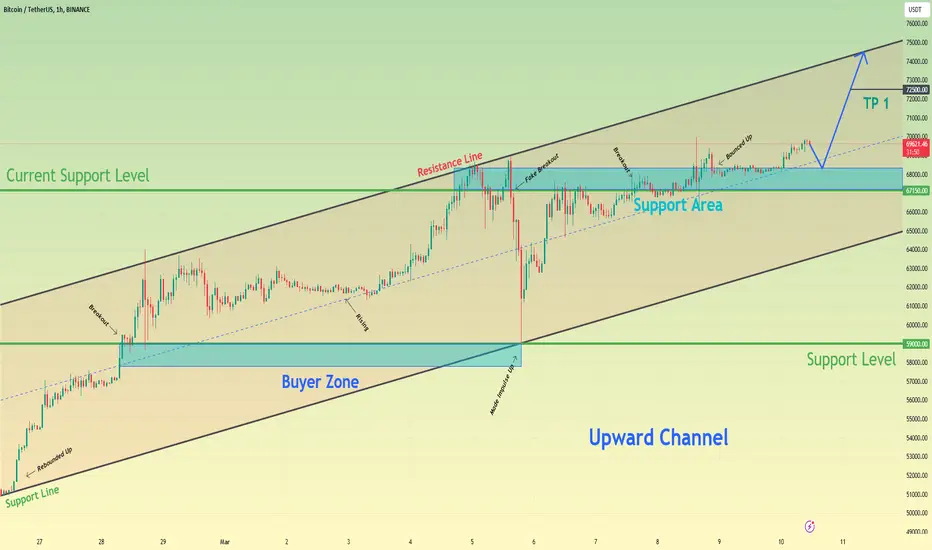
Bitcoin can decline to support area and then rebound upHello traders, I want share with you my opinion about Bitcoin. Observing the chart, we can see that the price some days ago entered to upward channel, where it at once rebounded from the support line and rose to the 59000 support level, which coincided with the buyer zone. In a short time later BTC broke the 59000 level and made a retest, after which it continued to move up and reached the resistance line of the channel, but then the price turned around and fell below. Then price continued to rise and some time later BTC reached the current support level, which coincided with the support area and even entered to this zone and also reached the resistance line of the channel, but soon price turned around and in a short time declined to support line of the channel, making fake breakout of 67150 level. But at once price bounced and made a strong impulse up to the support area, breaking the current support level one more time. Also recently, BTC exited from this area and now it trades near, so I think that Bitcoin can decline to the support area, where it turns around and starts to move up to the resistance line of the channel. For this case, I set my target at the 72500 level. Please share this idea with your friends and click Boost 🚀
BTCUSDT.4HBased on the current market data for BTC/USDT, the current price is 67166.0 USDT. The 4-hour Relative Strength Index (RSI) is 63.44, which means the market is neither overbought nor oversold. The Moving Average Convergence Divergence (MACD) for the same period is 1043.74, indicating a bullish market.
The Bollinger Bands (Bb) for the 4-hour chart is at 69376.0, with the price currently below the upper band, indicating that it is not overbought. The immediate supports are at 65327.0, 61437.0, and 58473.0 USDT. The resistances are at 70115.0, 72800.0, and 74100.0 USDT.
On the daily chart, the RSI is 92.34, indicating an overbought market. This could suggest a potential price correction in the near future. The MACD is 4603.0, indicating a strong bullish market. The Bollinger Bands are at 69376.0, with the price above the upper band, indicating an overbought market. The supports are at 58473.0, 56799.0, and 51800.0 USDT. The resistances are at 72800.0, 74200.0, and 77200.0 USDT.
On the weekly chart, the RSI is 88.81, indicating an overbought market. The MACD is 6747.0, indicating a strong bullish market. The Bollinger Bands are at 69377.0, with the price above the upper band, indicating an overbought market. The supports are at 44680.0, 38700.0, and 31800.0 USDT. The resistances are at 80770.0, 91500.0, and 98400.0 USDT.
In conclusion, the market is strongly bullish across all time frames. However, the high RSI values suggest that BTC is overbought, especially on the daily and weekly charts, and may experience a price correction in the near future. Therefore, it might be a good idea to take profits or set stop losses to protect against a possible downturn. It's important to keep monitoring the market closely.
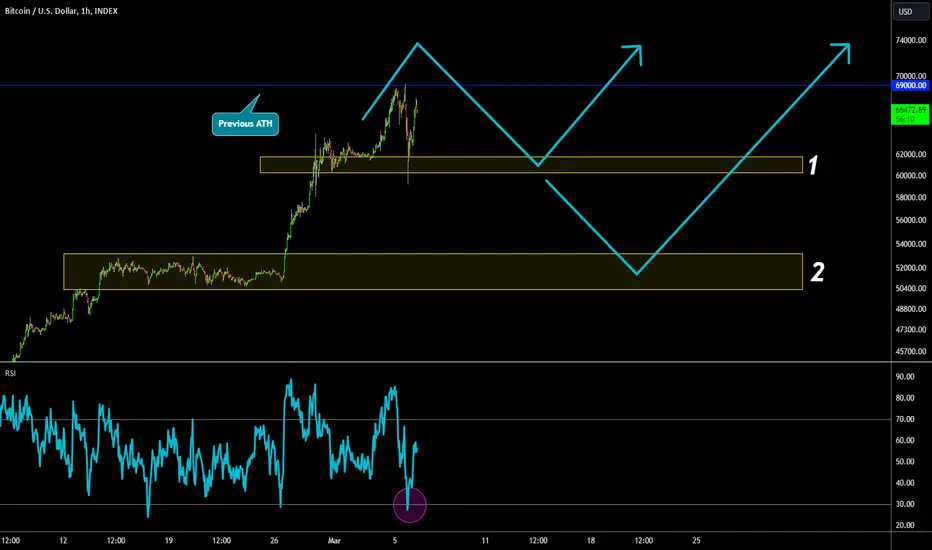
🔥 Bitcoin's New All-Time High Dump: Temporary Or Not?Two days ago I made an analysis on my expectation of Bitcoin's short-term price action, based on historical price action at the moment a new all-time high has been made.
My most likely scenario was a new ATH, followed by a dump towards the first yellow area of support. This has now occured, together with an hourly oversold reading on the RSI.
Experienced traders spotted an opportunity, and BTC rose over 13% in a matter of hours.
For now, my most likely scenario would be 1-2 weeks of consolidation between 60k and 69k. It seems like a small area on the chart, but it's still 15%. Alts could dump as much as 30% during a retest of the bottom yellow support, so be careful with leverage.
Keep in mind that a move towards the second support is still in the cards. Not very likely, but it's still a risk. Consequentially it would be an amazing area for long-term entries.
It's now a matter of exhausting the bears until there are no more sellers left. Once there are no more sellers left I expect a strong break out with high volume, which will be the start of a new era of price discovery.
Bitcoin can make little movement up and then start to fallHello traders, I want share with you my opinion about Bitcoin. Looking at the chart, we can see how the price some days ago long time traded between the support level, which is located in the buyer zone. But last time, it turned around and started to move up in an upward channel, breaking at once the 51600 support level. In the channel, BTC in a short time rose to the resistance line from the support line and even a little higher, reached the 64000 level, but soon price fell back to the channel and a few time traded below this level. Later BTC broke the 64000 support level and rose to the resistance line of the upward channel, but it at once fell back, after which it tried to back up to the resistance line and when it rose to this line again BTC made a downward impulse to support line of channel, thereby breaking 64000 support level. After this movement, the price rebounded from the support line and soon reached the current support level again, after which in a short time it broke this level and at the moment, Bitcoin continues to grow. In this case, I think BTC can rise a little to 68800 - 69000 points, and then start to decline to 64000 support level. For this reason, I set my target at this level. Please share this idea with your friends and click Boost 🚀
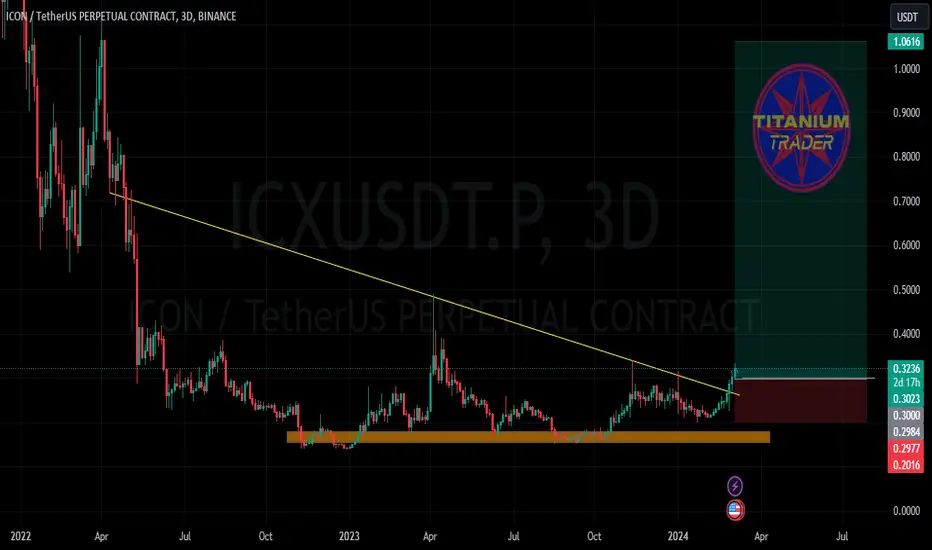
ICX 3D HUGE BULISH BREAKOUT 3X GAINICX coin made a huge bullish wave in 3d charts and broke descending channel. If bullish rally continues, we might see 3x growth soon.
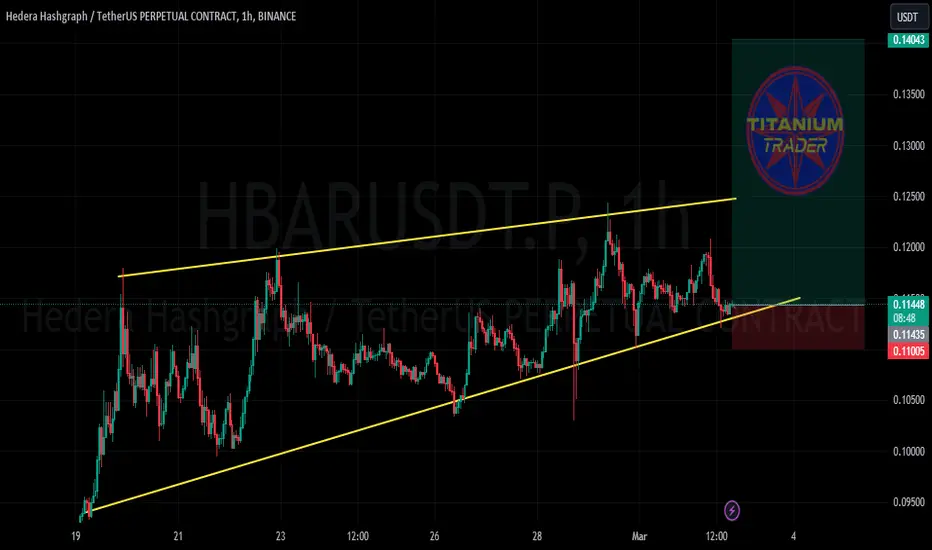
HBAR 1H BULLISH WAVEHBAR is swinging in range for past two weeks and it is ready to make some move from here, stop loss should be just below the daily close and targets should be 15-20%.
Bitcoin can exit from pennant, make correction and continue growHello traders, I want share with you my opinion about Bitcoin. Looking at the chart, we can see how the price some days ago started to trades in the range, where it at once declined to the buyer zone, which coincided with the 51300 support level, but soon it rebounded back. Later BTC reached the top part of the range and then turned around and in a short time declined back to the buyer zone, where the price some time traded. After this, it bounced up from this zone and few time traded near the support level, after which BTC fell back to the buyer zone and soon made a strong upward impulse to 54800 points, thereby breaking the 51300 level one more time and exiting from the range. Next, the price started to rise in an upward pennant, where it soon reached the 60600 current support level, which coincided with the support area and later broke this level. Then BTC rose to the resistance line of the pennant, but after this it turned around and in a short time declined to support area. After this price bounced up to the resistance line of the pennant back, where it at the moment continues to trades near. In my mind, Bitcoin can fall to the support area, thereby exiting from the pennant and then it will start to grow. So, that's why I set my target at the 64550 level. Please share this idea with your friends and click Boost 🚀
