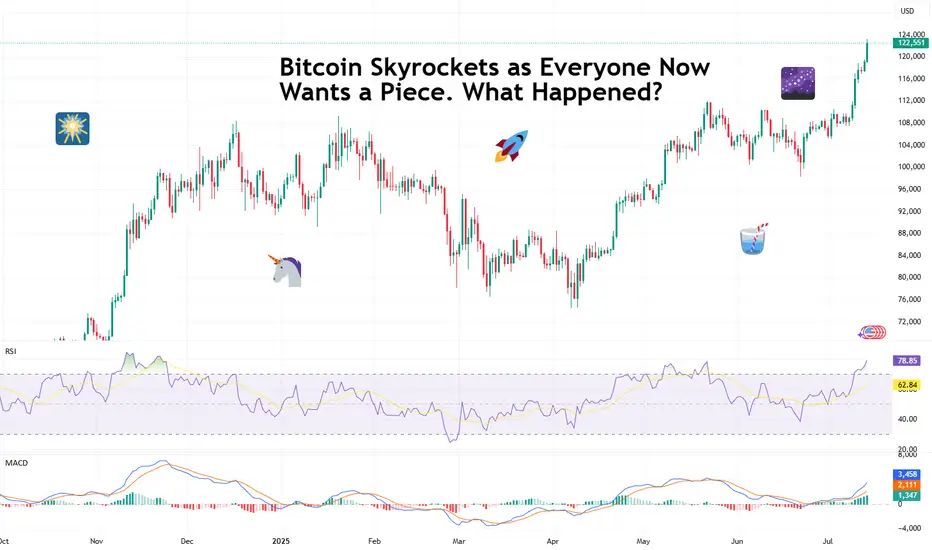
Bitcoin Skyrockets as Everyone Now Wants a Piece. What Happened?If you took a few days off last week and went to get coffee this morning, you likely missed Bitcoin torching its all-time high and soaring into the uncharted.
The world’s most popular digital asset took off in an unstoppable rocket ride, smashing records so fast that even the always-wired-in day traders couldn’t keep up.
Bitcoin BITSTAMP:BTCUSD blasted through $122,000 Monday morning after gobbling up sell walls at $120,000 and $121,000 in less than one hour. That’s not a typo.
That’s an actual snapshot of what happens when you mix onchain whale movements, fresh institutional FOMO, and traders rediscovering their appetite for risk. Billions upon billions swirled up and Bitcoin passed $2.3 trillion in market cap (ref: our Crypto Heatmap ).
🙌 Bow Down Before the King
Bitcoin has officially reminded every altcoin who wears the crown when markets go haywire. While some tiny tokens get to pump 100% on hype alone, Bitcoin does it with the weight of its market cap behind it — which now surpasses the GDP of entire countries.
Its dominance share has climbed back above 64%, a level we haven’t seen since the last time crypto Twitter argued whether “flippening” would happen by next Thursday (spoiler: it didn’t, and we mean 2021). And right now, all eyes are pinned on that round, meme-ready milestone: $125,000 or even $150,000.
Why these levels? Because traders love round numbers. They’re clean, symbolic, and if that next ceiling shatters, the chain reaction of liquidated shorts and new leveraged longs can turn an orderly bull run into pure market mayhem.
📈 Institutional Hoarding: The Secret Fuel
If you think this is just retail traders YOLO’ing in from their parents’ basement, think again. Onchain data showed earlier this month that this moon mission was being quietly underwritten by the big boys — institutional funds, overflowing Bitcoin ETFs , and corporate treasuries that once scoffed at Bitcoin as “magic internet money.”
Does this mean Bitcoin is becoming boring? Not quite. It means the foundation for this rally is sturdier than the TikTok-fueled moonshots of yesteryear. Think steady inflows, regulated vehicles, and balance sheets that no longer flinch when they see “digital assets” on a line item.
👀 So, Why Now?
Bitcoin doesn’t need much of a reason to get volatile — you know that. But a few more stars than usual aligned to give this surge its lift-off moment.
First, the macro backdrop: US inflation is at 2.4% (next ECONOMICS:USCPI report coming Wednesday, pay attention to the Economic Calendar ), which makes a Fed rate cut more likely later this year.
Lower rates mean cheaper dollars, weaker bond yields, and renewed appetite for risk assets. Oh, and don’t forget about gold OANDA:XAUUSD — the OG “no yield, no problem” hedge.
Second, corporate treasuries are all-in on Bitcoin again. If Michael Saylor’s Strategy NASDAQ:MSTR (formerly MicroStrategy — we all know what business they’re really in) keeps adding coins and onboarding new public companies like GameStop NYSE:GME , you know the institutions smell long-term value. Add Trump’s full-throated crypto endorsement and you’ve got a narrative tailwind no trader wants to miss.
🥂 Record Highs Everywhere — COINcidence?
Now let’s go back to those aligning stars. Bitcoin’s fresh all-time high didn’t happen in a vacuum. The S&P 500 SP:SPX , the Nasdaq Composite NASDAQ:IXIC , and Nvidia NASDAQ:NVDA — the world’s most expensive company — all clocked record closing highs last week.
So, is this a “rising tide lifts all boats” moment? Or are we partying on borrowed time? Equities are riding a wave of hope that the Fed will start easing soon, and any whiff of a rate cut is pure oxygen for risk assets.
But seasoned traders know that record highs can sometimes be the most dangerous places to FOMO in. Ask anyone who went all-in on dot-com stocks in 1999.
🏹 Eyes on the Big 120K — Will It Hold the Line?
Short-term, the $120,000 milestone is the line in the sand everyone’s watching. Break it decisively, see if it holds above it for a week or so, and the floodgates of speculative capital might open for another leg higher. Stall out below it? You could see a healthy round of profit-taking and some bruised egos during quiet dinners.
Macro factors will loom large: the Fed’s policy meeting, surprise tariff talks from the White House, or an unexpected bout of inflation could swing sentiment overnight. But for now, the mood is simple: bullish, frothy, and more than a little bit greedy.
💭 Final Take: From Moonshots to Maturity?
The shift from whales to suits means fewer wild swings but steadier institutional demand. The days of “Lambo tomorrow” might be giving way to “slow grind higher for the next 5 years.” For the retirement portfolio, that’s not the worst outcome.
For the traders who crave the adrenaline, there’s still plenty of room to catch the waves — just don’t expect them to come as easily or as frequently as they did in the wild west days.
📢 Your Turn: Moon or Swoon?
Over to you: is Bitcoin ready to break out above $125,000 and send shorts scrambling for cover? Or is this just another overbought stall before a healthy pullback?
Either way, grab your popcorn — and your stop-loss — because if there’s one thing crypto never does, it’s sit still for long. Drop your hot take below — and may your diamond hands be stronger than your coffee.
BTC
Key Insights: Financial Markets Transformation by 2030For years, this page has been my space to share in-depth market research and personal insights into key financial trends. This post reflects my perspective — a strategic outlook on where I believe the digital finance industry is heading.
The financial world is evolving at an unprecedented pace, and it's easy to overlook subtle shifts. But the undeniable fact is that we are now standing at the intersection of three powerful industries — financial markets, blockchain, and artificial intelligence. We are positioned at the cutting edge of technology, where innovation is not a future concept but a present reality.
This post serves as a reference point for future trends and a guide to understanding the transformative forces shaping financial markets by 2030. These are not just facts, but my vision of the opportunities and challenges ahead in this rapidly converging digital ecosystem. Staying ahead today means more than following the market — it means recognizing that we are part of a technological shift redefining the core of global finance.
📈 1. Electronic Trading Evolution
Full transition from traditional trading floors to AI-driven digital platforms.
Integration of blockchain and smart contracts ensures transparency, automation, and risk reduction.
Real-time data analytics democratizes market access and enhances strategic decision-making.
🤖 2. Algorithmic Trading Growth
Accelerated by AI, machine learning, and big data analytics.
High-frequency trading (HFT) boosts efficiency but introduces new volatility factors.
Adaptive algorithms dynamically adjust strategies in real time.
Strong focus on regulatory compliance and ethical standards.
🔗 3. Tokenization of Real World Assets (RWA)
Transforming asset management with projected growth to $18.9 trillion by 2033. (now 18.85B)
Enhances liquidity, accessibility, and transparency via blockchain.
Institutional adoption is driving mainstream acceptance.
Evolving regulations (DLT Act, MiCA) support secure tokenized ecosystems.
🏦 4. Institutional Adoption & Regulatory Frameworks
Digitalization of fixed income markets and exponential growth in institutional DeFi participation.
Key drivers: compliance, custody solutions, and advanced infrastructure.
Global regulatory harmonization and smart contract-based compliance automation are reshaping governance.
💳 5. Embedded Finance & Smart Connectivity
Embedded finance market to hit $7.2 trillion by 2030.
Seamless integration of financial services into everyday platforms (e-commerce, mobility, etc.).
AI, blockchain, and IoT power real-time, personalized financial ecosystems.
Smart contracts reduce operational friction and enhance user experience.
🛡 6. Financial Crime Risk Management
Market expected to reach $30.28 billion by 2030.
AI-driven threat detection and anomaly monitoring strengthen AML compliance.
Blockchain ensures data integrity and automates cross-border regulatory adherence.
Global collaboration (FATF, EU AML) fortifies defenses against evolving financial crimes.
🌍 7. Consumer Behavior & Financial Inclusion
Digital banking bridges the gap for underbanked populations, especially in emerging markets.
Mobile solutions like M-Pesa revolutionize access to financial services.
Biometrics, microfinance, and AI-powered engagement tools foster inclusive economic participation.
🚀 Conclusion
By 2030, financial markets will be defined by technology-driven efficiency, regulatory adaptability, and inclusive growth.
Success will favor those who embrace innovation, leverage automation, and engage in cross-sector collaboration.
The future belongs to agile stakeholders navigating a landscape shaped by AI, blockchain, tokenization, and smart finance connectivity.
Best regards, EXCAVO
_____________________
Disclosure: I am part of Trade Nation's Influencer program and receive a monthly fee for using their TradingView charts in my analysis.
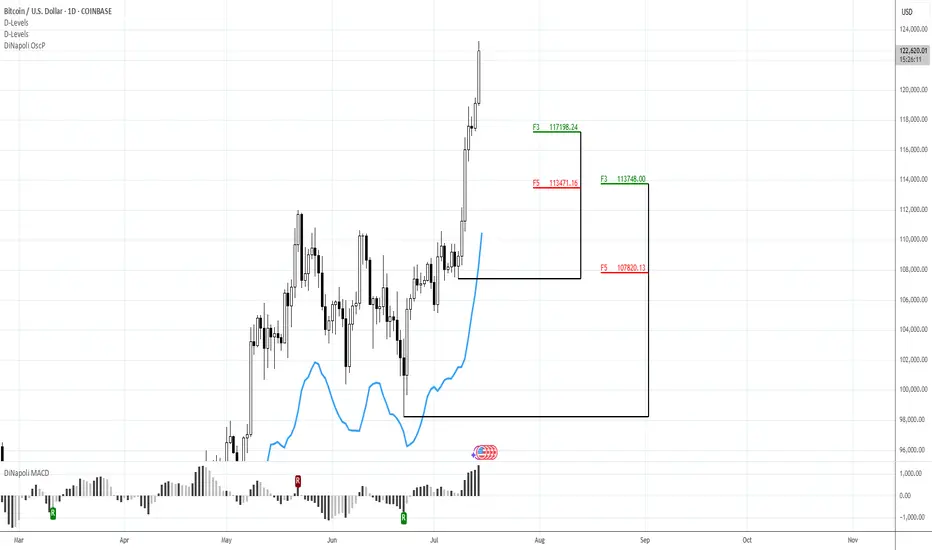
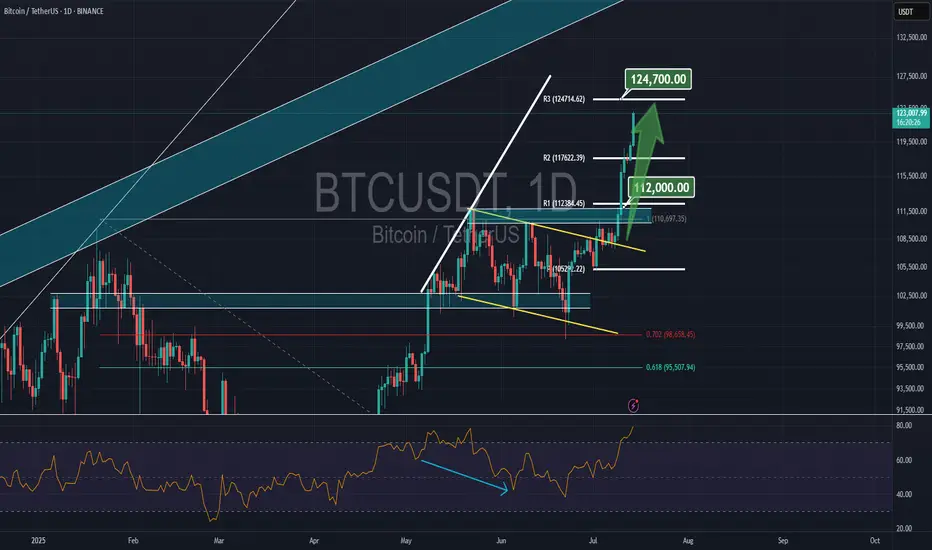
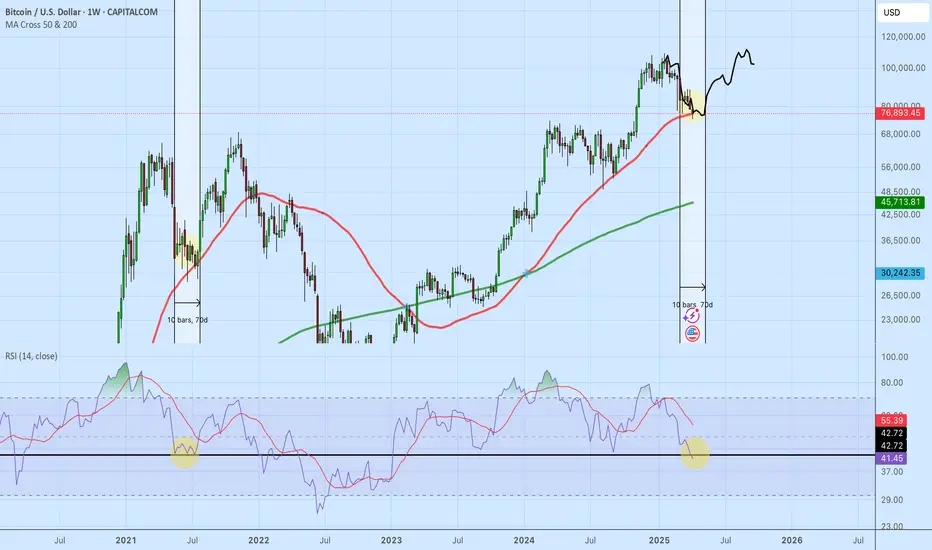
127KMorning folks,
So, BTC shows even better performance that we thought, although it obviously something stands behind, this is not market-natural motion. Anyway, we consider 127K level as all-time nearest target that stands on monthly chart.
If any pullback starts (BTC now is at daily overbought and near Yearly Resistance Pivot), we keep an eye on 117.2K and 113.5K levels to decide on long entry
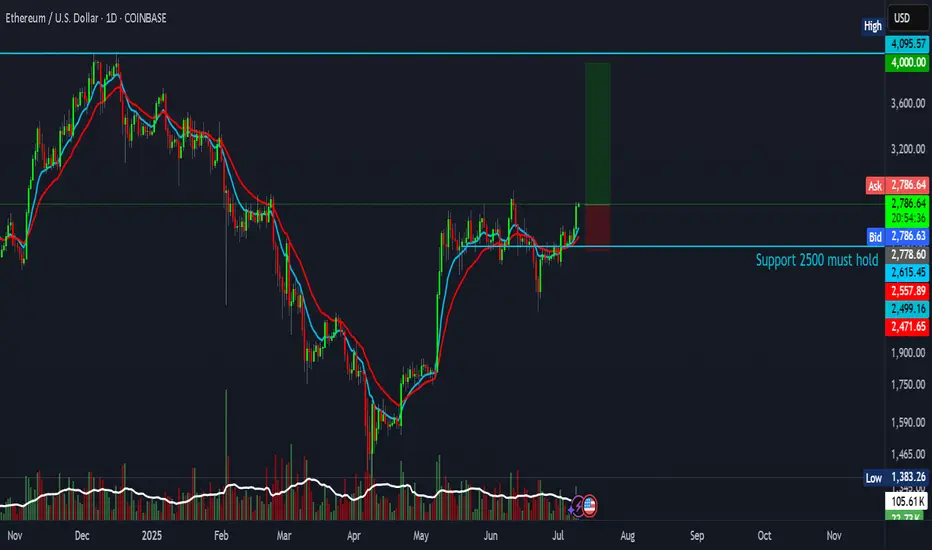
Ethereum trade setup with a 4:1 risk-reward ratioAnother attempt — and this one could be the real breakout.
This setup offers a 4:1 risk-reward ratio, targeting $4,000.
Entry: $2,780
Stop Loss: $2,471
Target: $4,000
Not financial advice.
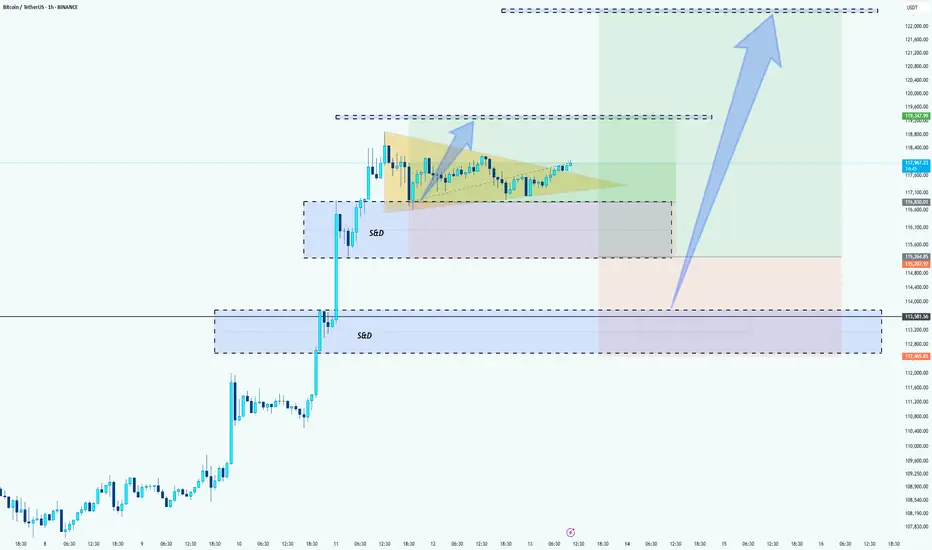
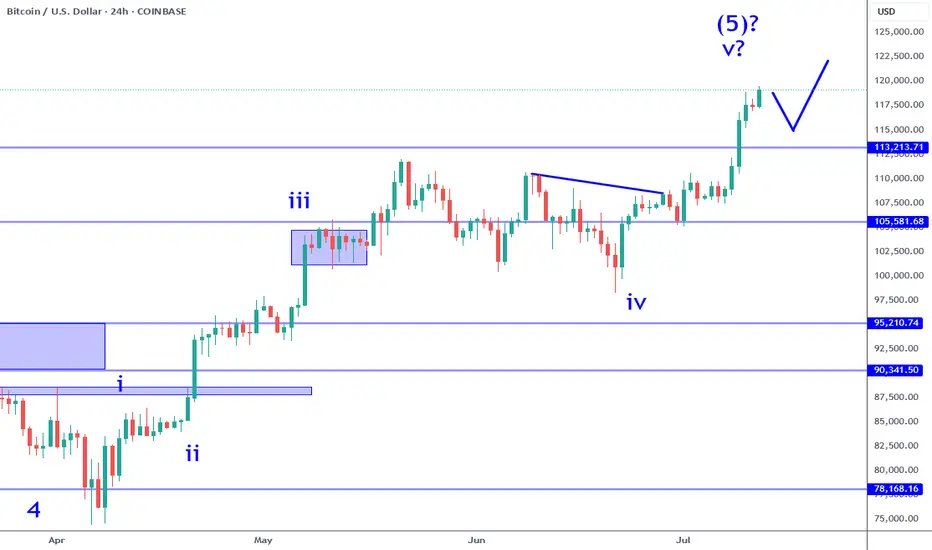
BTC Bullish Setup: Two Long Positions Aligned for ContinuationHello guys!
Bitcoin is currently in a strong uptrend, consolidating after a sharp move up. The chart highlights a textbook bullish continuation pattern (pennant/triangle), suggesting momentum is building for another leg up.
Attention:
This is not an either-or setups. Both long entries are valid and could trigger one after the other, offering layered opportunities for bulls.
1- First Long: Breakout from Bullish Pennant
Price is tightening inside a triangle after a strong impulse move.
A breakout above the resistance around $118K would confirm continuation.
Entry on the breakout targets the upper liquidity zone near $122K.
2- Second Long: Pullback to S&D Zone (around $115K)
If the breakout happens and then retraces, watch for price to revisit the S&D zone at $115,200–$115,800.
This area will act as support and provide a second long opportunity.
target: around $122k
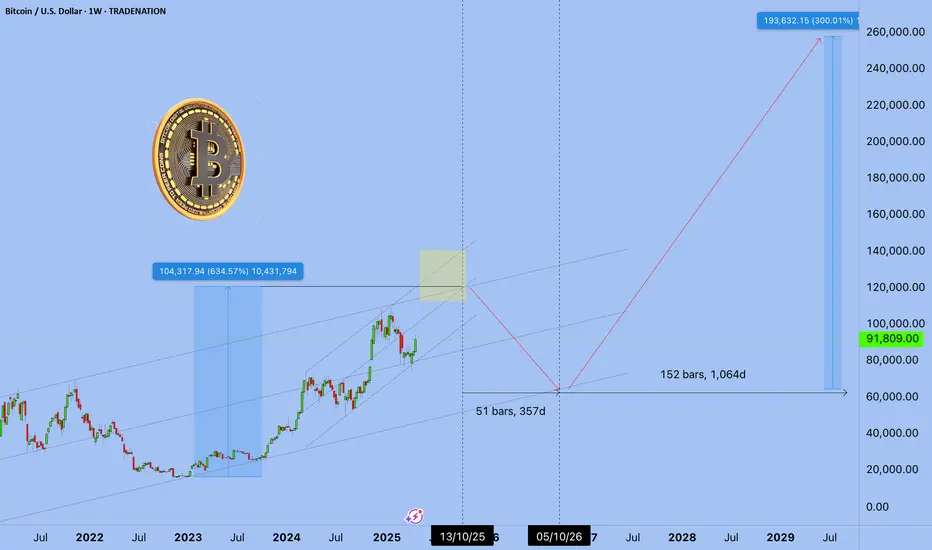
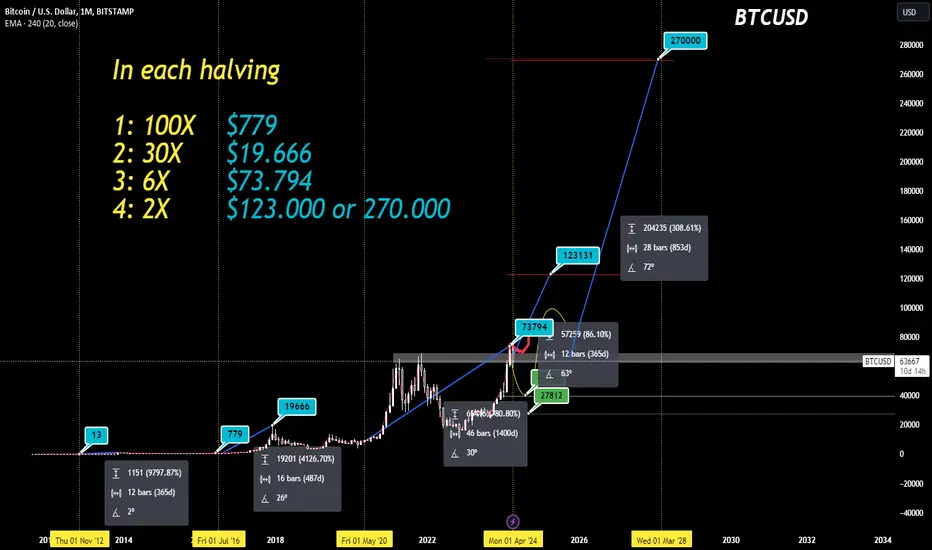
BTC: Next price Halving 📊Analysis by AhmadArz: #BTCUSD
By calculating the price growth in the 4-year halving time frame, we came to the conclusion that with the growth of the Bitcoin market cap, its growth will be halved and we can expect $120,000 from Bitcoin, and it is expected to grow up to 270,000 dollars in halvings.
🔗"Uncover new opportunities in the world of cryptocurrencies with AhmadArz.
💡Join us on TradingView and expand your investment knowledge with our five years of experience in financial markets."
🚀Please boost and💬 comment to share your thoughts with us!
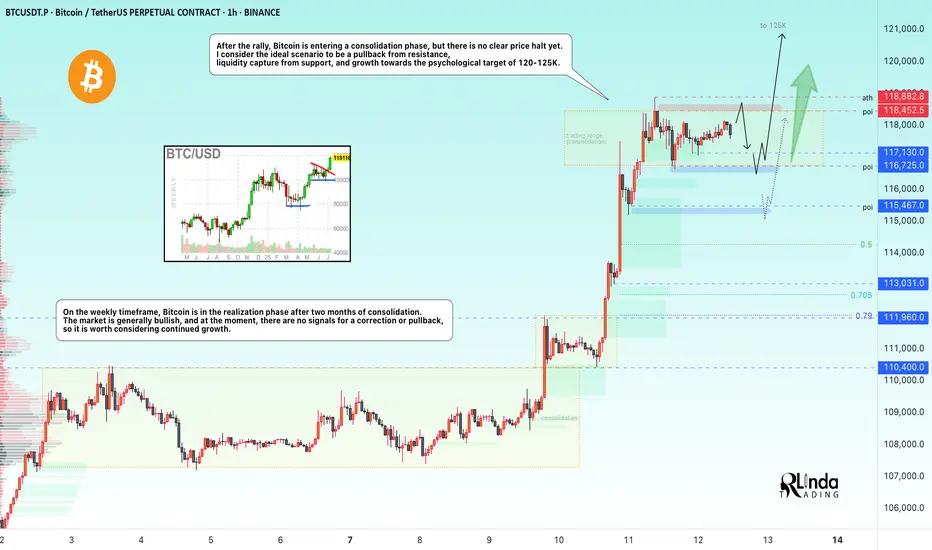
BITCOIN → Stopping after the rally? What next? 125K or 110K?BINANCE:BTCUSDT rose and updated its historical maximum to a new record of 118K with “kopecks” (different prices on different exchanges). Now the price has supposedly stopped and entered a consolidation phase, but it is too early to draw any conclusions based on this alone...
Fundamentally, Bitcoin rose following the SP500 and NQ100 indices. The reasons are clearly geopolitical. The correlation level is not high, but the flagship is following the stock indices, which are also updating their historical highs.
Technically, Bitcoin has emerged from a two-month consolidation and entered a realization phase. So what's next? Continuation of the phase or correction? Let's take a look.
On the daily chart, I would highlight two zones. The risk and sell zone is below 117,500. If the price closes below this zone today/tomorrow, we will most likely be able to look for signals for a possible correction. As part of the correction, we can expect a decline to 115,500, 114,300, or even to the old ATH of 112K.
The second zone is the buying zone. A closing price above 118,400–118,900 and consolidation with the gradual formation of a breakout of structure may hint at a possible continuation of growth toward psychological targets.
Resistance levels: 118,400, 118900
Support levels: 117100, 116700, 115500
In the chart above, I have highlighted the situations, levels, and zones that interest me more precisely.
Now I am waiting for Bitcoin to retest resistance or support and confirm certain levels, based on which decisions can be made. I think that in the near future, Bitcoin will show us where it is headed. Updates will be published as something interesting emerges...
Best regards, R. Linda!
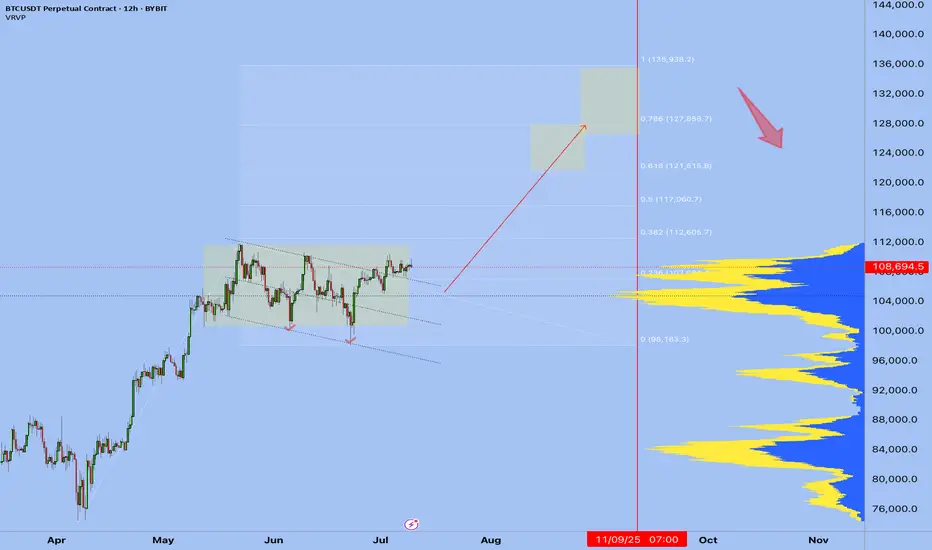
Just Two Months Left: Navigating Bitcoin and Global ChangesGreetings to everyone reading these lines! Today, I want to share with you not just an analysis, but my personal reflections and feelings about the current situation in the financial and cryptocurrency markets, especially regarding Bitcoin.
Many of you already know that I have always been a firm believer in Bitcoin’s market cycles. Right now, we are approaching the final stage of another such cycle-the distribution phase. The past few months have seen considerable turmoil: Trump's election, escalating conflicts between India and Pakistan, Israel and Iran, rising tensions between Russia and Ukraine, and not to mention China’s increasingly assertive geopolitical moves. I can't shake the feeling that the world stands on the threshold of something significant, perhaps serious. I sincerely hope I'm mistaken, but signs of a global conflict or a substantial reset in the world order are undeniably in the air.
History shows us that after major upheavals and wars, the world undergoes profound changes. It seems we are nearing such a pivotal moment within the next couple of months. For a long time, I've highlighted September 2025 as a critical point in the current market cycle, and now everything confirms this scenario.
In these unstable times, participants in the financial markets face both risks and tremendous opportunities. The distinguishing factor today is the rapid integration of artificial intelligence into all areas of life. I firmly believe that if you don't begin incorporating AI into your activities now, you risk being left behind. Personally, I'm actively integrating artificial intelligence into my professional processes and everyday life, as I see it as inevitable in our near future.
Regarding the cryptocurrency market, I'll be frank: the past couple of years have significantly changed it and even somewhat disappointed me. Liquidity has become diluted, and the market has clearly become seasonal, with brief periods of explosive growth followed by long downturns. This has led me to return to trading Forex and gold, where the market is more transparent and predictable.
Many crypto projects that seemed promising in 2017 are now nearly forgotten and stagnating. Think of Dash, EOS, Litecoin, ZCash, and others-they haven't disappeared entirely, but they no longer play significant roles in the market. The battle for user attention has become overly aggressive, and competition has devolved into chasing short-lived hype. Nevertheless, there are exceptions, such as Solana—a project that achieved success thanks to a fortunate combination of factors. Yet such projects remain exceedingly rare.
Today, I see the most promising and powerful trend as the tokenization of real-world assets (RWA). It doesn’t matter so much which blockchain will be used-the concept itself has already proven effective. While this journey won't be easy, the involvement of giants like BlackRock indicates the trend is sustainable and promising in the long run.
Overall, I am confident that financial markets and digital currencies will continue to evolve and grow. However, in about two months, I plan to adopt a bearish stance. Unfortunately, there are few signs of a quick global economic recovery. The world needs significant restructuring and changes-new rules and agreements are inevitable, and the coming year promises many notable events.
Ask yourself: Are you ready for these changes? Are you prepared to adapt to new conditions, technologies, and realities? Personally, I'm fully ready, which is why I remain active in the market, continuing to share my thoughts, assist, and engage with each of you. If you have questions, ideas, or proposals for collaboration, I am always open to dialogue and eager for any interaction.
I sincerely thank each of you for your support, comments, and attention to my posts. I stay here because I believe in the enormous opportunities available even in the most uncertain times. We have an exciting journey ahead, and I invite you to travel it together with me.
Wishing you success, profits, and above all, peace and kindness on our planet. The time of change is already here. Let’s meet it together.
Warm regards,
Your EXCAVO.
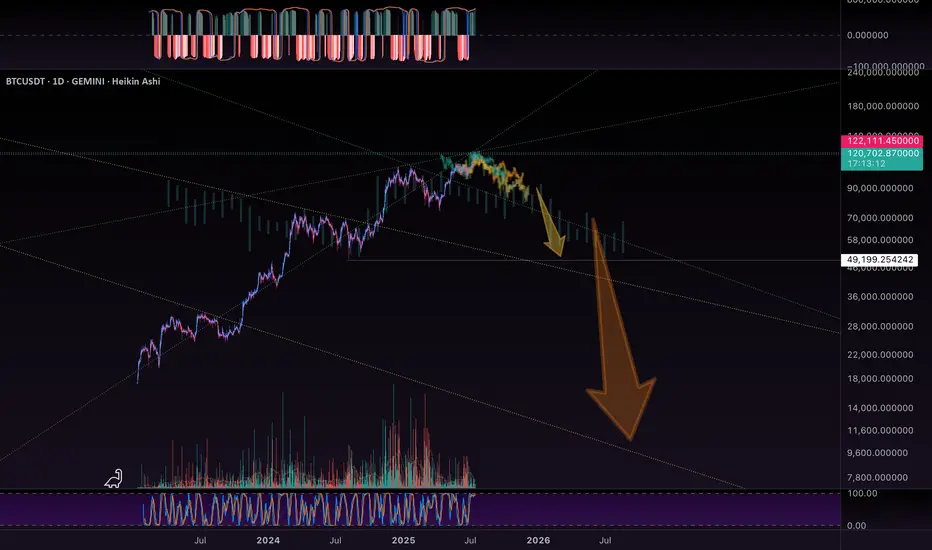
BTC - Historic Levels to CheckBTC has some checking in to do…. On historic resistance levels…
I drew in the major ones visible on this chart… and the initial bearish fractal, which was shown to us previously int he chart.
It will fractal for each arrow.
Pump and Dump!
Im going to run my DOGe.
See my linked post below for a bigger picture view of all this.
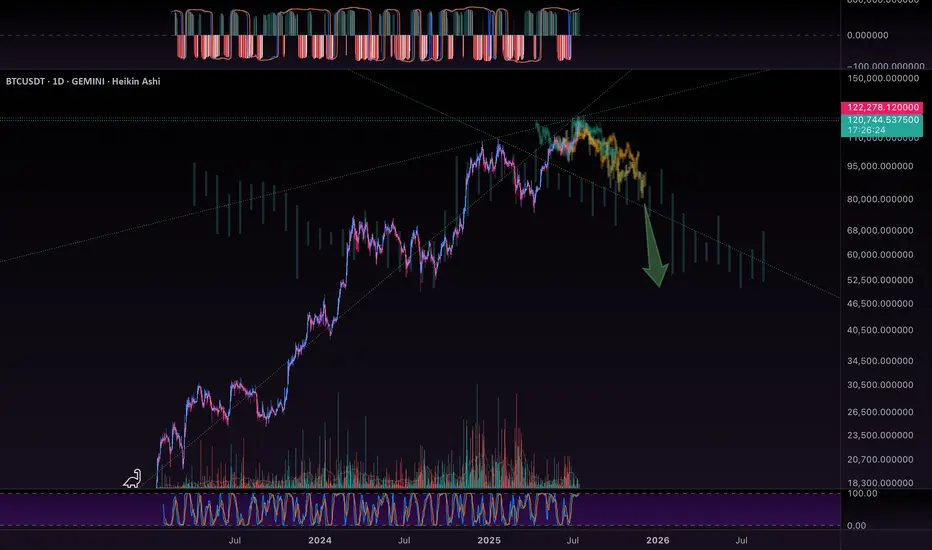
BTC - Topping outWow.. and look at those beautiful harmonic pattern fits! My eyeballs are so pleased with my work! Hehe!
These aggressive monsters like to propagate and fractal…
I met with another wizard of the charts yesterday… forecasted BTC to $5,000 !!! Holy crap!
Are you getting FEARFUL yet? Or still feeling GREEDY?
This is gonna be fun!
Check my linked idea for more insights.
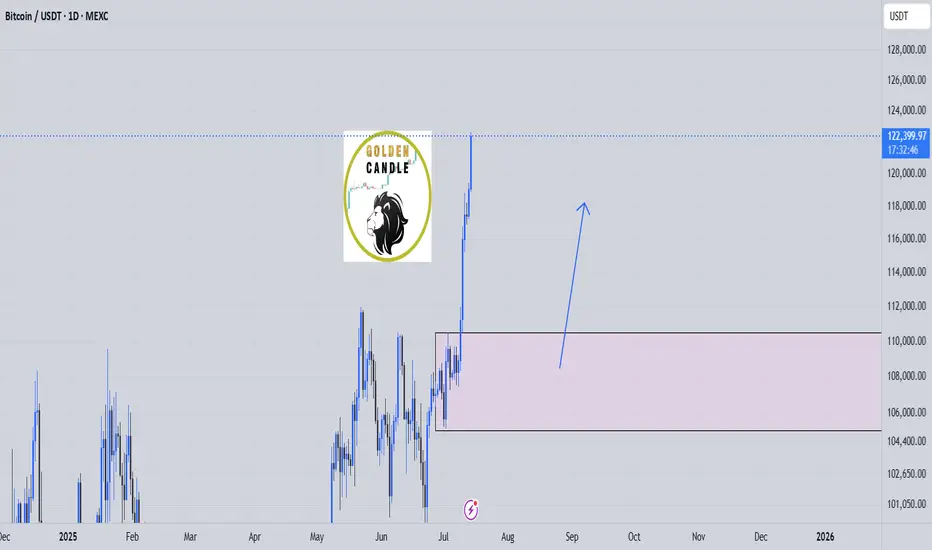
btc buy longterm"🌟 Welcome to Golden Candle! 🌟
We're a team of 📈 passionate traders 📉 who love sharing our 🔍 technical analysis insights 🔎 with the TradingView community. 🌎
Our goal is to provide 💡 valuable perspectives 💡 on market trends and patterns, but 🚫 please note that our analyses are not intended as buy or sell recommendations. 🚫
Instead, they reflect our own 💭 personal attitudes and thoughts. 💭
Follow along and 📚 learn 📚 from our analyses! 📊💡"
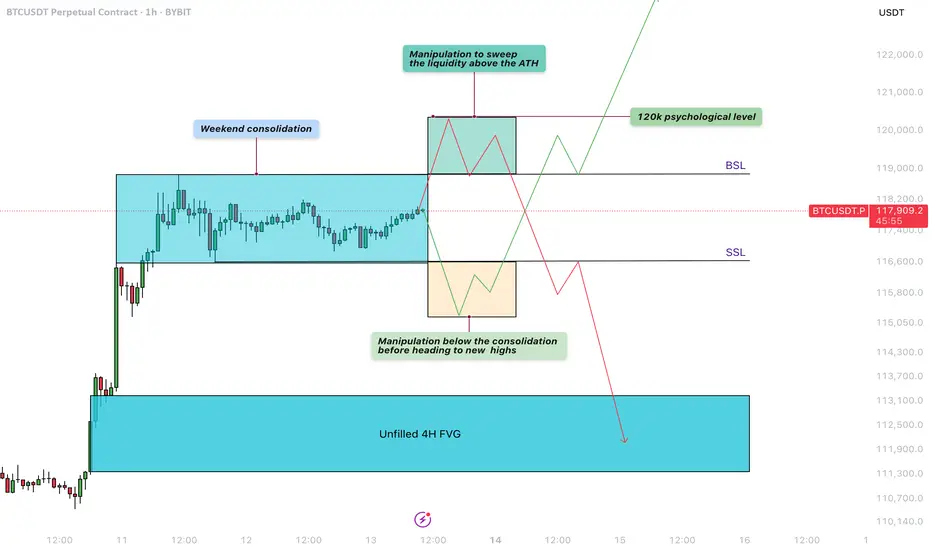
Bitcoin - Liquidity sweep before the next move!Weekend Consolidation
During weekends, Bitcoin often moves sideways as institutional players step back and retail traders prepare for the next move. During this consolidation phase between $117.000 and $119.000, liquidity builds up on both sides—sell-side liquidity below the range and buy-side liquidity above it. After these weekend consolidations, Bitcoin typically sweeps one side of liquidity before continuing in the opposite direction.
Manipulation Above the Buy-Side Liquidity
A significant amount of liquidity has formed just above the all-time high, right below the $120,000 level. Retail traders are positioning for a potential downward move, making this area a prime target for a liquidity sweep. This aligns perfectly with the psychological barrier of $120,000, a level where many traders are likely to take profits.
Manipulation Below the Sell-Side Liquidity
Over the weekend, traders are entering both long and short positions while placing stop-loss orders just below recent lows. This behavior creates a buildup of liquidity underneath the range. Bitcoin could dip below these lows to stop out retail traders before reversing to higher levels.
4-Hour Unfilled Fair Value Gap (FVG)
If Bitcoin sweeps the all-time high and enters a distribution phase, there’s a strong chance it will retrace to fill the unfilled Fair Value Gap on the 4-hour chart at $113.000 - $111.000. This imbalance was created during a sharp move up, leaving behind unfilled orders. Such levels often get revisited as price action seeks to rebalance.
How to Execute This Trade
Wait for Bitcoin to sweep either the low or the high of the weekend range. Avoid entering the market immediately after the sweep. Instead, wait for confirmation that price is returning back inside the range, signaling a clean sweep. On lower timeframes, such as the 5-minute chart, you can look for entry models like an inverse Fair Value Gap to refine your entry.
Final Thoughts
At this point, it’s unclear which direction Bitcoin will take next. The best approach is to wait for a clear liquidity sweep and signs of a reversal before entering any trades. That said, there’s a possibility we may first move up to test and claim the $120,000 psychological level before revisiting and filling the lower 4-hour imbalance zones.
Thanks for your support. If you enjoyed this analysis, make sure to follow me so you don't miss the next one. And if you found it helpful, feel free to drop a like and leave a comment, I’d love to hear your thoughts!
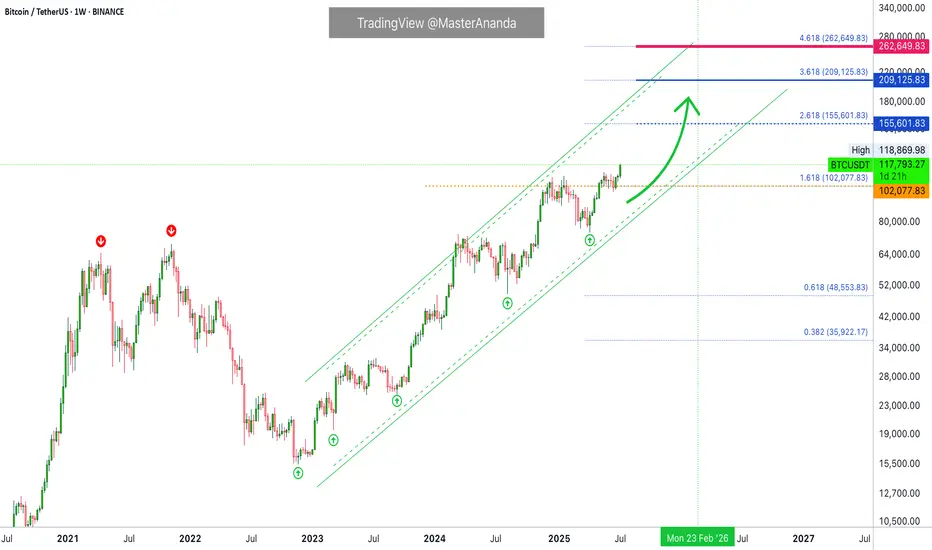
Ascending Inverse H&S on the BTC weekly chartThe longer it takes to break above this neckline the higher the breakout target will be. I have arbitrarily placed the measured move line at July 18th 2025. If the breakout were to happen on that day the measured move target is around 208k, which could take quite awhile to reach or if we entered a truly hyperparabolic blow off top we could reach such a target way quicker than when the dotted measured move line reaches it. *not financial advice*

DOGE - Running your DOG.These traces represent a few of the prominent behaviors we would expect to see from our beloved DOGe.
As you can see, the orange traces Bearish leg leading into this is fit is much larger than our actual moves… indicating the Bulls are gaining strength. This pattern is matched harmonically to the relevant expansion / contraction patterns, and signature moves. Harmonically… in time. Shifted, in amplitude.
Blue trace is the bull run fractal we would expect to see propagate from the initial moves in this run. As we scale this trace to fit, it gains amplitude, indicating a strong bullish favor, and showing the chorus for an exponential run, as it continues to propagate.
DOGe is famous for its huge runs.
DOGe also assimilates unconditional LOVE… that humans share with DOG’s. Loyalty too…
As such, we expect DOGE to avoid any major corrections or market collapse sell offs. It’s like the emotional safe haven in the games of Fear vs Greed that is all other coins.
Also… check out the longer range analysis linked below. It’s a look at the 2W candle, and the all time chart… 10 years of data!
Let’s Go, Boy!

Bitcoin Crash? No! The Bullish Wave Starts Now! $155,601 Next!Some people are still expecting for "Bitcoin to go down." Poor bastards, the advance is just starting. Bitcoin just broke out of a 210 days long consolidation phase. After this huge, long-term consolidation, expect a major advance. Next target is now set at $155,601.
This week is the first week green after the consolidation finally ends. The market was sideways for seven months, with some fluctuations, and the result is a bullish breakout. Why a breakdown? Why expect a drop? If the market just broke up—think about it—why would it go down?
If resistance is confirmed; you remember the range between $100,000 and $110,000. If resistance is confirmed then Bitcoin would start crashing down from $110,000. If the break of $110,000 does happen and Bitcoin moves to $112,000 as a bull-trap, then you would expect a major crash happening from $112,000 and no more. But, reality is saying, showing, something much different. We have a major advance. Resistance has been flipped into support.
Now, the first that is needed is the weekly close. It is still very early into this move but Bitcoin is showing maximum strength. Remember the altcoins? These confirm that the advance is just new, early, because these are recovering from all-time lows or major lows. There is still plenty of room for growth.
My people, wake up! Bitcoin is going up.
The next target is $155,601 and it can go higher, this is only the mid-term target based on the long-term. When Bitcoin consolidates for 7 months, it tends to grow some 137% on average, it can be less but it can also be much more. And it tends to grow at least for 1-2 months, but this also is just the average, Bitcoin can grow straight up for 4 months.
So, are you still bearish?
Oh please no! The bulls already won.
The 2025 bull market final phase starts now, soon you will experience a marketwide bull-run. We have not seen the euphoria phase, this is only the start. Prepare for additional growth.
I am calling out all of the bears, never bet down on Bitcoin; Bitcoin is going up.
Namaste.
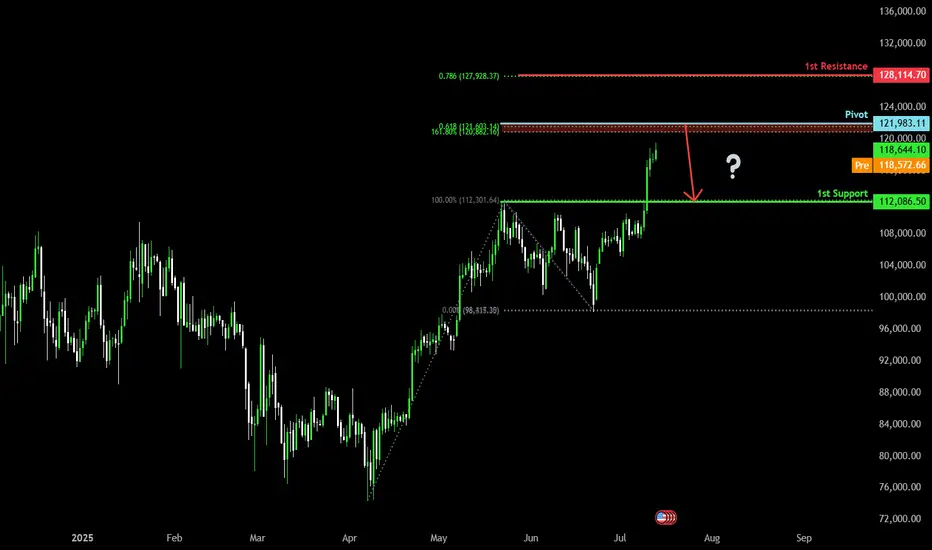
Bearish reversal off Fibonacci confluence?The Bitcoin (BTC/USD) is rising towards the pivot and could reverse to the 1st support which is a pullback support.
Pivot: 121,983.11
1st Support: 112,086.50
1st Resistance: 128,114.70
Risk Warning:
Trading Forex and CFDs carries a high level of risk to your capital and you should only trade with money you can afford to lose. Trading Forex and CFDs may not be suitable for all investors, so please ensure that you fully understand the risks involved and seek independent advice if necessary.
Disclaimer:
The above opinions given constitute general market commentary, and do not constitute the opinion or advice of IC Markets or any form of personal or investment advice.
Any opinions, news, research, analyses, prices, other information, or links to third-party sites contained on this website are provided on an "as-is" basis, are intended only to be informative, is not an advice nor a recommendation, nor research, or a record of our trading prices, or an offer of, or solicitation for a transaction in any financial instrument and thus should not be treated as such. The information provided does not involve any specific investment objectives, financial situation and needs of any specific person who may receive it. Please be aware, that past performance is not a reliable indicator of future performance and/or results. Past Performance or Forward-looking scenarios based upon the reasonable beliefs of the third-party provider are not a guarantee of future performance. Actual results may differ materially from those anticipated in forward-looking or past performance statements. IC Markets makes no representation or warranty and assumes no liability as to the accuracy or completeness of the information provided, nor any loss arising from any investment based on a recommendation, forecast or any information supplied by any third-party.
BITCOIN 2025 - THE LAST HOPECRYPTOCAP:BTC currently finds itself at the intersection of geopolitical tensions and broader macroeconomic uncertainty. Although traditionally viewed as a hedge against systemic risk, it is presently exhibiting characteristics more aligned with high-risk assets. The FED's forthcoming policy decisions will likely play a pivotal role in determining whether Bitcoin stabilizes or experiences further downward pressure.
The chart represents the most optimistic scenario for Bitcoin to date
Bitcoin: 3 Of 5 Sub Waves In, Two To Go.Bitcoin not only reached my 113K profit objective, it blew right through it and is now closing in on the 120K objective. I have been writing about this Wave 5 formation for weeks now. 3 sub waves can be counted in the current move, which means Wave 4 retrace and then one more leg higher which can put price anywhere above 120K. Whole numbers, especially every 10K points, like 130K, 140K, etc. serve as psychological reference points. The main thing to keep in the forefront of your mind is once the 5th wave completes, the probability of a BROAD corrective move becomes highly likely.
This move largely has to do with the combination of the effects of the U.S. tariffs and a declining faith in the U.S. dollar. Either way, the reasons do not matter. What matters is the RISK. Wave counts are a measure of emotion in the market and have nothing to do with fundamental drivers. 5th Waves usually represent the situation where the market becomes saturated on one side (all the buyers have bought for now etc.). While the market can still continue higher for irrational reasons, 5th Waves mean it becomes highly vulnerable to bearish catalysts which can suddenly come out of nowhere.
My Trade Scanner Pro called a long two weeks ago which reached its profit objective on this time frame. There have been multiple opportunities to participate on smaller time frames for swing trades and plenty of day trade signals. As Bitcoin continues to complete this 5th Wave, it is best to avoid new investments at these levels because of the risk, and just trade the price action. As for investors, there is no reason to take profits YET, in terms of sell signals, but watch for large reversal candles around 120K, 125K or 130K. The LEVEL and the CONFIRMATION is what should help in your decision to lock something in.
Thank you for considering my analysis and perspective.
BREAK 2.0 upcoming for VELO/USDTVELO/USDT has high chance to break in the coming hours, more updates later when there is more confirmations below this update

BTC – Textbook Pullback. New ATHs. What’s Next?Back in mid-June, I published a BTC update calling for a local correction into HTF demand while most were screaming bear market and waiting for deeper breakdowns.
Price action played out exactly as forecasted.
BTC swept the $100k swing low, front-ran my first demand zone by $400, and launched into a powerful reversal — just like it did back in April, where it also front-ran the key HTF demand before rallying.
That move took us straight into new all-time highs (ATHs) — now trading comfortably around $118k.
🧠 What Happened?
✅ Liquidity sweep of the prior low
✅ Front-run demand zone (perfect HTF structure)
✅ Strong bullish reaction and higher high
✅ Confluence from USDT.D rejection at 5.25%
✅ Alts showing signs of strength as BTC rallies
The entire setup aligned perfectly across BTC, USDT.D, TOTAL, and OTHERS.D — all of which I’ve been tracking in tandem.
🔮 What Now?
With BTC now in price discovery, I expect continuation higher — but not without the possibility of a short-term pullback.
📉 A potential retest of the $108k zone isn’t off the table. This level aligns with:
- Prior breakout structure
- Range high retest
- Local demand before continuation
But even if we go straight up — I remain HTF bullish into the final phase of this cycle, supported by:
- USDT.D structure still bearish
- BTC.D showing signs of distribution
- ETH.D and OTHERS.D gaining momentum
- Altseason rotation already starting to pick up
🧭 The Macro Outlook
The 4-year cycle projection still points to a Q3 2025 top — likely between August late and September based on historical cycle timing, but this could deviate.
That gives us a window of 2–3 months for this final leg to unfold — and it’s already in motion.
Stay focused. Stick to your plan. Ride the trend, don’t chase it.
Let me know what levels you're watching next, and whether you think we get that $108k retest — or we go vertical from here.
1D:
3D:
4D:
1W:
1M:
— Marshy 🔥
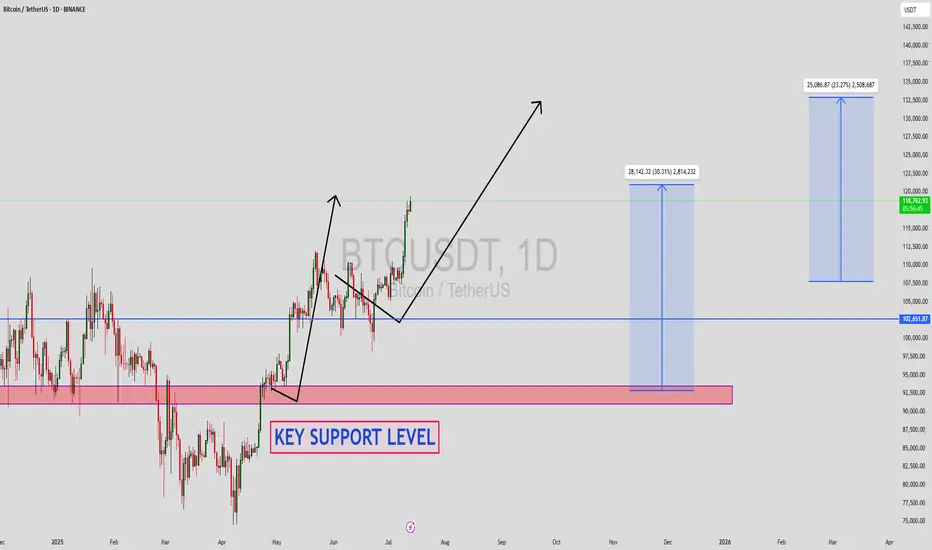
BTCUSDT Forming Strong BreakoutBTCUSDT is looking increasingly bullish as the pair continues to hold above its key support level, building a solid foundation for the next major leg up. The chart clearly shows a strong breakout pattern forming with higher highs and higher lows, signaling that the momentum is shifting in favor of the bulls. The well-defined support zone highlighted on the chart has repeatedly acted as a launchpad for buyers, making this area crucial for traders to watch closely. A breakout above the recent consolidation could open doors for a significant rally toward the 140% to 150% gain levels projected.
Volume for BTCUSDT remains robust, confirming the strong interest from both retail and institutional investors. This is a good sign because healthy volume typically precedes strong price action and follow-through. As Bitcoin continues to dominate the crypto market, it often sets the tone for the entire altcoin space, so a strong BTC rally could spark renewed optimism across the board. Traders are now keeping a close eye on whether BTC can maintain its position above the key psychological levels shown on the chart, as this could trigger another wave of buying momentum.
Investors are increasingly looking at BTCUSDT as a safe bet in an otherwise volatile market. Bitcoin’s fundamentals remain strong, with growing adoption, continued development, and macroeconomic conditions that could favor a hedge like BTC. Combined with the current technical setup, the outlook is promising for a big move to the upside. As we approach the next few weeks, the market sentiment suggests that any dips towards the key support level might be seen as attractive buying opportunities.
✅ Show your support by hitting the like button and
✅ Leaving a comment below! (What is You opinion about this Coin)
Your feedback and engagement keep me inspired to share more insightful market analysis with you!
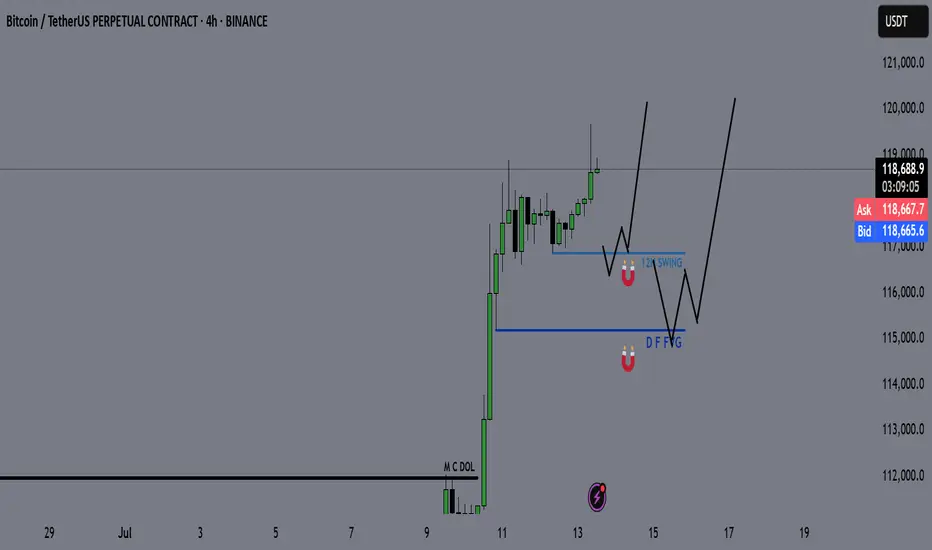
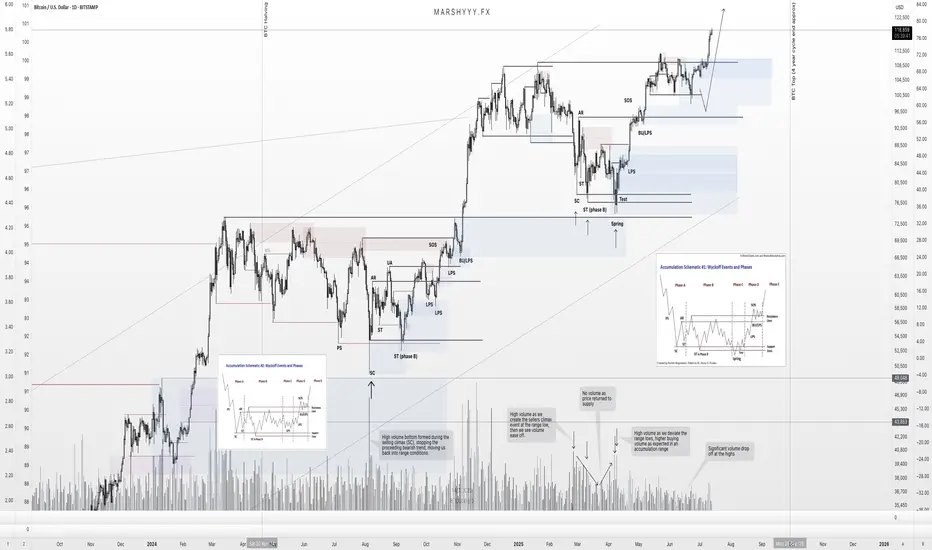
Bitcoin - BTC | Weekly Market Recap & Outlook 13.07.2025What Happened Last Week?
Bitcoin broke out of the recent downtrend structure and established a bullish leg with clear momentum.
The breakout was supported by volume and price structure, suggesting a trend reversal rather than a temporary deviation.
Weekly Bias and Strategy
The current outlook is bullish.
A retracement or sideways consolidation between the $120,000 and $114,000 zone is possible.
This zone may act as accumulation before further upside.
Key Points of Interest (POIs):
12H Swing Liquidity (turquoise line)
Daily FVG (blue line)
These levels will be monitored for long setups with confirmation on lower timeframes.
Macro Consideration – Fed Chairman Jerome Powell
Recent market speculation has increased regarding Jerome Powell potentially stepping down as Chair of the Federal Reserve.
If such a resignation is confirmed, it may act as a significant bullish catalyst for Bitcoin and other risk assets, possibly accelerating upside without allowing for any meaningful pullback.
Summary
• Bullish breakout confirmed
• Long bias maintained unless major invalidation occurs
• Watching retracement levels for entries
• Macro catalyst (Powell resignation) may trigger strong continuation without retrace