BTCUSD Market Breakdown – Liquidity Sweep Incoming?BTCUSD Market Breakdown – Liquidity Sweep Incoming?
🔍 Technical Analysis (July 29, 2025)
Chart Observations:
1. BOS (Break of Structure):
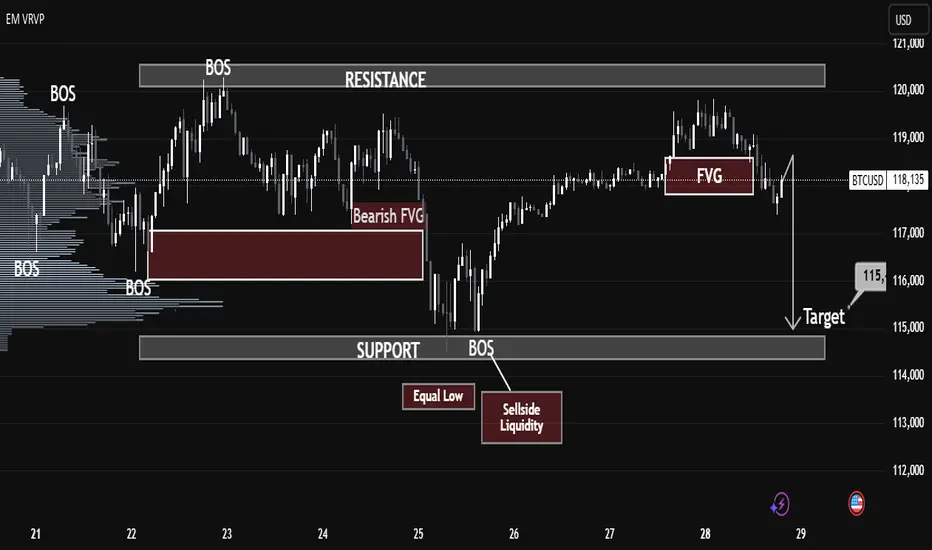
Multiple BOS events are identified, confirming key directional shifts in market structure. The last BOS near the support zone signals bearish intent.
2. Bearish Fair Value Gap (FVG):
A clean bearish FVG is left behind after a sharp drop on the 25th, indicating institutional imbalance and potential retracement area. Price rejected from that FVG later.
3. Equal Low & Sellside Liquidity:
The highlighted equal lows around July 25-26 mark areas of resting liquidity—prime targets for smart money manipulation.
4. New FVG Formed (July 28):
Another bearish FVG appears just before the projected breakdown, strengthening the case for a bearish continuation.
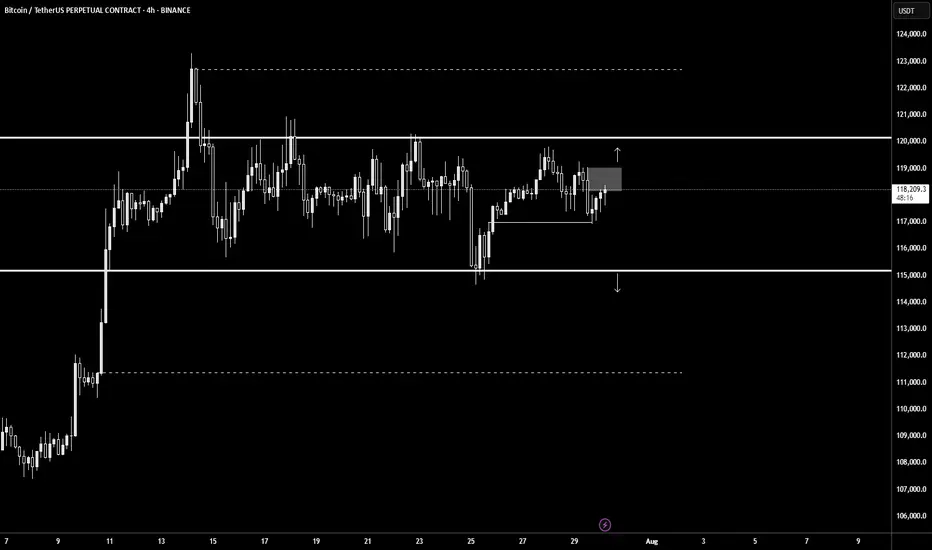
5. Support Zone Target – $115K:
A clean support zone (marked between 114,500–115,500) sits directly below the current market price. This is the likely liquidity target after sweeping equal lows.
6. Volume Profile (VRVP):
Low-volume nodes between the current price and support suggest minimal resistance to a sharp downward move.
⸻
🎯 Conclusion:
The structure, FVGs, and liquidity pools all point toward a liquidity raid below the equal lows, aiming for the support target near $115K. Traders should watch for a decisive break below the current range, especially if the FVG acts as resistance again.
BTC
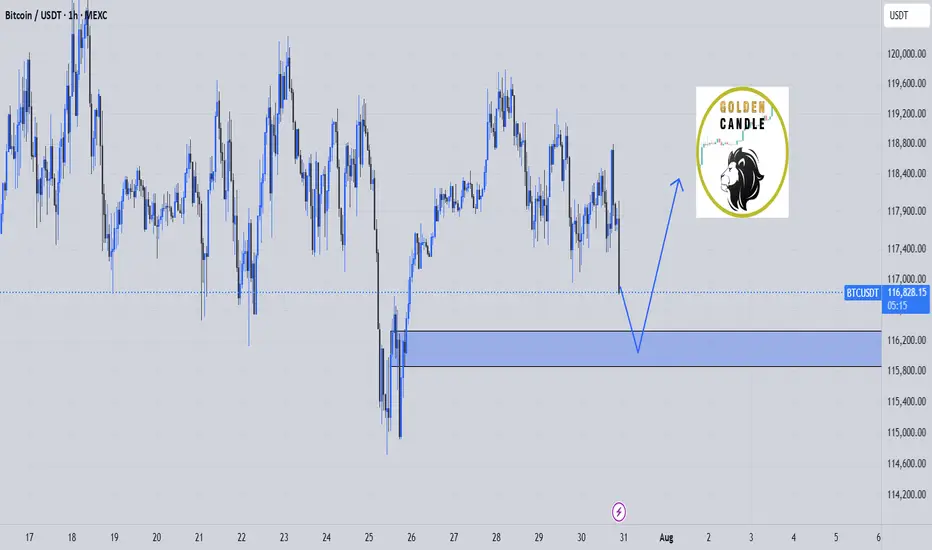
btc buy midterm"🌟 Welcome to Golden Candle! 🌟
We're a team of 📈 passionate traders 📉 who love sharing our 🔍 technical analysis insights 🔎 with the TradingView community. 🌎
Our goal is to provide 💡 valuable perspectives 💡 on market trends and patterns, but 🚫 please note that our analyses are not intended as buy or sell recommendations. 🚫
Instead, they reflect our own 💭 personal attitudes and thoughts. 💭
Follow along and 📚 learn 📚 from our analyses! 📊💡"
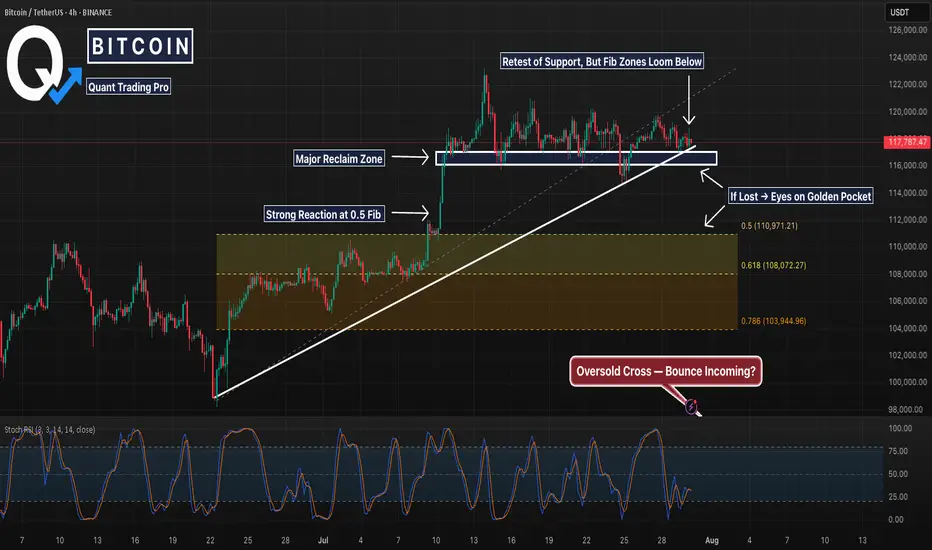
BTC 4H – Retest Holding, But Golden Pocket BelowBitcoin’s 4H chart is at a key decision point. After a strong breakout in early July, price has been consolidating just above the prior resistance zone — now acting as support. This white box represents a major reclaim level that has held multiple times, but buyers are starting to look fatigued.
Below this support lies a clean Fibonacci retracement zone:
0.5 at 110,971
0.618 (Golden Pocket) at 108,072
0.786 deeper pullback at 103,945
The structure remains intact for now, but a loss of the current level could trigger a deeper sweep into one of these fib levels — especially with momentum (Stoch RSI) resetting from oversold.
A potential bounce here keeps the uptrend alive. However, if the zone breaks, the .618 area may be the magnet.
📊 Watching for:
Strong reaction or absorption at this support
Bullish divergence forming
Sweep into golden pocket followed by reversal structure
This setup blends price action, key S/R levels, and Fib confluence — a great chart for anticipating the next move, not reacting to the last one.
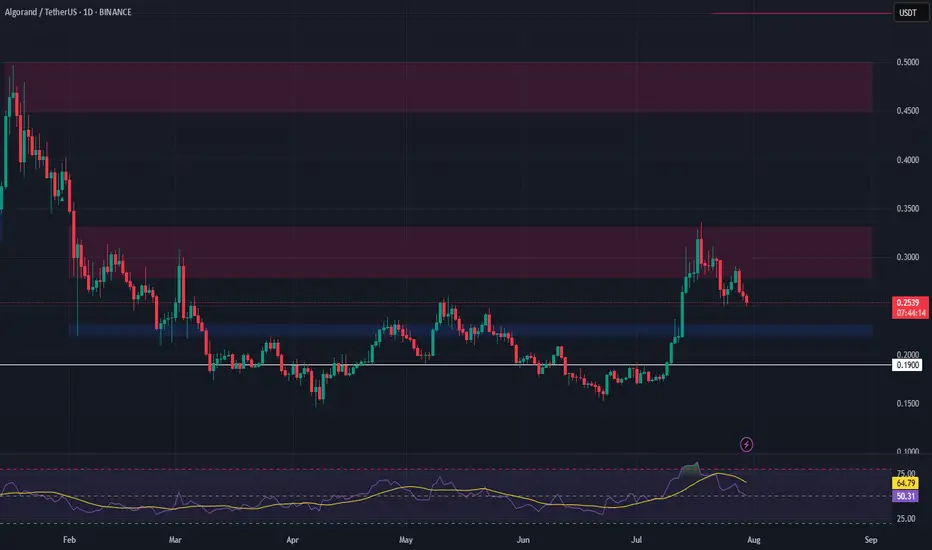
ALGO Swing Trade – Waiting for Pullback to Key SupportAfter a 100%+ surge, ALGO is now retracing and approaching a critical support zone. A dip into this area could offer a strong entry for the next leg higher.
📌 Trade Setup:
• Entry Zone: $0.22 – $0.23
• Take Profit Targets:
o 🥇 $0.28 – $0.33
o 🥈 $0.45 – $0.50
• Stop Loss: Just below $0.19
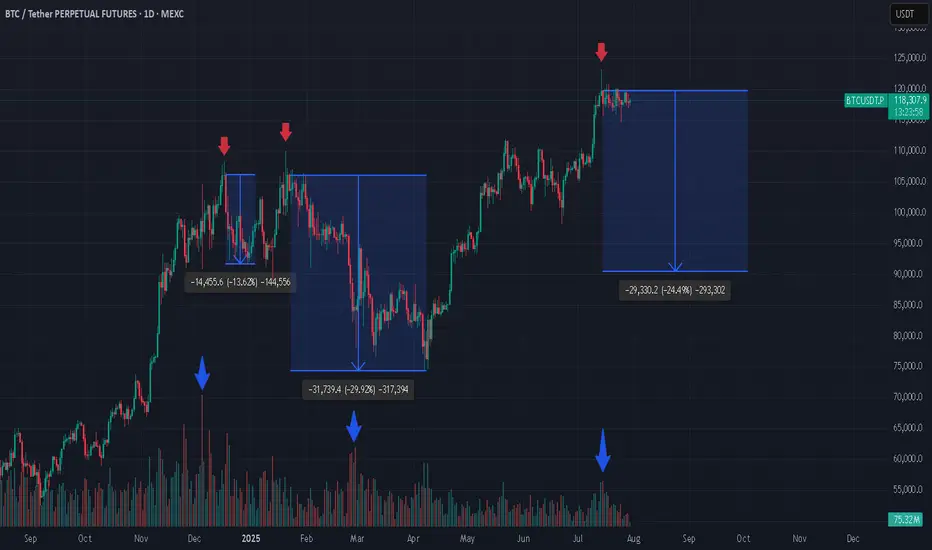
3 Bitcoin Tops, Weak Green Candles, and What’s Next? If you're closely monitoring the Bitcoin (BTC) market, patterns often begin to reveal themselves in surprising ways. In the attached chart, I’ve highlighted three major local tops that Bitcoin has made, each marked by a weak green daily candle. What’s even more striking is what comes next: a dramatic increase in trading volume, followed by steep corrections.
Spotting the Pattern: Weak Green, Heavy Volume
At each pointed top (see red arrows), BTC formed an all-time high (ATH) with a relatively weak green candle, hardly the sign of euphoric buying strength.
Look closely at the volume bars below (blue arrows). Each time, as price struggled to push higher, volume surged after the top, often a signal of major sellers stepping in or longs closing en masse.
What followed? Significant corrections: -13.6%, -29.2%, and, now it might be shaping up for another potential drop (-24.1%) if history rhymes.
Why Does This Matter?
From a technical analysis perspective, volume is the fuel behind price moves. When a new high is reached with limp buying (weak green candles) but is swiftly met with rising volume on the way down, it’s a classic sign of distribution, a strong hand selling into retail euphoria.
Is Another Drop Coming?
Given the consistency in behavior, it’s not unreasonable to ask: are we about to witness another similar correction now that BTC has again hit a top with a weak green candle and volume is ticking up? The historical evidence certainly makes it plausible.
Long-Term Perspective: Still Bullish
Despite these corrections, my long-term outlook remains bullish. Every cycle has corrections, they’re opportunities for healthy consolidation, allowing strong hands to accumulate and the market to reset for its next leg higher.
*not investment advice
#crypto #btc #bitcoin #finance #trading
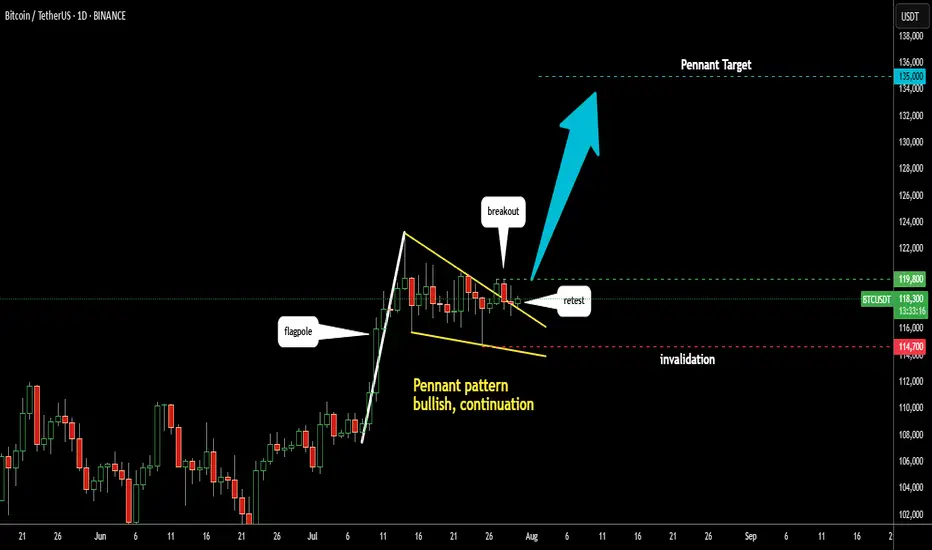
Bitcoin: Pennant - Bullish Continuation PatternI spotted a bullish continuation pattern called Pennant in Bitcoin chart
Support and resistance are marked with yellow trendlines
There is also a Flag Pole (white trendline)
The model is clean as we already see a bullish breakup and a textbook pullback
to the broken resistance.
The target is established at the height of the Flag Pole applied to the broken resistance
at $135k.
For final confirmation the price should overcome the top of breakout at $119,800
The invalidation point is located at the bottom of the Pennant at $114,700
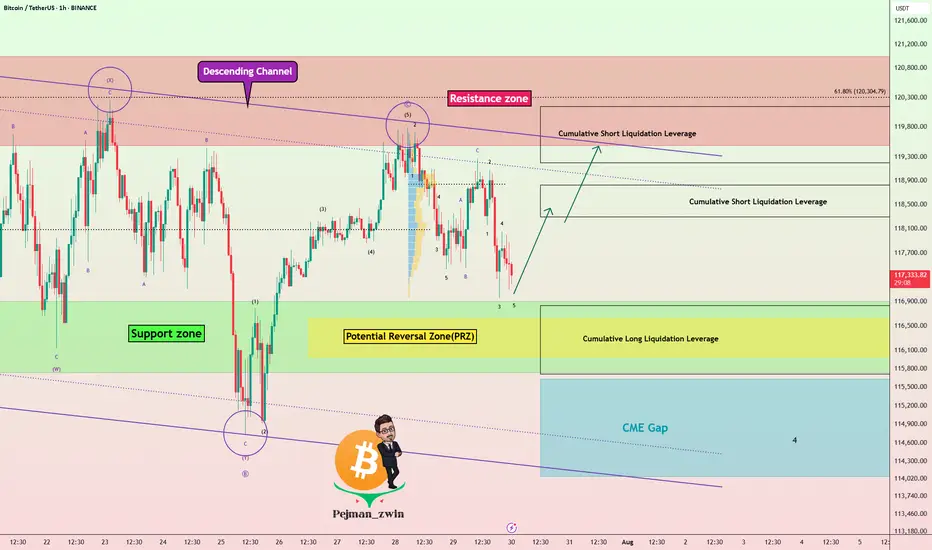
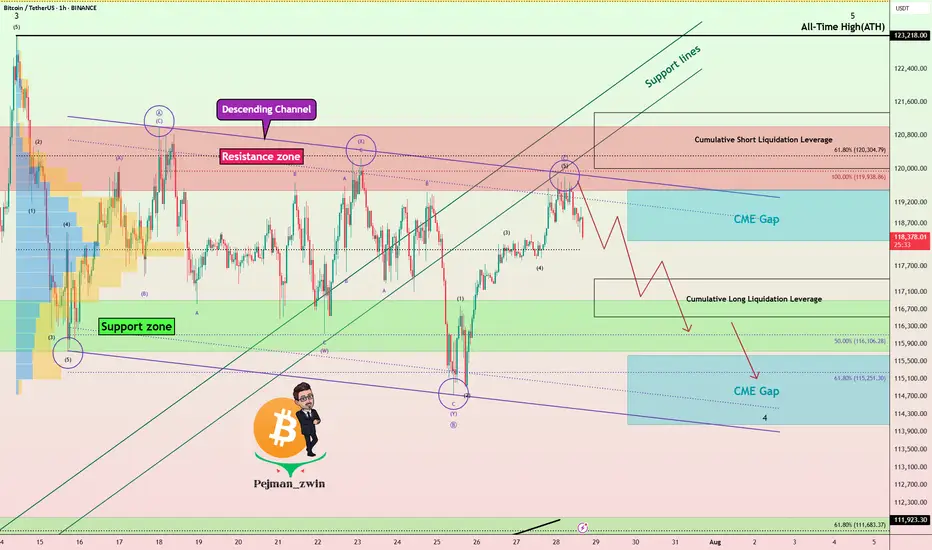
White House Crypto Report Incoming: Will BTC Pump from Support? One of the important news for Bitcoin ( BINANCE:BTCUSDT ) that was released today was that " White House confirms first Bitcoin and crypto report will be released TOMORROW ". Bitcoin is likely to rise with the release of the White House report .
What do you think? At least a temporary pump may be in store for Bitcoin.
Bitcoin fell to the Support zone($116,900-$115,730) and filled the New CME Gap( $119,500-$118,295) as I expected in the previous idea .
Bitcoin is currently moving near the Support zone($116,900-$115,730) , Cumulative Long Liquidation Leverage($116,828-$115,710) and Potential Reversal Zone(PRZ) .
I expect Bitcoin to rise from the Support zone($116,900-$115,730) to at least $118,680(First Taregt) .
Second target: Upper line of the descending channel
Note: Stop Loss: $114,680 = Worst Stop Loss(SL)
CME Gap: $115,060-$114,947
Cumulative Short Liquidation Leverage: $118,827-$118,298
Cumulative Short Liquidation Leverage: $120,144-$119,200
Please respect each other's ideas and express them politely if you agree or disagree.
Bitcoin Analyze (BTCUSDT), 1-hour time frame.
Be sure to follow the updated ideas.
Do not forget to put a Stop loss for your positions (For every position you want to open).
Please follow your strategy and updates; this is just my Idea, and I will gladly see your ideas in this post.
Please do not forget the ✅' like '✅ button 🙏😊 & Share it with your friends; thanks, and Trade safe.
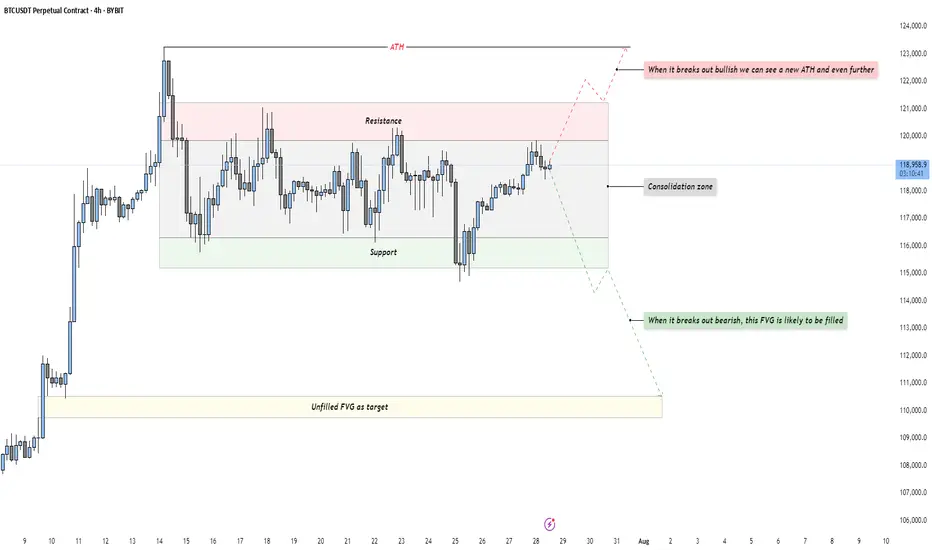
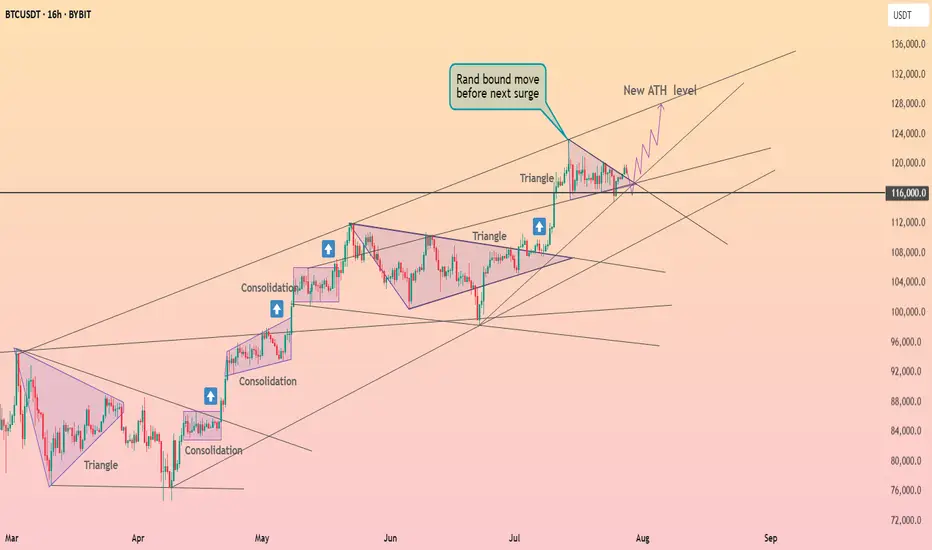
BTC - Bulls vs Bears: who will win?Market Context
Bitcoin is trading in a tight consolidation just below its all-time high after a strong impulsive rally. This phase represents a balance of power between buyers and sellers, with neither side able to take control yet. Such a pause in momentum at this key level often builds pressure for a breakout move as liquidity pools accumulate above and below the range.
Consolidation Phase
The current range is clearly defined by a resistance area at the top and a support area at the bottom. Price has been oscillating within these boundaries without any sustained breakout attempts. This range-bound behavior is an essential part of the market cycle, as it allows larger players to build or distribute positions. The longer price stays in this box, the more significant the breakout that follows tends to be.
Bullish Breakout Scenario
If price breaks out decisively above resistance, it would indicate buyers have absorbed all the supply at these levels. Such a breakout opens the path to a new all-time high and could potentially extend far beyond as trapped shorts are forced to cover. For traders, a retest of the breakout level on lower timeframes could provide a low-risk entry point for continuation to the upside.
Bearish Breakout Scenario
On the flip side, if support fails, the market will likely gravitate toward the unfilled Fair Value Gap left behind during the previous rally. This inefficiency becomes a natural draw for price, offering a logical downside target for a corrective move. A clean break below the range followed by a retest from underneath could present shorting opportunities for those aiming to capture that move into the FVG.
Final Words
Patience and precision are key when dealing with setups like this. Let the market come to your level — and react with intent.
If you found this breakdown helpful, a like is much appreciated! Let me know in the comments what you think or if you’re watching the same zones.
BTCUSDT.PThe best area to buy MARKETSCOM:BITCOIN is $119,000 and wait for the pullback to be complete.
But for selling and shorting, be sure to wait for $115,000 to break down.
⚠️Please control risk managements.
Bitcoin Passes Stress TestOn July 25, 2025, Galaxy Digital executed one of the largest Bitcoin sales ever recorded: 80,000 BTC, valued at approximately $9 billion , on behalf of a Satoshi-era investor.
Despite the size, the market absorbed the flow with minimal volatility—Bitcoin dipped from around $119,000 to $115,000, then rebounded above $119,000.
Liquidity Maturity in Motion
Analysts called the trade a significant demonstration of market maturity, noting that 80,000 BTC was absorbed in days with barely a market blip.
Crypto infrastructure has also evolved: algorithmic liquidity providers, institutional desks, and OTC channels handled the load without triggering cascading funding rate hikes or forced liquidations.
Ongoing Risks
Event-Driven Stress: During macro shocks or sharp sell-offs, liquidity may thin, and the same level of absorption might not persist.
OTC vs Exchange: This large sale was managed mostly off-exchange. A similar-sized on-exchange dump could still trigger stop-run cascades.
Retail Complacency Risk: The stability seen now can be deceptive, as retail may misinterpret low volatility as a safe leverage zone, only to be caught off-guard.
Projections:
Watching the 23.6% fib retracement level in line with the $116,600 price level. Anticipate the resistance level of $120,000 to be retested.
If price breaks above $120,000, we could see a significant move toward $130,000
The $9B BTC sale went through without materially impacting price is considered a milestone in crypto market evolution. It reflects institutional-grade liquidity and sentiment maturity.

VRA/USDT THE RETURN TO KEY LEVELVra has good chance to return to the key level, since the last data shows a growth in the volume.

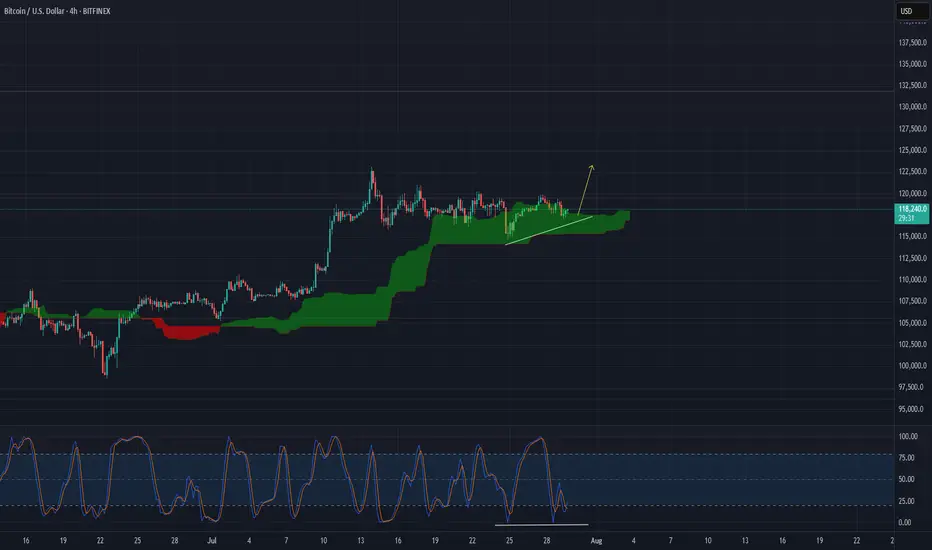
BTC USDBITFINEX:BTCUSD
This current four hour Ichi cloud will likely fail and we see some decent downside but there is always that chance we respect the cloud and finish heading towards 131k.
Looking at the daily/weekly tf's I'm assuming one more move higher before we sell off relatively soon within the weekly time frames narrative so within some months.
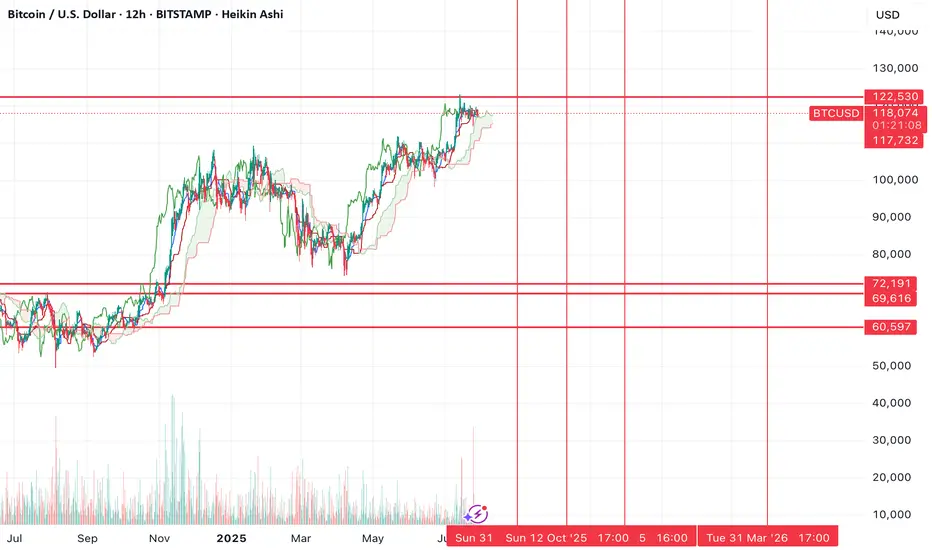
BTC highs in, new lows coming soon?~$122.5k was the top of the range. Now we'll need to go test the lows before we can continue higher.
Alts are clearly not confirming a trend change .
Many still bearish on HTFs (including ETH), I think the reason is because Bitcoin goes lower before we see a continued run and that will drag down alts with it. I think people holding alts here with hopes for new highs (in the near future) are about to have their hopes crushed, that also goes for people long crypto miners.
I don't think the real run starts until end of 2025 or 2026.
Time will tell.
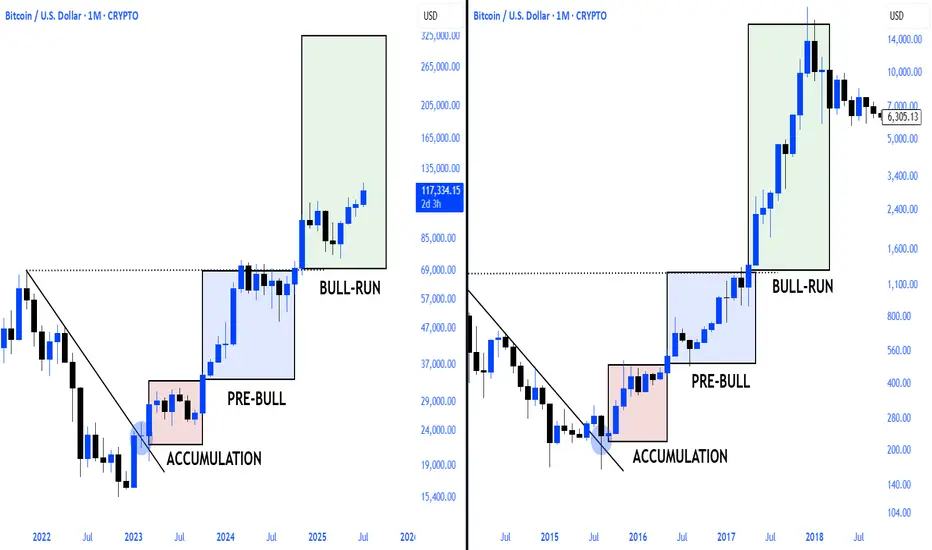
$BTC 2013\2017 vs. 2021\2025bitcoin is exactly repeating the reflection of the 2013-2017 period
zoom out!
Bitcoin Rejected Near $120K – Bears Wake Up!First of all, I have to say that Bitcoin’s movements over the last 12 days have been a bit difficult to trade , generally, the hardest market to make a profit in is the range market with a swing movement .
Bitcoin( BINANCE:BTCUSDT ) is currently trading near the Resistance zone($121,000-$119,500) , Cumulative Short Liquidation Leverage($121,336-$120,000) , and the upper line of the descending channel .
Since Bitcoin has lost support lines , we can consider this increase in Bitcoin over the last two days as a pullback to the support lines(broken) . Do you agree with me!?
In terms of Elliott Wave theory , it appears that Bitcoin is still completing the main wave B. The main wave B is a Regular Flat(ABC/3-3-5) . The structure of the microwave B of the main wave B was a Double Three Correction(WXY) .
Additionally, the SPX 500 index ( SP:SPX ), which Bitcoin is correlated with , is poised for a correction in my opinion, which could also impact Bitcoin .
Also, unlike previous Mondays, MicroStrategy has NOT purchased Bitcoin , and the company currently holds 607,770 BTC .
Old Bitcoin wallets also seem to be waking up to the fact that they can create movements in the crypto market . " In recent days, 471,867.8 BTC worth $56.39 million have been transferred from old wallets from 2012 to 2017 . ".
I expect Bitcoin to decline to at least the Support zone($116,900-$115,730) and fill the CME Gaps in the coming hours .
New CME Gap: $119,500-$118,295
CME Gap: $115,060-$114,947
Cumulative Long Liquidation Leverage: $117,401-$116,615
Please respect each other's ideas and express them politely if you agree or disagree.
Bitcoin Analyze (BTCUSDT), 1-hour time frame.
Be sure to follow the updated ideas.
Do not forget to put a Stop loss for your positions (For every position you want to open).
Please follow your strategy and updates; this is just my Idea, and I will gladly see your ideas in this post.
Please do not forget the ✅' like '✅ button 🙏😊 & Share it with your friends; thanks, and Trade safe.
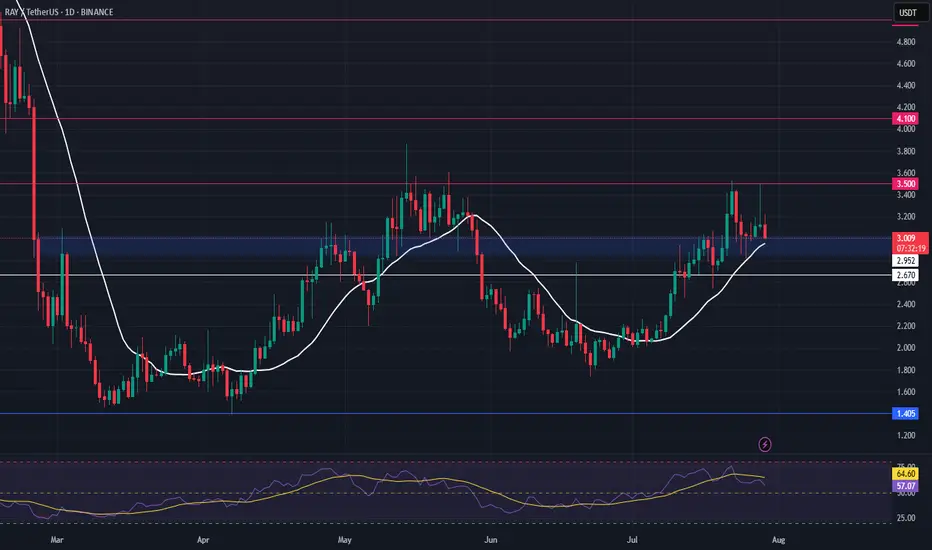
RAY Swing Trade – Key Support Retest in PlayRAY is pulling back toward a major support zone, offering a solid opportunity to position for a bounce as market structure remains constructive.
📌 Trade Setup:
• Entry Zone: $2.85 – $3.02
• Take Profit Targets:
o 🥇 $3.50
o 🥈 $4.10
• Stop Loss: $2.67
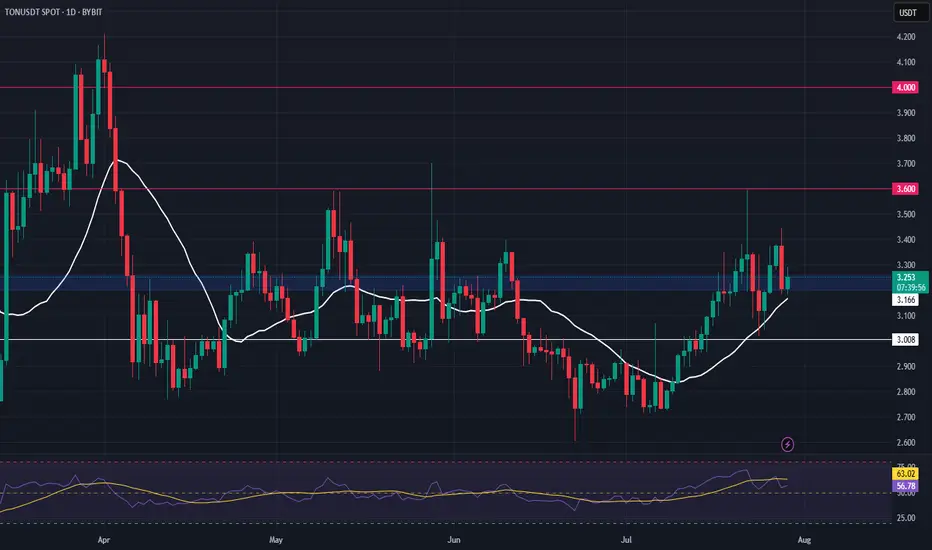
TON Swing Trade – Support Zone in FocusTON is holding a major support level, setting up for a potential bounce. With structure intact, this offers a favorable long entry for swing traders looking to capitalize on the next leg up.
📌 Trade Setup:
• Entry Zone: $3.20 – $3.35
• Take Profit Targets:
o 🥇 $3.60
o 🥈 $4.00
• Stop Loss: $3.088
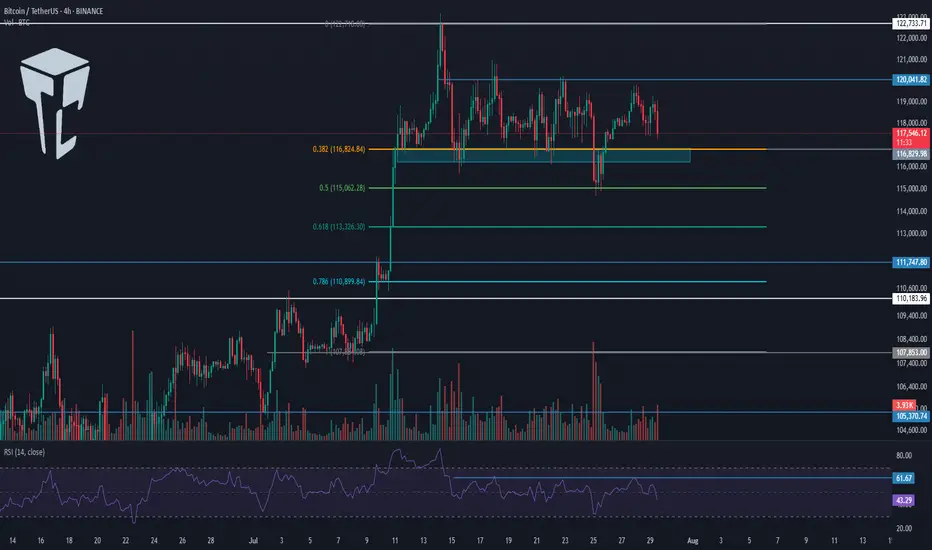
TradeCityPro | Bitcoin Daily Analysis #139Welcome to TradeCity Pro!
Let's go over Bitcoin's analysis. Today, Bitcoin is showing some signs regarding its next move, and today could be a critical day — especially considering that U.S. interest rate data is set to be released tomorrow.
4-Hour Timeframe
Today, there’s no need to switch to other timeframes — this 4-hour chart tells us everything.
Yesterday, the price was moving toward the 120041 area, which we intended to use as a long trigger, but that didn’t happen. The price failed to stabilize above this level, and RSI was rejected from the 61.67 zone.
Currently, the price has formed a lower high compared to 120041 and is now moving toward the support area around 116000.
Selling volume has significantly increased, which is not good for the bullish trend. If this support level breaks, deeper corrections to the 0.618 or even 0.786 Fibonacci levels could occur.
I’ll take profit on my long position that I opened from below 110000 if the price stabilizes below this zone, but I absolutely won’t open any short positions for now.
In my opinion, as long as the price is above 110000, any drop or correction is simply a better entry point for a long position. However, we shouldn’t buy during a falling market — we must wait for our triggers to activate.
Bitcoin is testing the boundaries of the triangle ┆ HolderStatBINANCE:BTCUSDT is printing higher lows along trendline support near $67,800. The price is compressing into a wedge below $69,000 resistance. A breakout would confirm continuation toward $71,000–$72,000. Momentum remains intact unless $67.5k is broken. The market is building pressure for the next impulsive move.
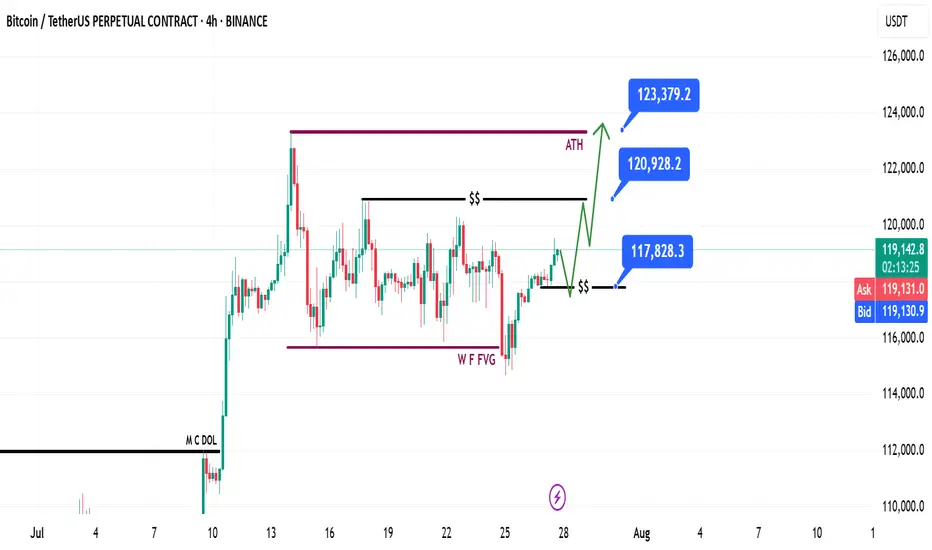
Bitcoin Weekly Recap & Gameplan | 27.07.2025📈 Market Context:
Bitcoin maintained its bullish momentum, driven by continued institutional demand and a supportive U.S. policy backdrop.
Last week’s gameplan played out well — solid profits were captured (see linked chart below).
🧾 Weekly Recap:
• Price made a bullish retracement into the Weekly FVG (purple line) exactly as projected in last week's post.
• From here, I expect continuation toward new all-time highs.
📌 Technical Outlook:
→ First, I expect a short retracement and a 4H swing liquidity grab at 117,828$.
→ Then, a strong continuation move toward ATH targets.
🎯 Setup Trigger:
Watch for:
✅ 4H liquidity sweep
✅ 15M–30M bullish break of structure (BOS)
This is the confirmation zone for potential long setups.
📋 Trade Management:
• Stoploss: Below confirmation swing low
• Targets:
– 120,938$
– 123,400$
💬 Like, follow, and drop a comment if this outlook helped — and stay tuned for more setups each week!
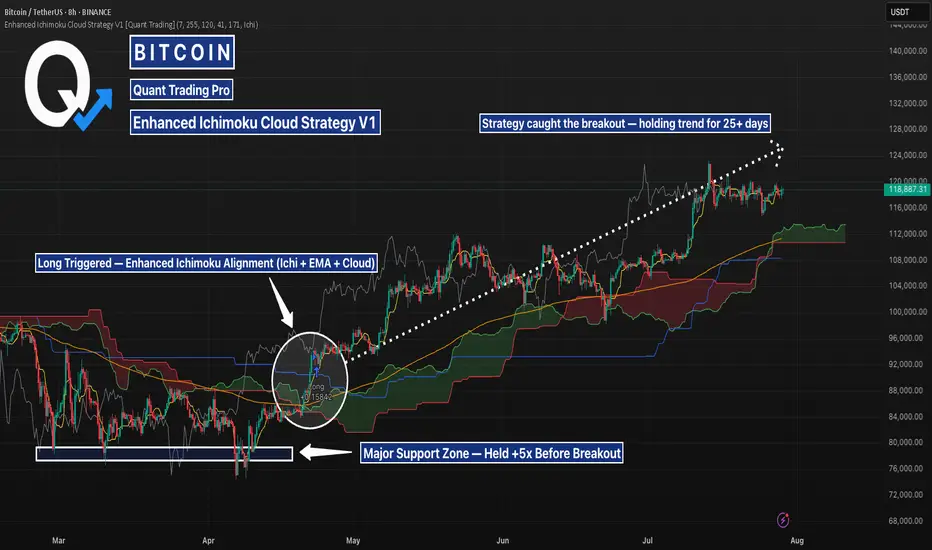
BTCUSD 8H – Long Triggered on Cloud Flip, Can This Trend Keep?This BTC 8H setup highlights how the Enhanced Ichimoku Cloud Strategy V1 caught a +27% move using clean trend confirmation and a low-noise entry.
📊 Setup Breakdown:
Major Support Zone held 5+ times between March and April — confirming buyer interest.
Entry triggered once:
Ichimoku Cloud flipped bullish
Price crossed the 171 EMA
Strategy alignment confirmed by Ichi + EMA + Cloud filters
Entry candle: ~$93,400
Current price: ~$119,000 → +27% trend continuation.
📈 Strategy Logic:
This system combines:
Custom Ichimoku (7 / 255 / 120 / 41) for cloud confirmation
A 171 EMA filter to block noise
A trend-following “state memory” logic to avoid premature reversals
This BTC move is a textbook example of how the strategy avoids second-guessing and holds strong trends without constant recalibration.
⚠️ What to Watch Next:
Price is currently ranging near prior highs
Cloud remains bullish, but RSI and momentum divergence should be monitored
If support holds above ~112K, continuation is likely — break below could shift structure
✅ Backtest this strategy on your charts to see how it handles your favorite assets.
It’s best used on high-timeframe trends where precision and conviction matter most.
BITCOIN PREDICTION - MASSIVE CANDLE INCOMING!!! (WARNING) Watch this Bitcoin Prediction video now, you will love it!
Yello, Paradisers! Big warning sign: #Bitcoin is about to liquidate more traders soon if we get these confirmations that I'm sharing with you in this video. Loads of people will get wrecked again. Be careful not to get trapped into fakeouts.
In this video, I'm describing exactly what I'm seeing on Bitcoin, what patterns I'm waiting to form, and what confirmations I want to see before being able to say with 100% accuracy guaranteed that MARKETSCOM:BITCOIN is moving in that direction.
I'm sharing with you all the important targets and also how professional trading works: how risk-reward proper ratio trading works, and how high-probability trading depends a lot on how you choose to create your trades.
Watch this Bitcoin prediction to understand what I'm seeing right now on the chart and how I'm acting and making my decisions.

BTC Trade Plan: Watching for Break and Retest Above Daily Range🟠 Bitcoin (BTC) is currently trading range-bound on the daily timeframe ⏳📉📈. I’m monitoring price action for a bullish break and retest 🔓🔁 of the current range to confirm a potential long entry 🎯.
📍 Key levels are already marked on the chart 🗺️—
🛑 Stop-loss would sit just below the previous swing low,
🎯 Target aligns with the higher price zone marked out to the left of the chart 🔼👈.
This is a classic range breakout setup—patience and precision are key.
🧠 As always, this is not financial advice.
