BITCOIN → Hunting for liquidity. Retest resistance before a fallBINANCE:BTCUSDT.P continues to consolidate after a strong rally. There is no strong driver yet, and Bitcoin is reacting weakly to economic data. There is a possibility of a continued correction...
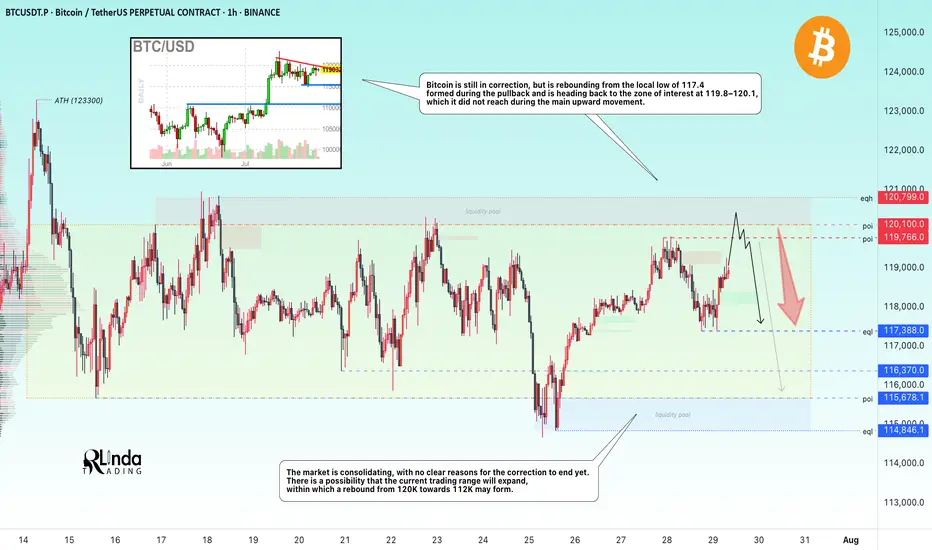
Bitcoin is still in correction, but is rebounding from the local low of 117.4, formed during the pullback, and is heading back up towards the zone of interest at 119.8-120.1, which it did not reach during the main upward movement. I see no fundamental or technical reasons for the correction to end and for growth beyond 121K. I expect a rebound from the resistance zone towards 115-114K. However, in the medium term, I expect the market to attempt to close half or all of the gap between 112K and 114.8K, thereby expanding the key trading range.
Resistance levels: 119.77, 120.1K, 120.8K
Support levels: 117.4, 116.37, 115.68
Technically, a false breakout (liquidity capture) of key resistance and price consolidation in the selling zone could trigger bearish pressure on the market, which in turn would lead to a correction.
Best regards, R. Linda!
BTC
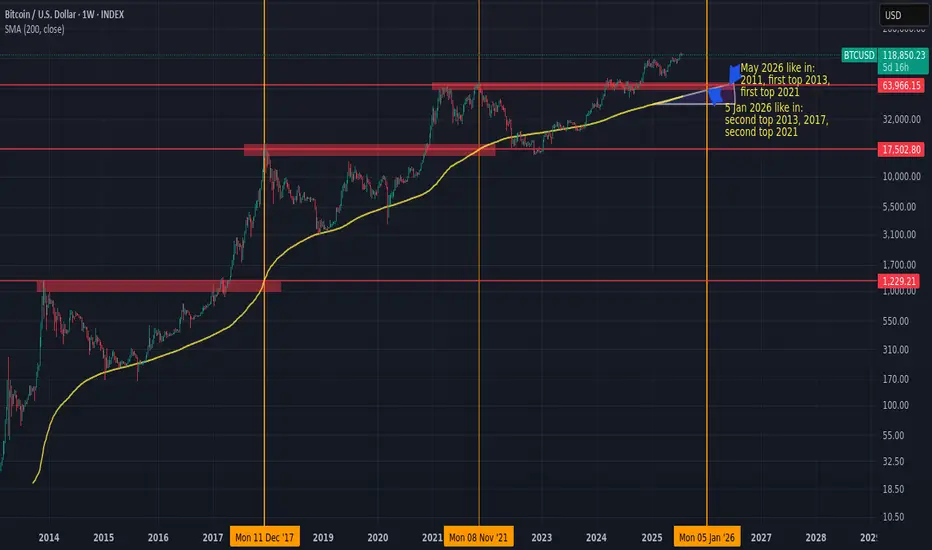
Next BTC topHistorically, BTC/USD has tended to peak when the 200-week simple moving average (200W SMA) approaches or crosses the high from the previous market cycle.
If this pattern holds, and assuming the 200W SMA continues rising at its current pace, the next top could occur sometime between January and May 2026.
If BTC accelerates earlier, the moving average would steepen, potentially shifting the timing forward.
Something worth watching to manage risk and position sizing accordingly.
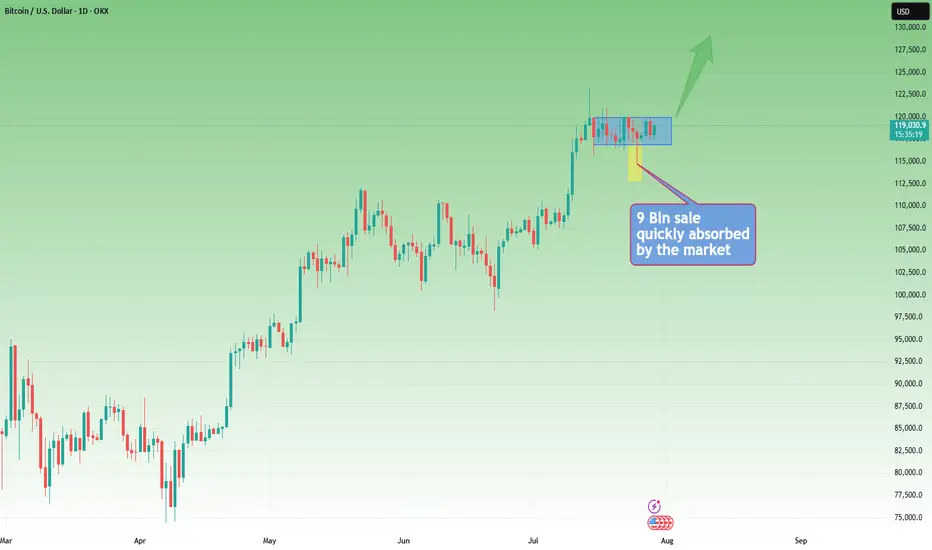
Rectangle Consolidation + Bull Trend = BTC Setup for ATHYesterday, Bitcoin dipped and recovered again, following last week's sharp spike down, triggered by the $9B Galaxy Digital sale on behalf of a Satoshi-era investor.
________________________________________
🧠 Why is this important?
Despite being one of the largest BTC sales in history, the move only caused a temporary spike down.
That’s a clear sign of market strength and strong interest on dips.
________________________________________
📉📈 Current Technical Context:
• If we ignore the spike, price is consolidating in a tight rectangle
• That’s typically a continuation pattern
• The broader trend remains strongly bullish
📌 Put all of that together, and we have at least 3 reasons to expect upside continuation
________________________________________
🎯 Key Levels:
• Break + daily close above $120K → likely leads to a new ATH and a potential test of $130K
• Invalidation only comes with a break below $114K
________________________________________
Conclusion:
BTC just absorbed a massive $9B sell without blinking.
As long as $114K holds, I'm bullish and expecting continuation.
Next leg could (and I hope it will) be explosive. 🚀
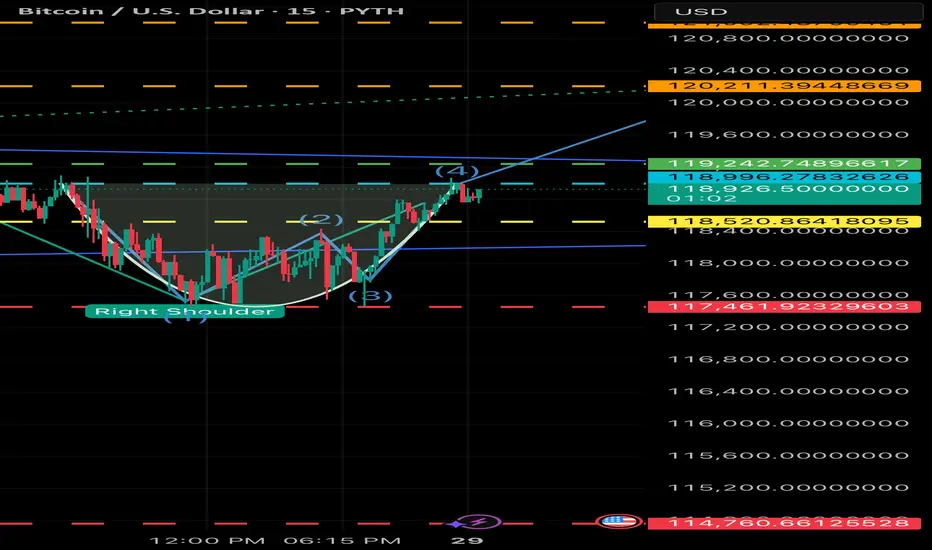
BTC BULLISH - Cup and handle just formed inside the 15 min How many more bullish signals can we see;
1 Day =Bullish Fag pole
1 hour =inverted head and shoulder
15 min =Cup and handle *waiting for confirmation*
Bullish bounce off swing low support?The Bitcoin (BTC/USD) is falling towards the pivot and could bounce to the 1st resistance.
Pivot: 115,415.51
1st Support: 113,466.96
1st Resistance: 120,573.43
Risk Warning:
Trading Forex and CFDs carries a high level of risk to your capital and you should only trade with money you can afford to lose. Trading Forex and CFDs may not be suitable for all investors, so please ensure that you fully understand the risks involved and seek independent advice if necessary.
Disclaimer:
The above opinions given constitute general market commentary, and do not constitute the opinion or advice of IC Markets or any form of personal or investment advice.
Any opinions, news, research, analyses, prices, other information, or links to third-party sites contained on this website are provided on an "as-is" basis, are intended only to be informative, is not an advice nor a recommendation, nor research, or a record of our trading prices, or an offer of, or solicitation for a transaction in any financial instrument and thus should not be treated as such. The information provided does not involve any specific investment objectives, financial situation and needs of any specific person who may receive it. Please be aware, that past performance is not a reliable indicator of future performance and/or results. Past Performance or Forward-looking scenarios based upon the reasonable beliefs of the third-party provider are not a guarantee of future performance. Actual results may differ materially from those anticipated in forward-looking or past performance statements. IC Markets makes no representation or warranty and assumes no liability as to the accuracy or completeness of the information provided, nor any loss arising from any investment based on a recommendation, forecast or any information supplied by any third-party.

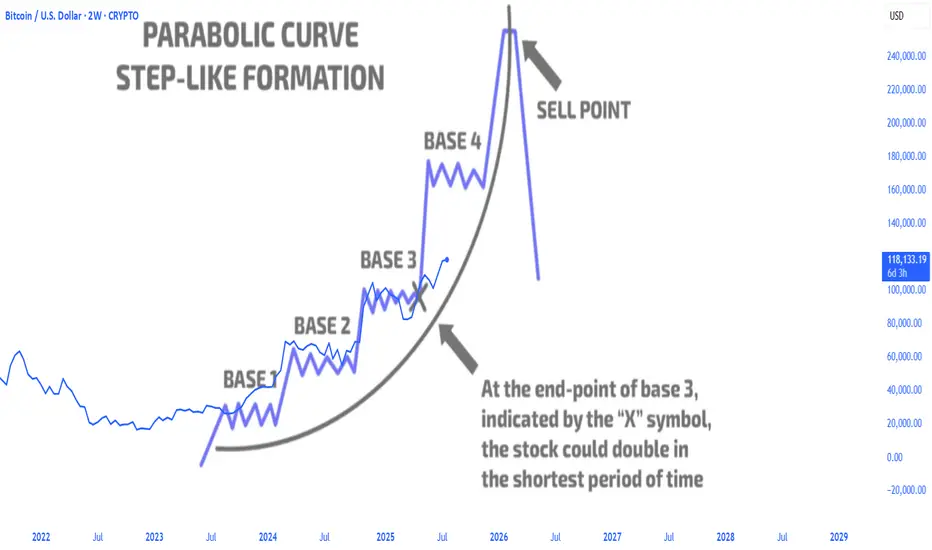
btc parabolic curvebitcoin parabolic curve pattern exits the base3 accumulation area and continues to rise sharply, with more to come
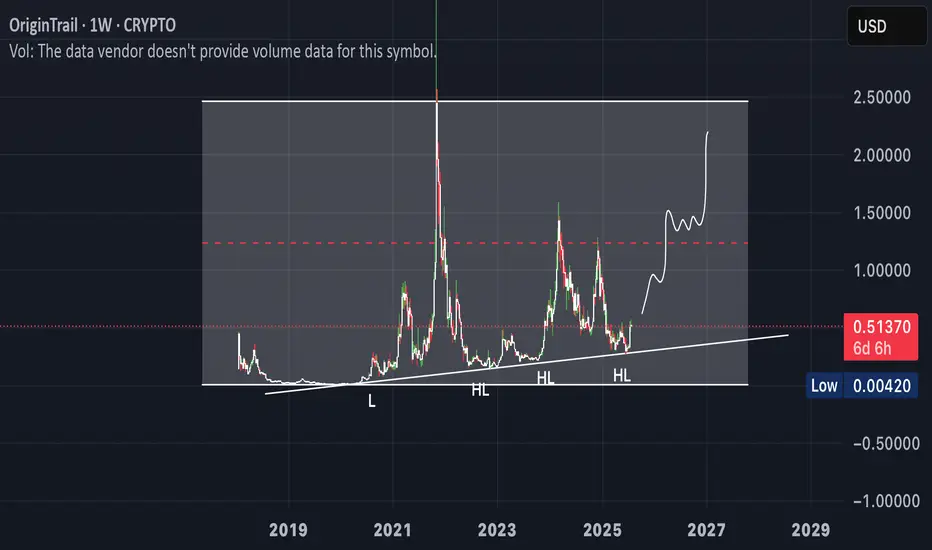
OriginTrail This blockchain will be a performer in the coming bear market. This chain is what the world needs, keep your eyes on this one.
We have a series of higher lows aiming for a breakout
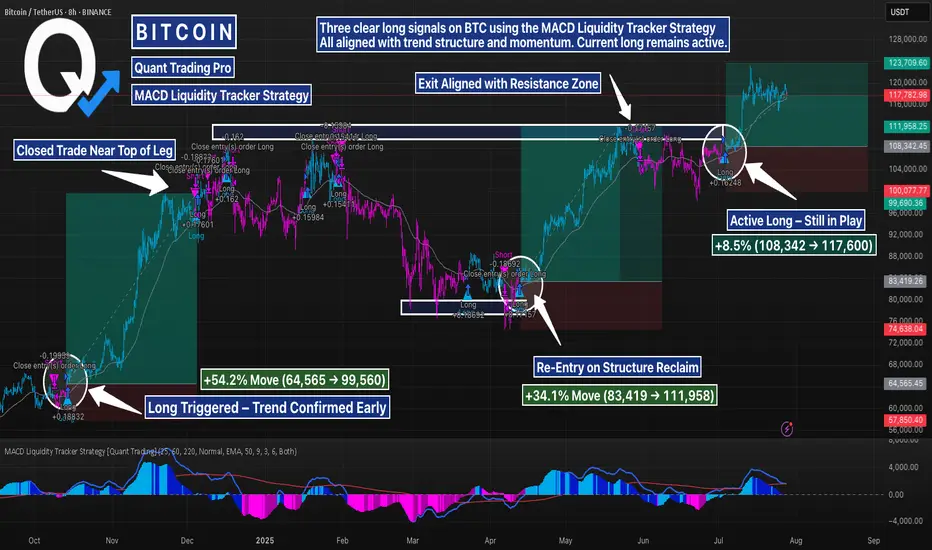
BTC MACD Liquidity Tracker Strategy – High Timeframe Long CallsThis BTC 8H chart shows how the MACD Liquidity Tracker Strategy has tracked trend structure cleanly across multiple long signals — each aligning momentum and EMA bias on the mid-to-high timeframe.
First long: Triggered at ~64,565 and exited near 99,560 as momentum peaked
Second long: Re-entry at 83,419 after reclaiming structure, closed near 111,958
Third long (active): Triggered at 108,342 and currently holding above 117,000 with trend still intact
Color-coded bias (blue/pink) helps confirm context at a glance. The combination of MACD momentum shifts + 60/220 EMA filters prevents early entries and helps capture large legs without excessive noise.
Want to explore or customize the strategy?
Search “MACD Liquidity Tracker Strategy ” and run your own backtests to refine parameters per asset.
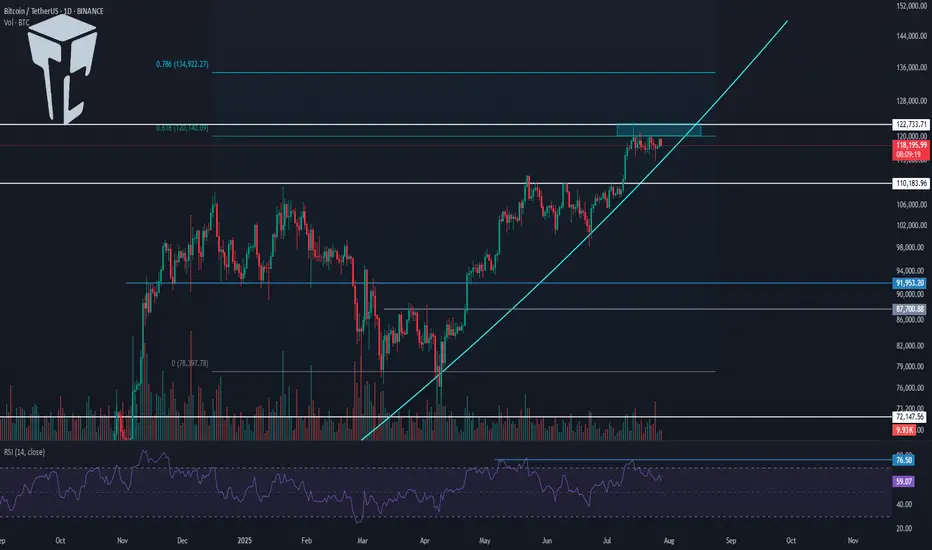
TradeCityPro | Bitcoin Daily Analysis #138👋 Welcome to TradeCity Pro!
Let’s get into the Bitcoin analysis. Today is the start of the week, and it’s very important to begin our trading week with the right analysis and outlook.
📅 Daily Timeframe
On the daily timeframe, as you can see, not much has changed compared to the previous analysis, and the price is still ranging near the supply zone.
✔️ The fact that no price correction has occurred so far shows the strength of the buyers, and even if a correction does happen, as long as the price stays above 110183, the trend will still be considered bullish.
🧩 The main trigger for trend continuation is either the price reaction to the curved trendline or the break of 122733. We can find more optimal triggers in the lower timeframes.
⏳ 4-Hour Timeframe
In this 4-hour timeframe, after a fakeout below 116829, the price corrected down to the 0.5 Fibonacci level and now has returned again to the box between 116829 and 120041.
🔍 The fakeout trigger is 120041, and I’ll try to have at least two positions open in the market when this level breaks — whether on Bitcoin or altcoins.
📈 The main trigger for the next bullish leg is 122733.
If RSI also breaks the 61.67 resistance alongside 120041, the likelihood of the move continuing will increase.
❌ Disclaimer ❌
Trading futures is highly risky and dangerous. If you're not an expert, these triggers may not be suitable for you. You should first learn risk and capital management. You can also use the educational content from this channel.
Finally, these triggers reflect my personal opinions on price action, and the market may move completely against this analysis. So, do your own research before opening any position.
Very important Economic Calendar 28.07–01.08: FOMC, BTC, tariffsThis Week (July 28 – August 1) — the final week of the month is packed with key events.
Save this post and forward it to 3 friends 😉
📋 High volatility ahead — as the Fed’s key "threelemma" (inflation, labor market, tariffs) comes into focus.
Several important macro releases are scheduled — each one matters on its own, but combined, they can move markets sharply.
🗓 Monday (July 28)
▪️ 12:30 UTC – QRA (Part 1): upcoming US Treasury borrowing needs
▪️ 16:00 UTC – 2Y & 5Y bond auctions – key indicator of market expectations ahead of FOMC
🔗 Strong demand = stronger rate cut expectations
🗓 Tuesday (July 29)
▪️ 12:30 UTC – US GDP (Q2 estimate)
▪️ 16:00 UTC – 7Y bond auction
🗓 Wednesday (July 30)
▪️ 12:15 UTC – ADP employment report – early signal ahead of NFP
▪️ 12:30 UTC – QRA (Part 2): breakdown of Treasury borrowing
▪️ 18:00 UTC – FOMC rate decision (no change expected – 4.5%) + Powell’s press conference
🗓 Thursday (July 31)
▪️ 12:30 UTC – PCE inflation (June) – Fed’s favorite inflation gauge
🗓 Friday (August 1)
▪️ 12:30 UTC – Nonfarm Payrolls (employment)
▪️ 13:00 UTC – ISM Manufacturing Index (July)
▪️ 13:00 UTC – Univ. of Michigan Consumer Sentiment Index
▪️ All day – July auto sales data
🚨 LIBERATION DAY 2.0
Potentially the most impactful event of the week: the Trump administration will begin sending “tariff letters” to ~200 countries.
This marks the end of the temporary tariff relief (April 8 – August 1).
Markets expect a new wave of global trade tension — timing is still uncertain.
💡 Summary:
Every day brings a new potential driver.
Markets are nervous and highly reactive — sharp moves are likely...
CRYPTOCAP:BTC is currently being held above $117K, but Wednesday and Friday bring high risk of "news bombs".

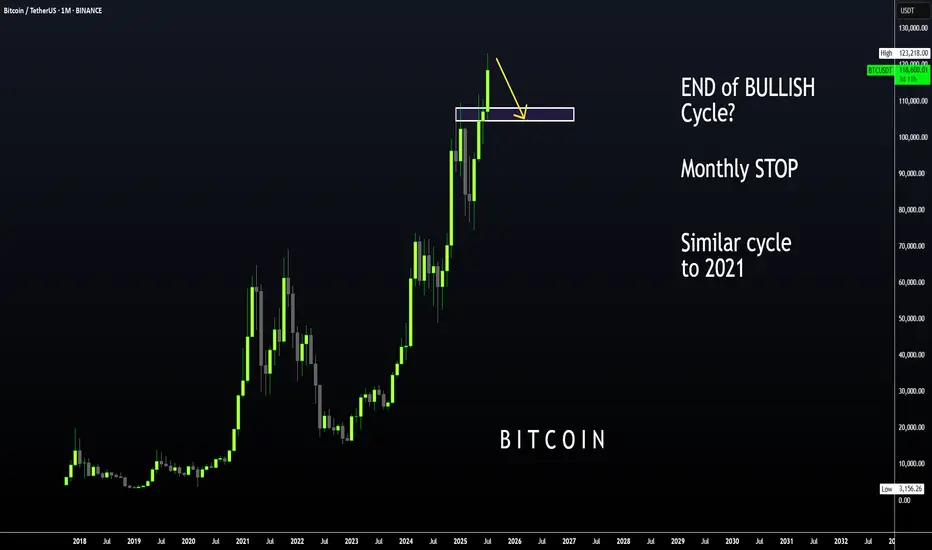
BTC | ALT Season, then BEARISH CYCLE BeginsBitcoin is likely moving in to the beginning of a bearish cycle.
I'm not saying this is immediate, we first need to see altseason - however, if BTC increases it may not go any higher than the last high of $123k. We could easily see the price hover around this zone with a few small increases and decreases for the next few weeks as alts make their respective moves.
I have been talking about the 2021 fractal for a couple of months, where BTC took its time to correct and then made another ATH which was only slightly higher.
We already see a similar pattern playing out in the monthly timeframe if we overlay bars pattern from 2021:
Although Bonce zone 3 may only be in several months, these are the major support zones where BTC could bounce from. Ideal for a swing:
____________________
BINANCE:BTCUSDT
BITCOIN PREDICTION: HUGE BREAKOUT SOON!! (watch this level) Yello Paradisers! I'm sharing with you multi-timeframe analysis on Bitcoin, levels to watch out for, confirmations we are waiting for, and everything needed for successful professional trading that is being profitable in the long run.
I'm sharing with you zig-zag from the Elliot Wave pattern formation. I'm also sharing a possible impulse we are going through, a head and shoulders pattern and its target, and the next major resistance and support levels.
I'm sharing with you a contracting triangle setup and how to trade it, along with an ending diagonal setup and how to trade it. Watch out for confirmations and how the price is developing based on what I have been talking about in this video, then trade it as a professional trader should.
Make sure that you have a great risk management, trading strategy, and tactic for entering the trades. I have explained some tactics that I'm watching for in this video, but make sure that all these tactics are well within your larger trading strategy and that you're approaching the market professionally. Don't try to get rich quick.
Make sure that you are focusing on long-term profitability and survival. This is the only way you can make it in crypto trading!

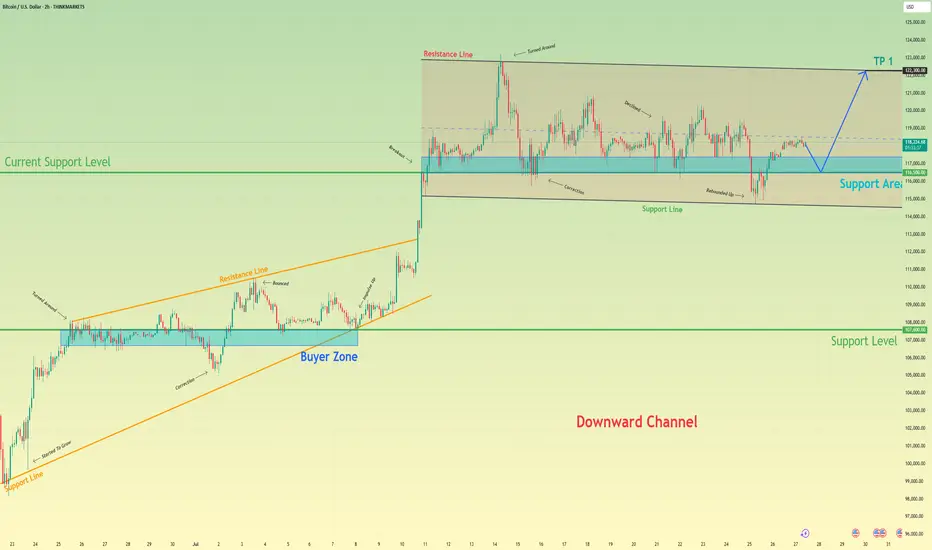
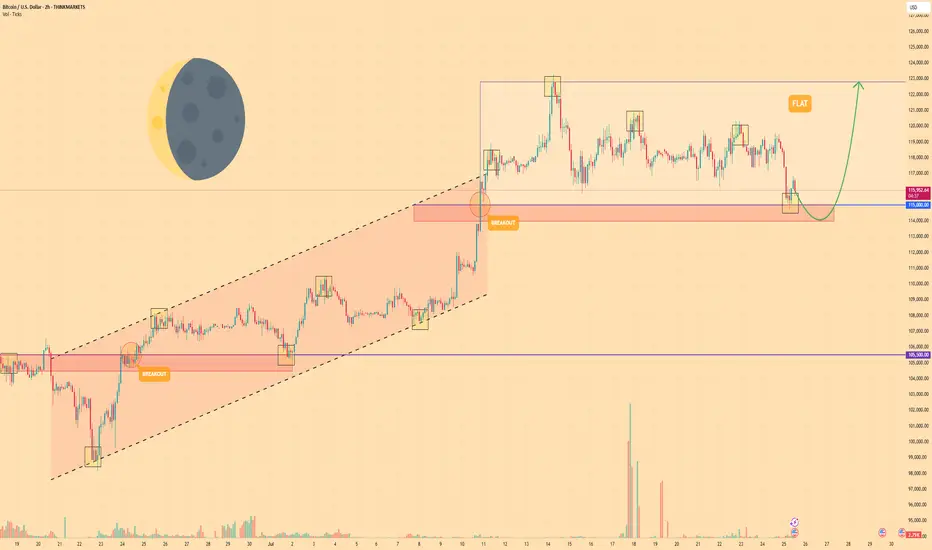
Bitcoin will rebound up from support area to resistance lineHello traders, I want share with you my opinion about Bitcoin. After a strong upward trend that originated from the buyer zone and evolved through an upward wedge, bitcoin executed a decisive breakout, shifting the market into a new, higher-value market phase. This powerful move has since led to an extended period of wide consolidation within a well-defined horizontal channel, a classic sign of the market pausing to absorb the prior impulse and build cause for its next major leg. Currently, the asset's price action is rotating within this structure, defined by a key support area around 116500 and an upper resistance line. Having been rejected from the top, the price is now completing another downward correction and is approaching the channel's foundational support for a crucial test. The primary working hypothesis is a long scenario, predicated on the proven resilience of this support level. A confirmed upward rebound from this 116500 zone would signal that the accumulation within the channel is continuing and likely to resolve upwards. Therefore, the tp is logically and strategically placed at 122300, as this level not only coincides perfectly with the channel's upper resistance line but also represents the completion of the internal rotation, setting the stage for a potential continuation of the larger uptrend. Please share this idea with your friends and click Boost 🚀
Disclaimer: As part of ThinkMarkets’ Influencer Program, I am sponsored to share and publish their charts in my analysis.
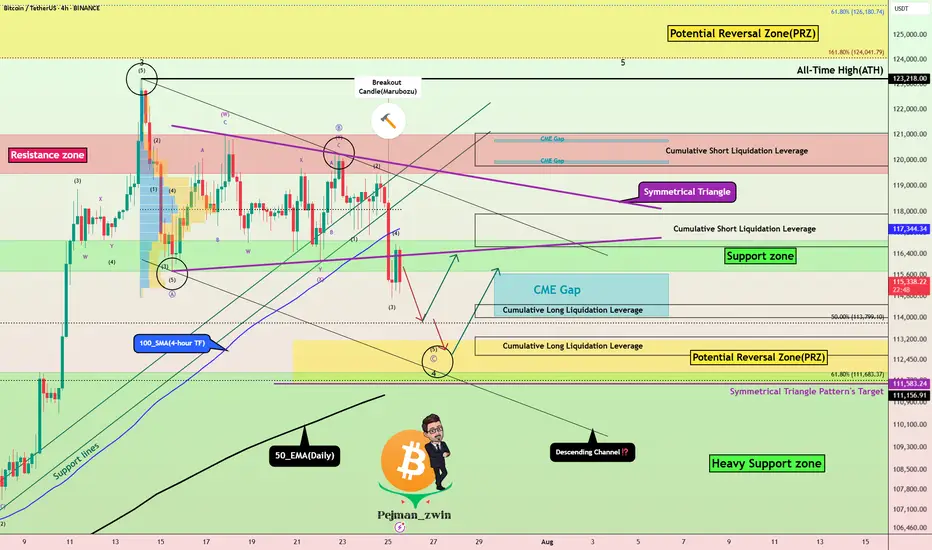
Bitcoin Correction Maturing – Long Setup Brewing!Bitcoin ( BINANCE:BTCUSDT ) has fallen by more than -4% over the past day.
Let's take a look at the reasons for the decline.
One of the key reasons behind Bitcoin’s decline in the past 24 hours ( July 25 ) could be the reduced likelihood of Jerome Powell being replaced as Chair of the Federal Reserve.
In recent days, market participants were speculating that Donald Trump might replace Powell — a scenario that was considered bullish for risk assets like Bitcoin. However, recent reports of a meeting between Trump and Powell, and signs that Powell might not be dismissed, have weakened this fundamental narrative.
This meeting may signal a truce or reduced tension between Trump’s team and Powell , which could imply a continuation of current Fed policies. That’s bad news for Bitcoin, as it removes a potential psychological tailwind from the market and dampens speculative sentiment.
As a result:
Over $500 million in liquidations(Long Positions) occurred
Weak inflows into Bitcoin ETFs
A stronger U.S. Dollar Index ( TVC:DXY )
And declining Gold( OANDA:XAUUSD ) prices over the past two days
all added additional selling pressure on BTC. Now let's take a look at Bitcoin's conditions on the 4-hour time frame .
Bitcoin currently appears to have broken the Support zone($116,900-$115,730) , Support lines , 100_SMA(4-hour TF) , and the lower line of the Symmetrical Triangle Pattern with a bearish Marubozu candle .
Note : In general, trading was difficult when Bitcoin was inside a symmetrical triangle (about 10 days).
It also seems that the pullback to these zones has ended and Bitcoin is waiting for the next decline .
In terms of Elliott Wave theory , Bitcoin appears to be completing microwave 5 of microwave C of major wave 4 . There is a possibility that main wave 4 will create a descending channel and complete at the bottom of the descending channel (at Potential Reversal Zone(PRZ) ).
I expect Bitcoin to start rising again after completing the CME Gap($115,060-$114,947) from Cumulative Long Liquidation Leverage($114,480-$114,000) or Cumulative Long Liquidation Leverage($113,284-$112,603) near the PRZ and Heavy Support zone($111,980-$105,820) .
Cumulative Short Liquidation Leverage: $117,904-$116,665
Cumulative Short Liquidation Leverage: $121,046-$119,761
Do you think Bitcoin has entered a major correction, or does it still have a chance to create a new ATH?
Please respect each other's ideas and express them politely if you agree or disagree.
Bitcoin Analyze (BTCUSDT), 4-hour time frame.
Be sure to follow the updated ideas.
Do not forget to put a Stop loss for your positions (For every position you want to open).
Please follow your strategy and updates; this is just my Idea, and I will gladly see your ideas in this post.
Please do not forget the ✅' like '✅ button 🙏😊 & Share it with your friends; thanks, and Trade safe.
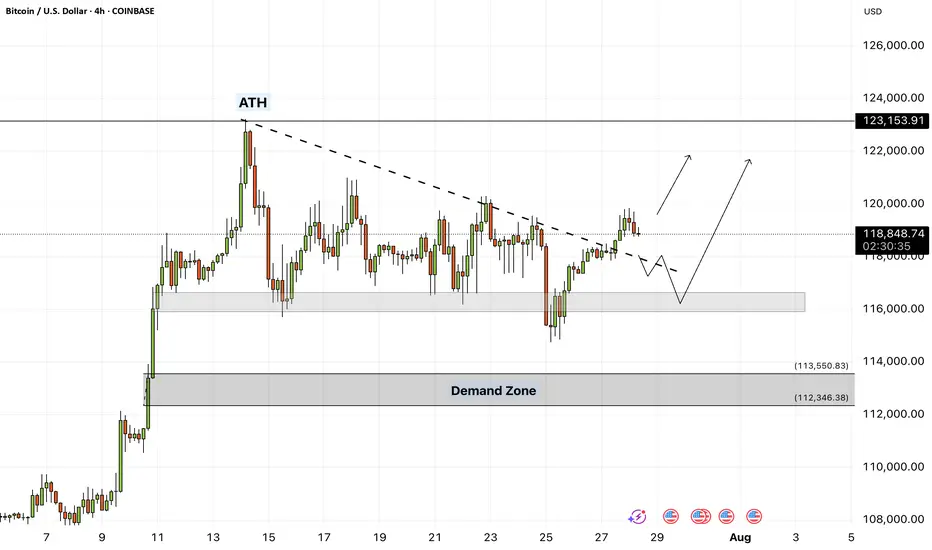
BITCOIN - Price can correct to support area and then start riseHi guys, this is my overview for BTCUSD, feel free to check it and write your feedback in comments👊
For a significant period, the price of Bitcoin was trading upwards within the confines of a rising channel.
Strong buying pressure led to a breakout above the channel's upper boundary, signaling an acceleration of the uptrend.
After this breakout, the upward momentum stalled, and the price entered a new phase of horizontal consolidation, forming a wide flat range.
The price recently tested the upper resistance of this range near $122800 and was rejected.
As a result, the asset is currently in a corrective move downwards, approaching the key support area located between $114000 and $115000
I expect that the price will find support at the bottom of this flat range, reverse its course, and begin a new rally back towards the top of the range at $122800
If this post is useful to you, you can support me with like/boost and advice in comments❤️
Disclaimer: As part of ThinkMarkets’ Influencer Program, I am sponsored to share and publish their charts in my analysis.
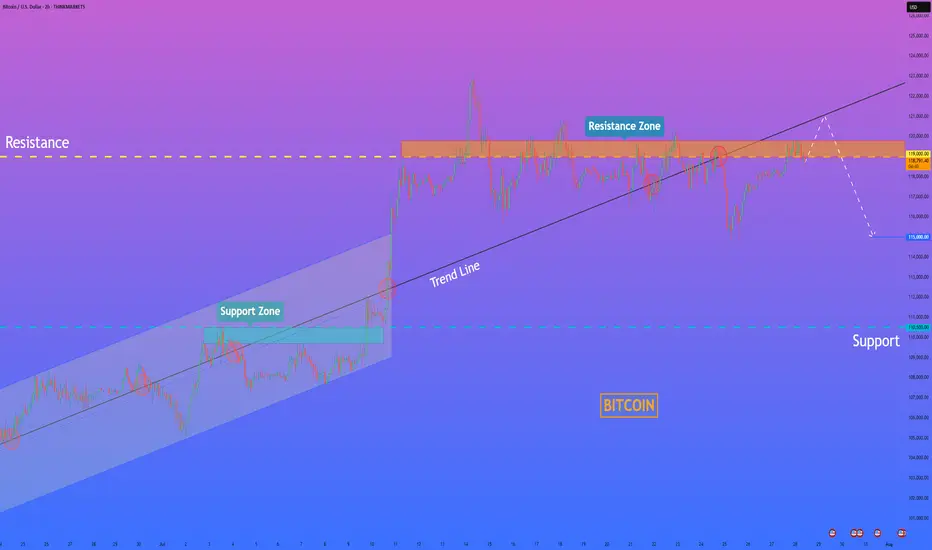
HelenP. I Bitcoin will rise to trend line and then dropHi folks today I'm prepared for you Bitcoin analytics. If we look at the Bitcoin chart, a significant structural change has recently taken place, with the price decisively breaking below the major ascending trend line that had defined the long-term uptrend. This breakdown is a strong signal that the market character has shifted from bullish to bearish, with sellers now in control. The price is currently consolidating below this broken structure, and I believe the former support levels, including the trend line and the horizontal resistance zone at 119000 - 119800, will now act as a formidable confluence of resistance. My analysis for a short position is based on the classic break-and-retest principle. I expect the price can rise to the trend line and then drop. A strong and clear rejection from this area would serve as the primary confirmation that the breakdown is valid and that the path of least resistance is now to the downside. Therefore, I have set the goal for this developing downward move at the 115000 level. If you like my analytics you may support me with your like/comment ❤️
Disclaimer: As part of ThinkMarkets’ Influencer Program, I am sponsored to share and publish their charts in my analysis.
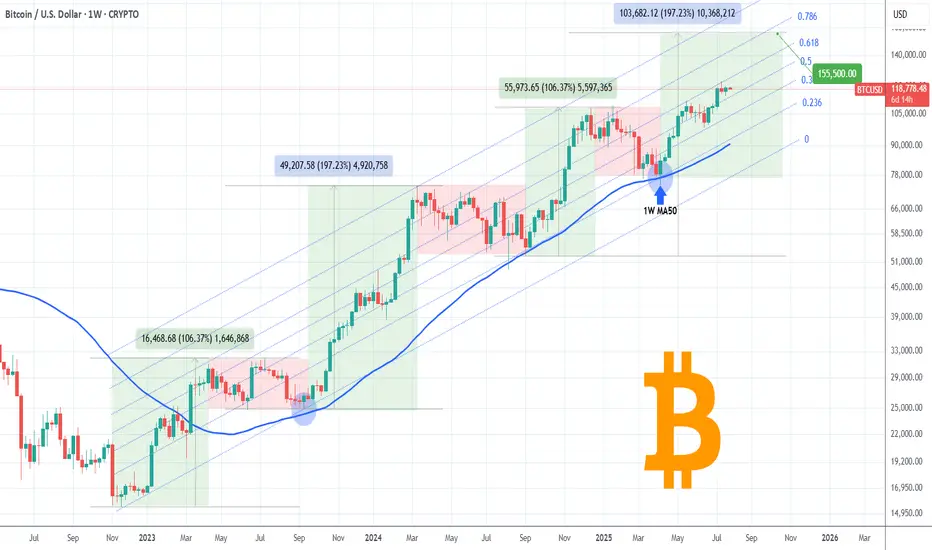
BITCOIN One last rally left in the tank?Bitcoin (BTCUSD) has been on a non-stop rally following the April 07 2025 rebound on its 1W MA50 (blue trend-line). Being inside a 3-year Channel Up since the November 2022 market bottom, that was the second time it rebounded on the 0.236 Channel Fibonacci level.
The previous one was during the last Bullish Leg, which was a +106.37% rise, absolutely symmetrical with the Channel's first such Leg in late 2022 - most of 2023.
If the September 2024 (Higher Low) on the 1W MA50 was the start however of a greater expansion Leg similar to late 2023 - early 2024, which delivered a +197.23% rise, we can claim that by October we may see it peaking at around $155500.
That seems to agree with the majority of Cycle Top models we have come up after many analyses. Do you think that will be the case? Feel free to let us know in the comments section below!
-------------------------------------------------------------------------------
** Please LIKE 👍, FOLLOW ✅, SHARE 🙌 and COMMENT ✍ if you enjoy this idea! Also share your ideas and charts in the comments section below! This is best way to keep it relevant, support us, keep the content here free and allow the idea to reach as many people as possible. **
-------------------------------------------------------------------------------
💸💸💸💸💸💸
👇 👇 👇 👇 👇 👇
Bitcoin - Will Bitcoin continue its upward trend?!Bitcoin is above the EMA50 and EMA200 on the four-hour timeframe and is in its medium-term ascending channel. Bitcoin’s current upward momentum has the potential to reach its previous ATH. If it corrects, you can look for Bitcoin buying opportunities from the identified support area, which is also at the intersection of the bottom of the ascending channel.
If this support is lost, the decline will continue to around $113,000, where you can again buy Bitcoin with a better risk-reward ratio.
It should be noted that there is a possibility of heavy fluctuations and shadows due to the movement of whales in the market, and capital management will be more important in the cryptocurrency market. If the downward trend continues, we can buy within the demand range.
Last week, a group of U.S. senators released an initial draft of a new legislative proposal aimed at creating a clearer regulatory framework for the digital asset industry in the United States. The proposal builds on the recently passed CLARITY Act in the House of Representatives and focuses on strengthening market structure, enhancing consumer protection, and expanding regulatory oversight.
According to the senators, the bill addresses key areas such as banking, disclosure requirements, securities classification, and measures to combat illicit financial activity.Senator Lummis, in highlighting the proposal, stressed the urgent need for legal clarity to support the growth of this emerging industry within the U.S. The legislation aims to facilitate the integration of digital assets into banking services and would allow financial holding companies to provide services based on such assets.
The draft also includes measures aimed at preventing illegal financial activities, such as improving regulatory standards and boosting inter-agency cooperation to identify and block misuse of digital assets.
In addition, the senators have issued a “Request for Information” (RFI) to support the legislative process and have invited the public to share their opinions on more than 35 related topics, encouraging broader engagement in shaping the bill.
Meanwhile, in Asia, Japan-based firm Metaplanet announced that it has added 780 BTC worth $93 million to its digital holdings. This acquisition brings the company’s total Bitcoin reserves to 17,132 BTC, valued at roughly $2 billion. Metaplanet is fast becoming one of the largest institutional Bitcoin treasuries in the region—potentially serving as a model for other firms across Asia.
At the same time, publicly traded U.S. companies have significantly ramped up their Bitcoin holdings. By the end of Q2 2025, these companies had accumulated nearly 900,000 BTC, marking a 35% increase over the previous quarter. This surge, driven primarily by firms such as MicroStrategy, has sent demand for Bitcoin soaring.
Some analysts believe that the $1.5 trillion in free cash flow held by companies within the S&P 500 index could spark a new wave of institutional Bitcoin buying.
Looking ahead, the upcoming week is packed with critical U.S. economic data. Alongside the Non-Farm Payroll (NFP) employment report and inflation metrics via the Personal Consumption Expenditures (PCE) index, the initial estimate for Gross Domestic Product (GDP) and various other indicators will be released—potentially offering a clearer picture of where the U.S. economy is heading.
The Federal Reserve remains primarily focused on inflation and labor market dynamics. June CPI data indicated signs of inflationary pressure caused by tariffs. If Thursday’s PCE report—particularly its core reading—confirms a similar trend, the Fed may decide against a rate cut in September. As a result, financial markets have priced in only about a 65% chance of a rate cut at that meeting.
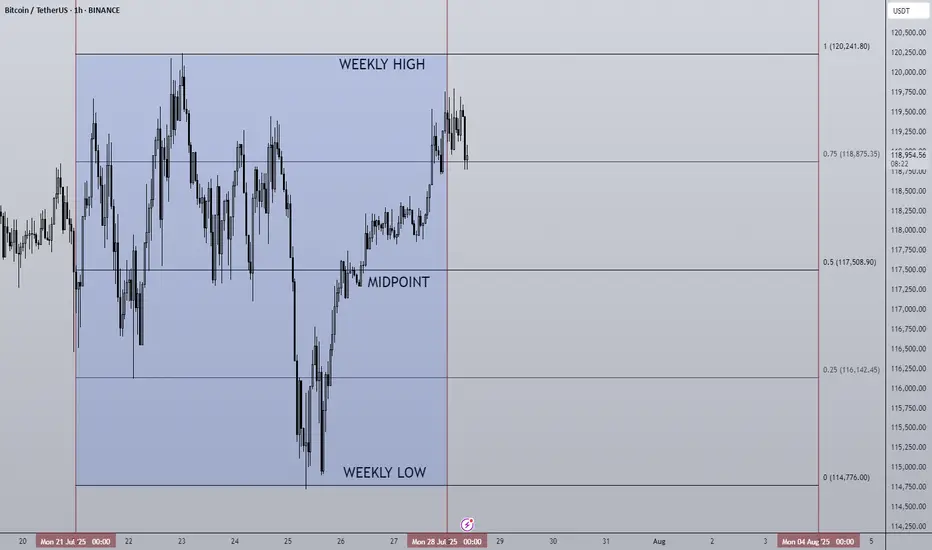
28/07/25 Weekly OutlookLast weeks high: $120,241.80
Last weeks low: $114,776.00
Midpoint: $117,508.90
As we approach the end of the month BTC continues to trade sideways during a cooling off period as altcoins finally take the stage. Last week Bitcoin saw a relatively flat net inflow via ETFs of $72m, ETH on the other hand posted the second largest net inflow week ever at $1.85B! The concentration has certainly shifted...
This IMO is still a very bullish structure for BTC, very shallow pullbacks being bought up/absorbed by still happy to purchase at these levels. As long as this continues altcoins have a strong base to continue growing on, if BTC breaks structure and price accepts below ~$110,000 then the altcoin rally will be over for now I believe.
This week some major altcoins are set to reach HTF resistance areas, ETH has already tagged $4,000 which looks to be a battleground level of major importance.
TOTAL2 which is the combined market cap of all altcoins is currently ~8% from the highs, keeping this in mind for where altcoins may run out of steam...
Good luck this week everybody!
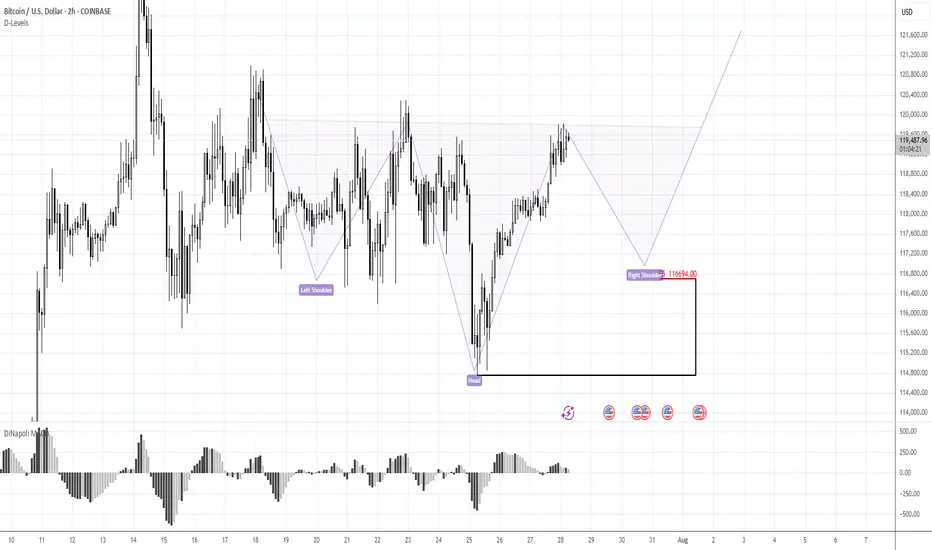
BTC 116.70K stands in focusMorning folks,
Once we've prepared the analysis, we've got upsetting squeeze down, thanks to Galaxy massive sell-off. I don't know what they were trying to do - either hunted for stops under 116K, or just sold in most unwelcome moment... but unfortunately such an issues are out of our control.
For now - BTC totally reversed this sell-off and once again shows positive sentiment. Now we consider same reverse H&S pattern, but this time of a bigger scale. 116.70K support area, where, the right arm should be formed now stands in our focus for long entry. We consider no shorts by far. Hopefully no more tricks will follow from old Donny or somebody else...
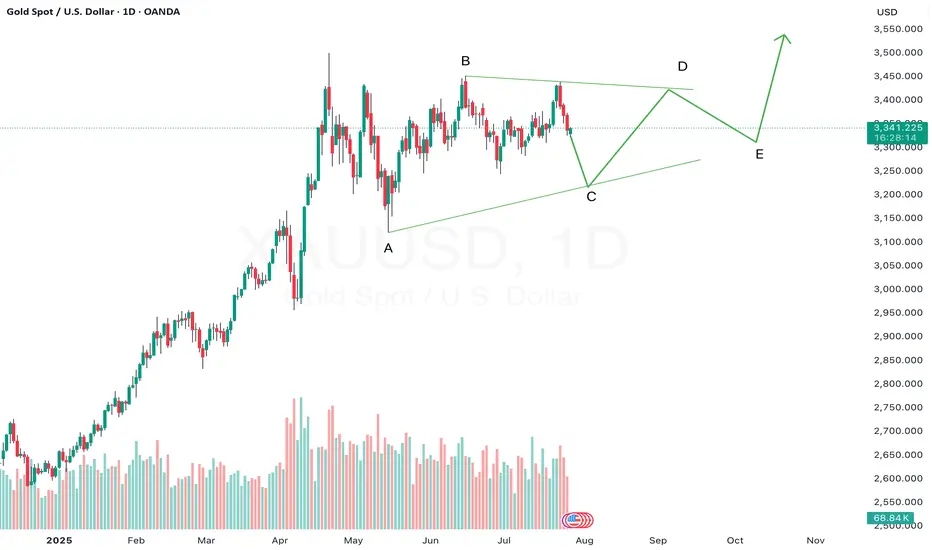
Gold may still be unfolding Wave C of a triangle — don’t rushGold appears to be forming a contracting triangle pattern, and we could currently be in the midst of Wave C. In a triangle structure (A-B-C-D-E), Wave C typically unfolds as a corrective move and is often mistaken for a potential breakout phase.
However, triangles are continuation patterns, and premature entries can lead to whipsaws or false breakouts. If Gold is indeed still in Wave C, we can expect further choppy, sideways movement before the pattern completes with Waves D and E.
Patience is key — let the structure mature. A more reliable opportunity may emerge after the triangle resolves and the larger trend resumes.
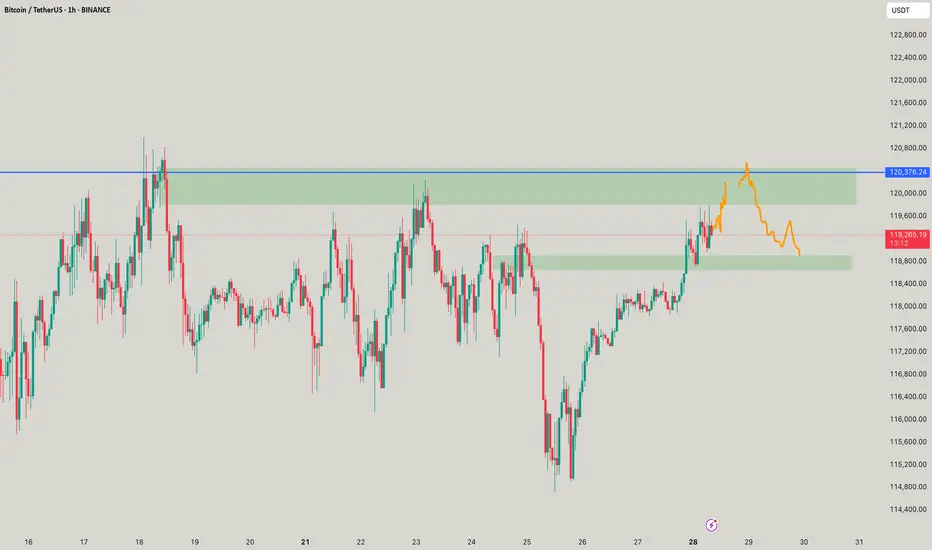
BTC - When 130k?This is BTC, As mentioned, has hit 119,540 and above, will make moves like this till 120,376 to max 120,578 and there if it breaks 120,578 in 1H and close above, then we see good move or we see a fountain which I call as waterfall.
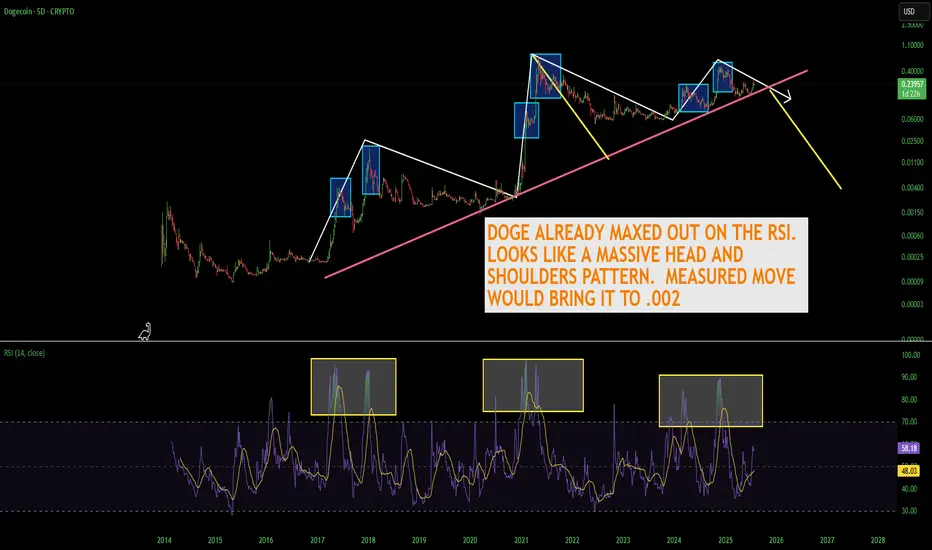
THE TRUTH ABOUT DOGECOINDogecoin is looking really toppy. As you can see the RSI has peaked out early before a new high which is alarming. I think Doge is in serious trouble here as the meme craze starts to shift into newer memes. If the head and shoulders pattern plays out you're looking at a catastrophic drop down to 2 tenths of a penny. Doge is EXTREMELY overvalued and needs to come back down to earth. Don't forget there is close to 15 million Doge mined per day forever. It appears with the way the RSI peaked and price didn't break the high that Doge has reached a plateau in price even if the market cap continues to go up.
Not financial advice just my opinion.