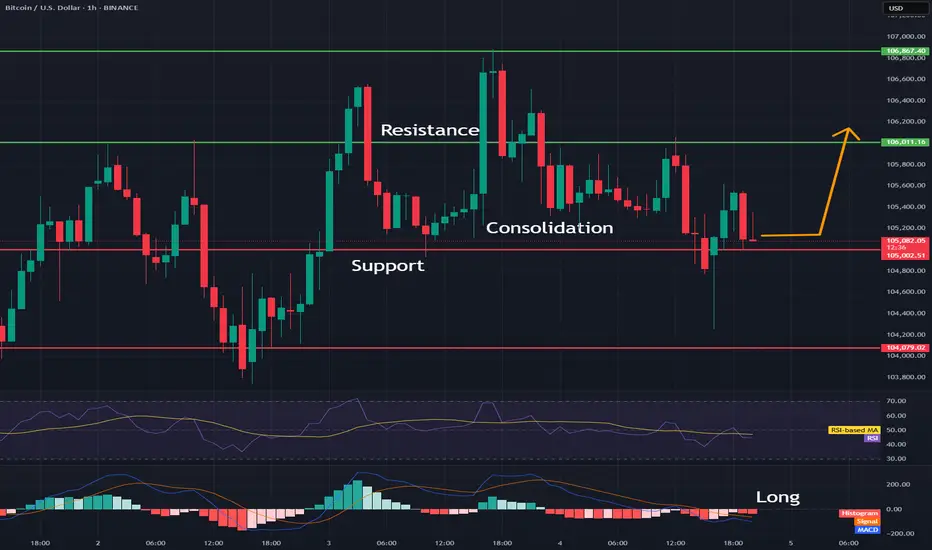
BTC/USD 1H Short-Term🔍1. General Context and Short-Term Trend
Short-Term Trend: The last dozen or so candles have shown strong fluctuations — a typical sideways market (consolidation) after a clear upward impulse and a quick drop. The price is currently trading in the range of around $104,900–$106,500.
Recent Strong Move: Clear upward impulse from around $104,900 to around $106,900, followed by a quick correction.
📌2. Supports and Resistances (H1)
Supports:
$105,000–$105,200 — Bottom of local wicks and several demand tests.
$104,900 — Lowest point of the last few hours, clear buyer reaction.
Resistances:
$106,200–$106,400 — Upper area of several candles, strong price rejection.
106,900–107,000 USD – The peak of the last impulse, a place of clear supply.
✅3. Candlestick formations and price action
Pin bar / long wick: Candles with long lower wicks are visible around 105,000 USD, which suggests that buyers are defending support.
Double top? (Double top): Peaks around 106,900 USD (03.06 and 04.06) – a classic signal of a potential change in direction to the lower.
Possible consolidation: The last few hours have been a series of alternating candles, signaling the lack of a clear advantage of bulls or bears.
🧠4. Technical indicators (MACD and RSI)
MACD (lower panel)
The MACD line crossed the signal line from the bottom to the top, then a quick correction and currently the MACD is close to zero – no clear trend, momentum has slowed down.
MACD Histogram: Declining, close to zero, suggesting potential lack of strong trend and possibility of further consolidation.
RSI (middle panel)
RSI value ~44–48 – not overbought or oversold, neutral market state.
No divergence – RSI generally follows price, no strong divergences are visible.
RSI bounced off 30 (tested oversold zone and returned to neutral range).
🧠5. What could be important?
Volatility Squeeze: Low volatility after a sharp move often heralds another impulse.
Potential Fakeout: If support at $104,900 is broken falsely (e.g. quick wick and return), a move up could occur.
No clear trend on the hourly chart, rather sideways market in the short term.
📊Summary and scenarios
Scenario 1 (bullish):
If the $105,000-$104,900 level holds, we can expect a test of $106,200-$106,400 and perhaps another attempt to approach $107,000.
Scenario 2 (bearish):
If the $104,900 support is broken (with a candle closed below this level), the next target is around $104,500 and below.
What to watch out for?
Timing of macro data releases - may increase volatility.
Sudden breakouts from consolidation - no trend = higher risk of sudden, false moves.
BTC
This Trendline Refuses To Be OverlookedTrading Fam,
While it is somewhat unclear what Bitcoin's next move will be (though I tend to lean towards more upside bias), one thing has become clear ...that aqua blue trendline I have drawn on our chart is proving its significance. Currently, it holds as support. A break to the downside though, and I expect us to drop all the way to 96k. If it continues to hold, a break above our recent high should be expected and new highs will be formed in a relatively quick timeframe.
Stew

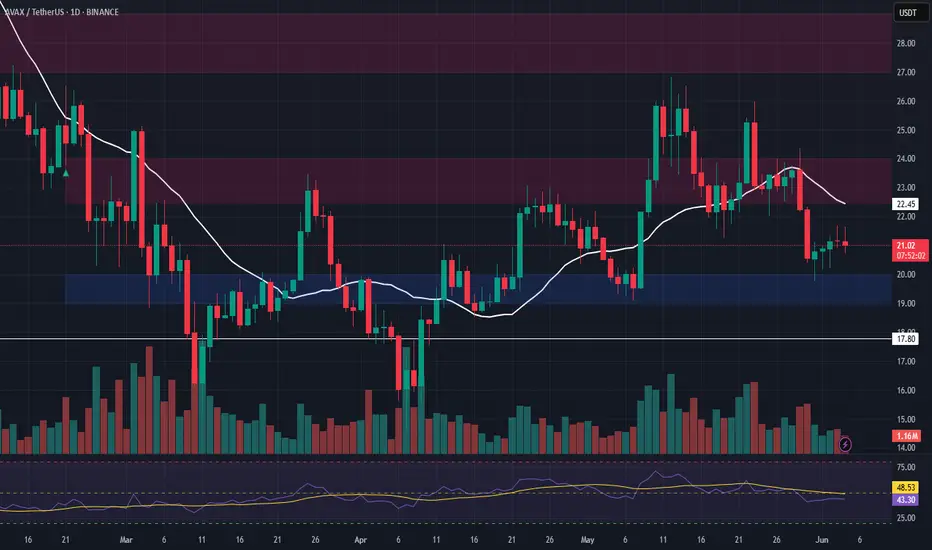
AVAX Long Swing Setup – Retrace to Major Support in PlayAVAX is undergoing a healthy correction, setting up a potential swing opportunity as it approaches the $19.00–$20.00 support zone. This level has held as a key pivot in the past, and we’re now watching for bullish confirmation to enter long.
📌 Trade Setup:
• Entry Zone: $19.00 – $20.00
• Take Profit Targets:
o 🥇 $22.50 – $24.00
o 🥈 $27.00 – $29.00
• Stop Loss: Daily close below $17.80
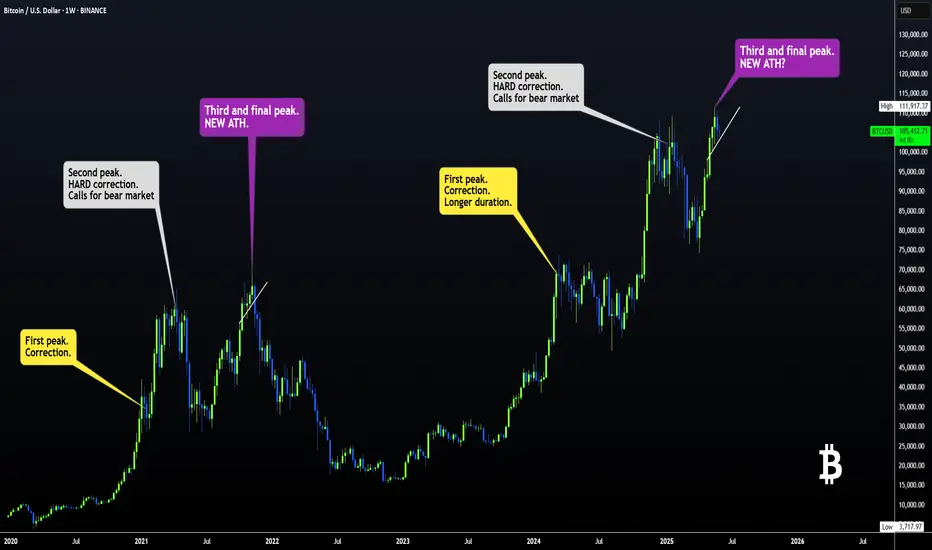
BTC FRACTAL : Has BTC been following THIS EXACT PATTERN?The only difference in terms of the first peak, is the duration. But even the pullback size has been similar:
Interestingly, in terms of the second peak, the increase from the corrective bottom to the new ATH is almost exact at 122%:
Here's why we MAY still have a small push upward:
- The previous time, the peak was at least 6% higher. Currently, that would put us around 116K.
- The current pennant pattern is different from the previous bearish flag.
2%:
Pattern:
Do you think the bearish cycle is starting, or is another push up likely?
___________________
BINANCE:BTCUSD
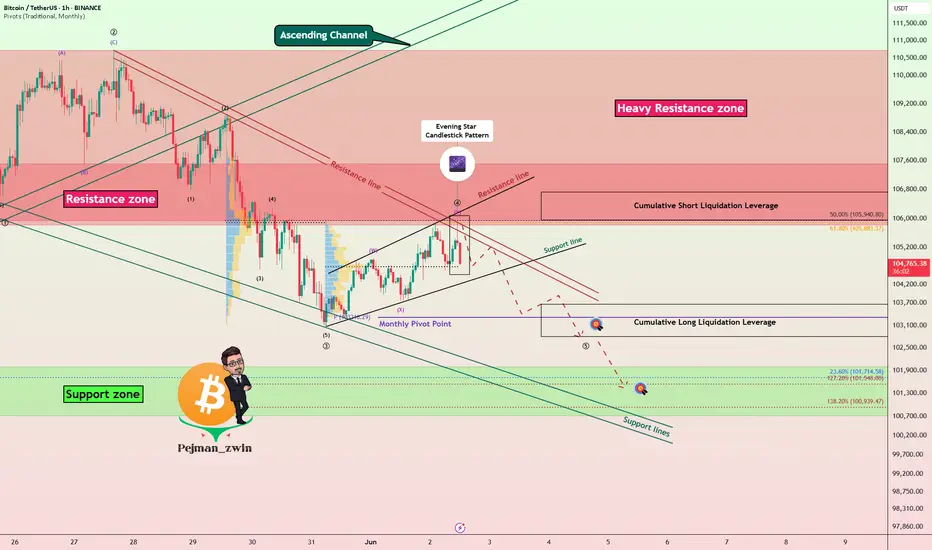
Bitcoin’s Rally Fades Below Resistances — Bearish Wave Setup!Bitcoin ( BINANCE:BTCUSDT ) started to fall as I expected in the previous idea , but failed to break the Heavy Resistance zone($110,000-$105,820) .
Bitcoin is trading near the Resistance zone($107,520-$105,940) , Cumulative Short Liquidation Leverage($106,720-$105,948) , and the Resistance lines .
From the perspective of Elliott Wave theory , Bitcoin appears to have completed a main wave 4 near the Resistance lines. The structure of the main wave 4 was a Double Three Correction(WXY) . One of the signs of the completion of the main wave 4 could be the Evening Star Candlestick Pattern .
I expect Bitcoin to decline to at least Cumulative Long Liquidation Leverage($103,666-$102,800) AFTER breaking the Support line , and the next target is the Support zone($102,000-$107,120) .
Note: Rising tensions between Russia and Ukraine could help drive down Bitcoin.
Note: If Bitcoin touches $107,600, we can expect more pumps.
Please respect each other's ideas and express them politely if you agree or disagree.
Bitcoin Analyze (BTCUSDT), 1-hour time frame.
Be sure to follow the updated ideas.
Do not forget to put a Stop loss for your positions (For every position you want to open).
Please follow your strategy and updates; this is just my Idea, and I will gladly see your ideas in this post.
Please do not forget the ✅' like '✅ button 🙏😊 & Share it with your friends; thanks, and Trade safe.
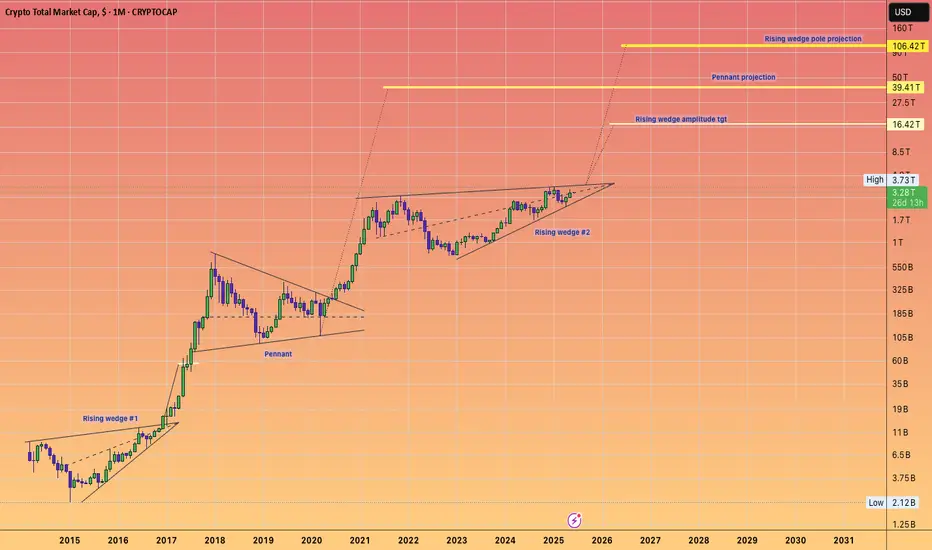
Raoul Pal's Big Banana. $100 Trillion dollars Crypto market.And how on earth do we reach that point?
Is Raoul's thesis regarding the exponential age accurate, suggesting we have until 2030 to invest and reap the benefits; so "don't F@ck this up!"
As a charting enthusiast, I am eager to see if there exists a technical foundation that could allow us to teleport to those levels and estimate how many years it might take.
Let's examine the entire crypto market, which includes everything from stable coins to tangible real world assets like Gold.
We can distinctly identify three significant consolidation patterns.
Rising wedge #1
a sideways pennant
rising pennant #2
Now, considering this is a logarithmic chart.
It provides us with logarithmic amplitudes and projections.
An amplitude is a calculated move based on the boundaries of the consolidation pattern.
Essentially, it involves taking the top and bottom width and applying it to the breakout point for a rising pattern.
In a #HVF, we utilise the midline of the funnel to forecast targets.
The projections illustrated on this chart pertain to the sideways pennant, employing the flagpole to establish our target.
It is this sideways pennant pole projection that leads us to 100 trillion dollars and beyond. Test it out for yourself if you find it hard to believe these figures could become a reality :)
So there we have it; yes, 100 trillion dollars may appear excessively optimistic and fantastical, especially since we are currently at 3.28 trillion dollars.
However, the charts indicate that Crypto could indeed be the sector where the majority of financial transactions take place in the forthcoming exponential future.
AUDCHF BULLISH OR BEARISH DETAILED ANALYSISAUDCHF is currently breaking out of a textbook falling wedge pattern on the 4H chart, signaling a potential shift in momentum from bearish to bullish. Price action has been consolidating within this structure for several weeks, creating lower highs and lower lows, but with clear bullish divergence beginning to show up in recent sessions. The breakout around the 0.53300 zone marks a significant technical confirmation that bulls are taking control, with eyes now on the 0.54400 target.
From a fundamental standpoint, the Australian dollar is gaining strength backed by hawkish sentiment from the RBA. Despite global uncertainties, the RBA’s firm stance on managing inflation is keeping the Aussie resilient. On the flip side, the Swiss franc has been showing signs of relative weakness due to softer inflation readings and safe-haven outflows as global risk sentiment improves. This macro backdrop is creating favorable conditions for AUDCHF to rally.
Technically, this breakout aligns with strong market structure and volume support, making this a high-conviction bullish setup. The breakout candle is closing above resistance with momentum, and as long as price holds above the 0.53250–0.53000 zone, bulls are likely to maintain control. With the falling wedge breakout and favorable risk-reward setup, the upside move toward 0.54400 looks increasingly probable.
This is a clean price action play with fundamental alignment. The breakout not only confirms the end of the previous downtrend, but also opens up space for a bullish wave to unfold. Momentum traders and swing traders will want to watch this closely as AUDCHF transitions from accumulation to a potential bullish expansion phase.

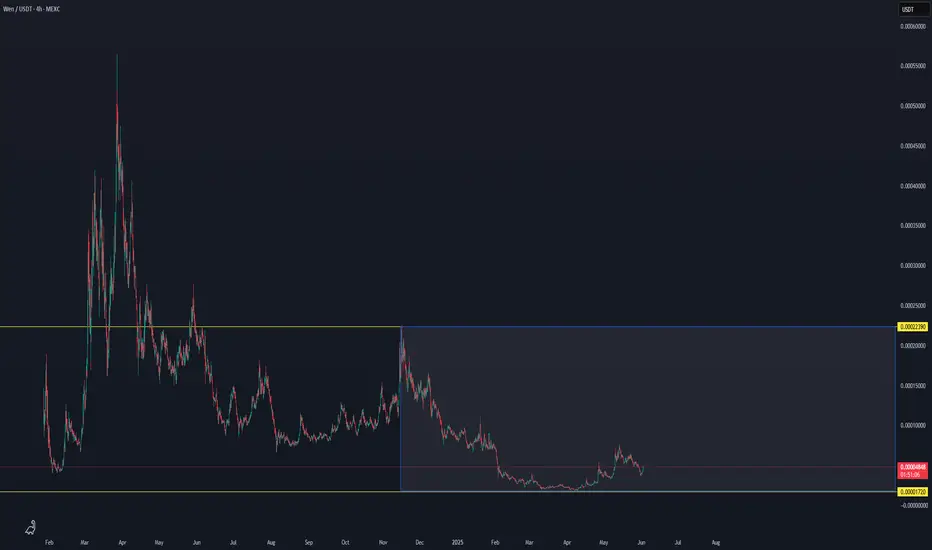
WEN INTO IMPORTANT ZONE FOR INCREASEWEN INTO IMPORTANT ZONE FOR INCREASE
There is some daily volume interest which can confirm with the coming time frame for na ew increase
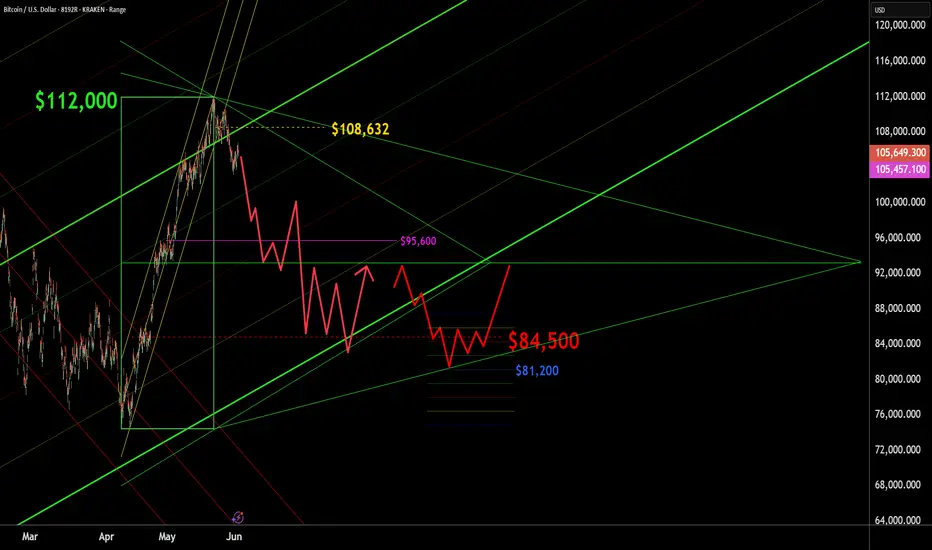
BTC - UPDATE - $84,500 target BTC appears to reluctantly be topping, with a while probability of having already topped at $112,000. My best estimate of the next on boarding price for BTC is in the $84,500 area. Prices above $108,632 indicate I was wrong. Pros could consider shorting to the same number. This is just conversation. And not trading advice. Murrey Math, Elliot Wave , Kumar Wave being employed. See past charts for how we got to here.
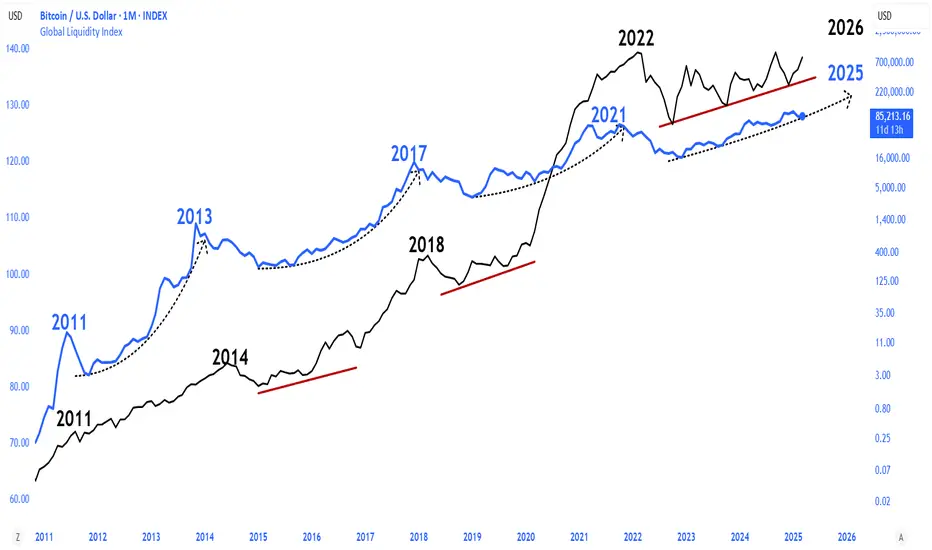
Bitcoin Global m2While the Global Liquidity Index is on the verge of a parabolic run like the 2011\2013 2016\2017 and 2020\2021 processes, a bear season for #Bitcoin cannot be mentioned
BTC Bitcoin Warning: No Clear Setup — Don’t Get Trapped!🚨 BTC Market Outlook: Analysis & Key Warning for Traders 🧠💡
Currently keeping a close eye on Bitcoin (BTC) 🔍. Previously, we saw strong bullish momentum propelling price upward 📈. However, that momentum is now under pressure — especially when you zoom into the 4-hour timeframe. We've seen a clear break in market structure, with lower highs and lower lows forming 🔻.
Right now, there’s no clean trade setup on the table. Price has pulled back, and we’re at a key inflection point — either we see a bullish breakout, or further downside could unfold 📉.
This video is more of a technical warning ⚠️ for traders feeling the urge to jump in early. The current structure is risky, and taking impulsive trades here could do more harm than good.
In the video, I also cover how to identify the highest-probability setups — particularly when price consolidates in a range and then breaks out in the direction of the prevailing trend. These continuation setups offer far better odds than guessing mid-range.
📌 Be patient. Let the setup come to you. Don’t force trades when conditions are unclear.
💬 If you’ve watched the analysis or have thoughts on BTC’s next move, comment below — I’d love to hear your view.
❗️Disclaimer: This is not financial advice. Everything shared is for educational purposes only. Always do your own analysis and trade responsibly. Risk management is key.

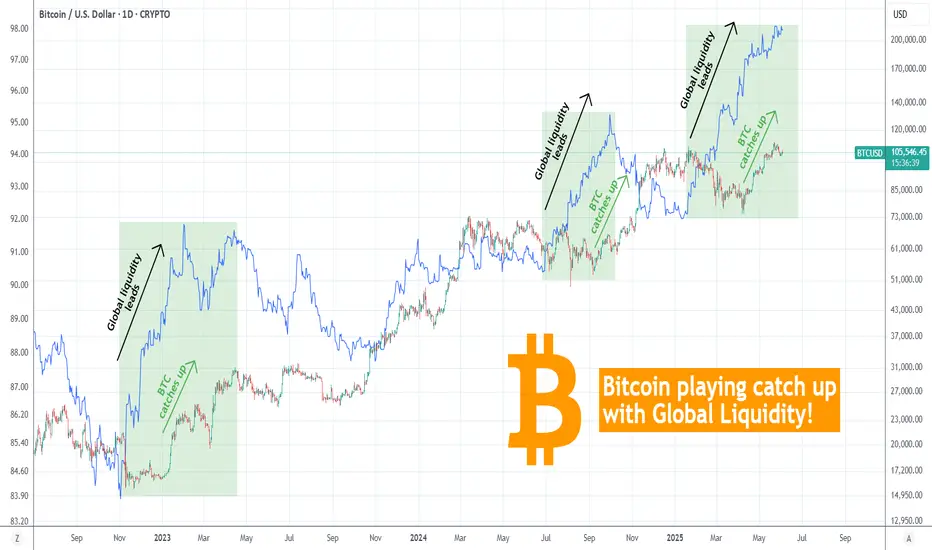
BITCOIN Will it catch up to the rising Global Liquidity again?Bitcoin (BTCUSD) is attempting to stage yet another short-term rally on its Tariff War recovery Bullish Leg but the picture is even more interesting on the long-term.
This is a simple yet very powerful and explanatory chart where it shows that every time the Global Liquidity (blue trend-line) led the uptrend and started rising before BTC on this Bull Cycle (since the November 2022 bottom), BTC eventually caught up to the trend and closed the Gap.
This time Global Liquidity has been rising since the start of the year (early January) while Bitcoin only started to do so since April 07. Even if the Global Liquidity pauses here, Bitcoin still has the potential to continue rising irrespectively.
How high do you think this can go? Feel free to let us know in the comments section below!
-------------------------------------------------------------------------------
** Please LIKE 👍, FOLLOW ✅, SHARE 🙌 and COMMENT ✍ if you enjoy this idea! Also share your ideas and charts in the comments section below! This is best way to keep it relevant, support us, keep the content here free and allow the idea to reach as many people as possible. **
-------------------------------------------------------------------------------
💸💸💸💸💸💸
👇 👇 👇 👇 👇 👇
Technical Analysis – HBAR/USDT + TRADE PLANTechnical Analysis – HBAR/USDT (Daily Chart as of June 4, 2025)
Chart Pattern: Falling Wedge (Bullish)
The chart indicates a classic falling wedge pattern, often interpreted as a bullish reversal signal.
This pattern is marked by descending converging trendlines, suggesting declining volatility and potential breakout.
Breakout point is illustrated just above the wedge’s resistance line, with a bullish breakout expected.
Key Support & Resistance Levels
Immediate Support Zone: $0.1625 – $0.1723 (blue zone)
Primary Resistance Targets:
Short-term: $0.1849 (top of Bollinger Band)
Mid-term: $0.2070 – $0.2200
Long-term: $0.3400 (strong historical resistance)
Indicators Summary
Bollinger Bands: Price near the lower band, indicating potential upside volatility.
Volume Profile: Slightly increasing near wedge apex, often a precursor to a breakout.
VMC Cipher_B: Multiple green dots signal bullish divergence; momentum may be reversing upward.
RSI (14): Currently recovering from oversold territory (~39.5), suggesting bullish momentum building.
Money Flow Index (ArTy): Moving back into the green, indicating capital inflow and potential accumulation.
Stochastic RSI: Crossed upward from oversold zone (currently ~23), a common signal for trend reversal.
Trading Plan
Long Position Setup (Swing Trade)
Entry Zone:
$0.1650 – $0.1725 (upon retest of breakout from wedge or candle close above wedge resistance)
Stop-Loss:
$0.1580 (below wedge support and key structure low)
Take-Profit Targets:
TP1: $0.1850 (Bollinger Band and resistance zone)
TP2: $0.2070 (resistance from March 2025)
TP3: $0.2200 – $0.2400 (target zone for full wedge breakout)
TP4: $0.3400 (macro-level resistance, if rally continues)
Risk-to-Reward:
Minimum R:R of 1:2.5 to 1:5 depending on TP level.
⚠️ Risk Management & Strategy Notes
Wait for confirmation breakout candle with strong volume above wedge resistance before entering.
Scale in gradually between $0.1650–$0.1725 if confirmed.
Trail stop-loss after reaching TP1 to lock in profits.
Monitor Bitcoin price trend and overall market sentiment—HBAR tends to follow macro market structure.
The combination of the falling wedge, bullish divergence, and oversold momentum indicators supports a strong potential for bullish continuation. However, conservative confirmation is essential before committing capital.
Outlook: Bullish bias, pending confirmation breakout above the wedge resistance.
Bitcoin Brewing - A large move is coming!Bitcoin has been under pressure over the last few trading sessions.
Despite the equity markets going higher this asset is stuck in a holding pattern.
We are currently forming a wedge pattern that has given us a directional bias to trade.
Price action is at a 50/50 in terms of falling lower or rallying higher.
Being the fact that the bulls have been forming higher lows & higher highs, we have to give them due respect.
However understand this BTC is showing some distribution signs and is likely going to have a decent selloff within the next 15-45days. We may have 1 more spike higher but we may not.
1 note of interest is the 7day & 20 day moving average just signaled a bearish crossover which is something you need to monitor closely.
I do think the upside is limited to about 115K if we have 1 more move higher.

Check support near 106775
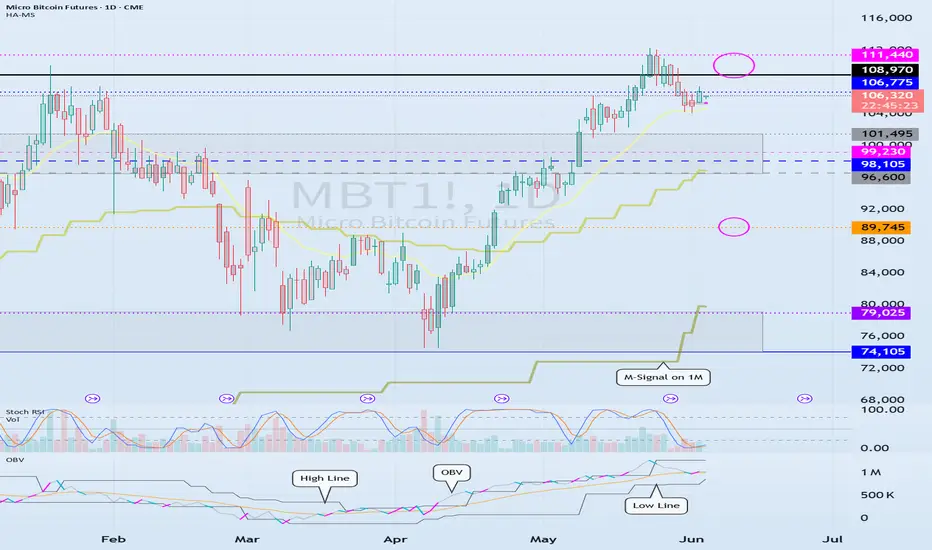
Hello, traders.
If you "Follow", you can always get new information quickly.
Have a nice day today.
-------------------------------------
(MBT1! 1D chart)
The prerequisite for the previous ATH to rise above is that the OBV must rise above the High Line and remain there.
Accordingly, the key is whether it can be supported and rise near 106775.
If it fails to rise, it is likely to fall to the 96600-101495 area.
The 96600-101495 area is an important support and resistance area for continuing the uptrend.
Therefore, if it falls in the 96600-101495 area, it is likely to fall sharply.
If it falls,
1st: Around 89745
2nd: M-Signal indicator on the 1M chart or 74105-79025
You should check for support near the 1st and 2nd areas above.
Therefore, the 96600-101495 area can be seen as an important support and resistance area.
-
(30m chart)
It played the role of support and resistance by touching the area around 105385 several times.
It is expected to determine the trend again when it meets the M-Signal indicator on the 1D chart.
-
Thank you for reading to the end.
I hope you have a successful trade.
--------------------------------------------------
- Here is an explanation of the big picture.
(3-year bull market, 1-year bear market pattern)
I will explain the details again when the bear market starts.
------------------------------------------------------