Bitcoin Near Breakout – CPI Miss Could Be the Catalyst?Just Released: Key U.S. Inflation Data:
Core CPI m/m: 0.1% (vs. 0.3% forecast)
CPI m/m: 0.1% (vs. 0.2% forecast)
CPI y/y: 2.4% (vs. 2.5% forecast)
Market Reaction & Outlook:
The softer-than-expected inflation figures suggest easing price pressures in the U.S. economy — a potential bullish signal for risk assets, such as Bitcoin ( BINANCE:BTCUSDT ).
-----------------------------
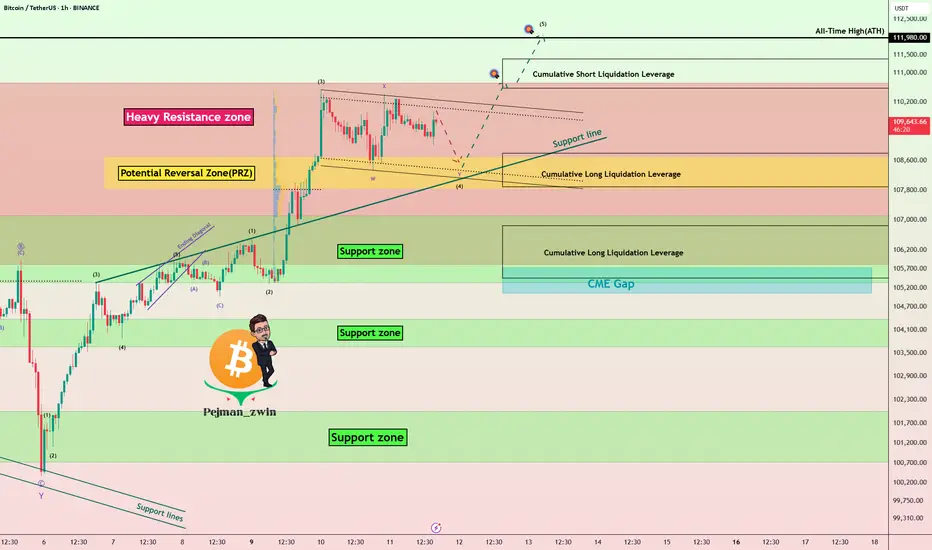
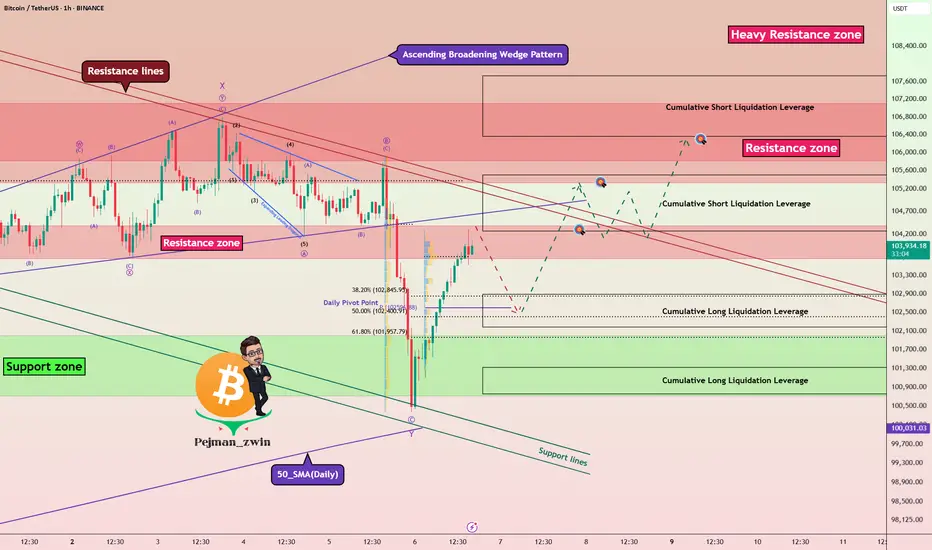
Now let's take a look at the Bitcoin chart on the 1-hour time frame .
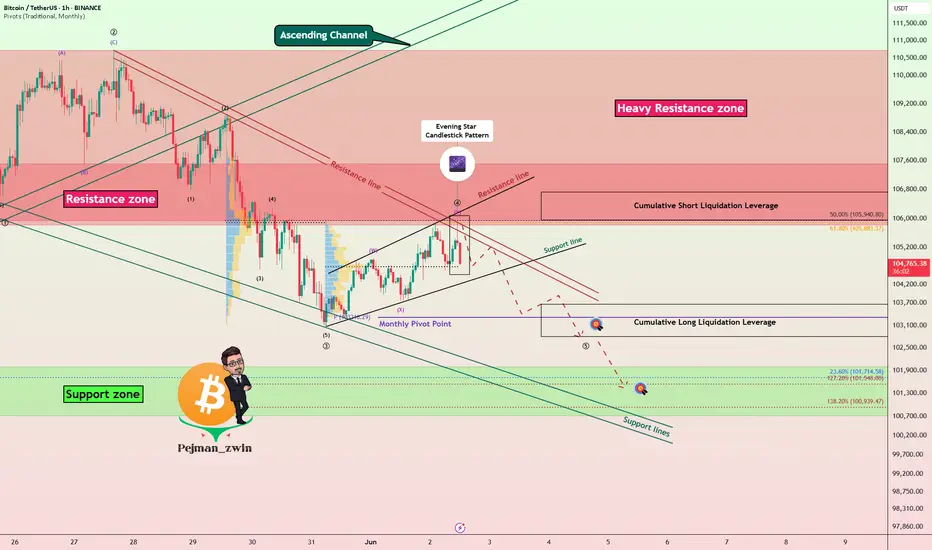
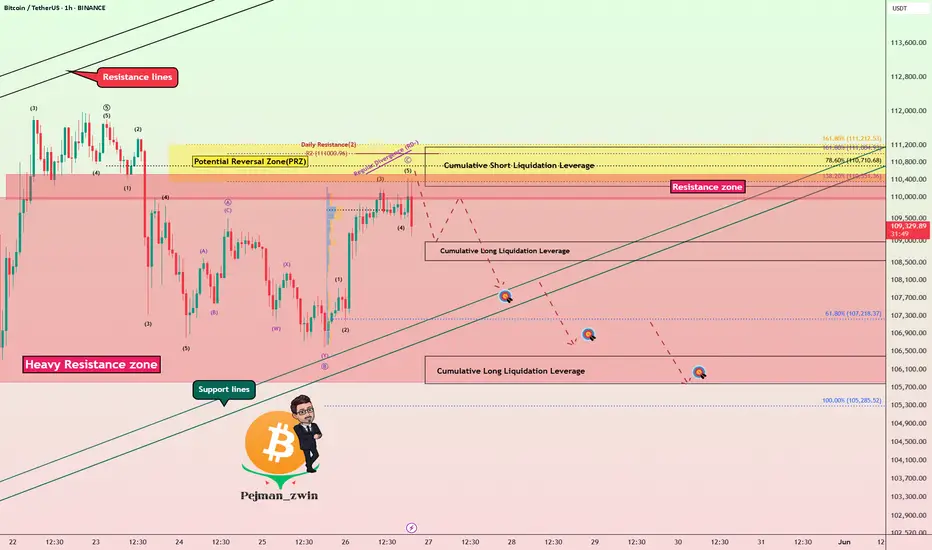
Bitcoin is trading in the upper part of a Heavy Resistance zone($104,380-$103,670) and is trying to break through this zone. The announcement of US indexes could be a trigger for a breakout of this zone .
In terms of Elliott Wave theory , Bitcoin appears to be completing microwave 4 of the main wave 3 . The structure of microwave 4 is a Double Three Correction(WXY) .
I expect Bitcoin to start rising from the Potential Reversal Zone(PRZ) and near the Support line again and rise to at least $110,670 and if the Heavy Resistance zone($104,380-$103,670) is broken we should expect new ATHs in the coming days .
Cumulative Long Liquidation Leverage: $108,791-$107,887
Cumulative Long Liquidation Leverage: $106,840-$105,457
Cumulative Short Liquidation Leverage: $111,381-$110,568
Note: If Bitcoin falls below $105,700(Worst Stop Loss(SL)), we should expect further declines.
If you want to know my weekly analysis about BTC , I suggest you check out the following idea:
Please respect each other's ideas and express them politely if you agree or disagree.
Bitcoin Analyze (BTCUSDT), 1-hour time frame.
Be sure to follow the updated ideas.
Do not forget to put a Stop loss for your positions (For every position you want to open).
Please follow your strategy and updates; this is just my Idea, and I will gladly see your ideas in this post.
Please do not forget the ✅' like '✅ button 🙏😊 & Share it with your friends; thanks, and Trade safe.
Btcanalysis
Will Bitcoin move toward its ATH?This analysis is an update of the analysis you see in the "Related publications" section
In the previous analysis, we mentioned that the red zone marked on the chart could potentially be broken.
From the point where we placed the green arrow on the chart, Bitcoin’s diametric pattern has completed, and it has entered a corrective phase.
It now appears that we are in wave B of a running flat, and wave B could complete around the all-time high or slightly above it.
Let’s see whether this move will play out or not.
For risk management, please don't forget stop loss and capital management
Comment if you have any questions
Thank You
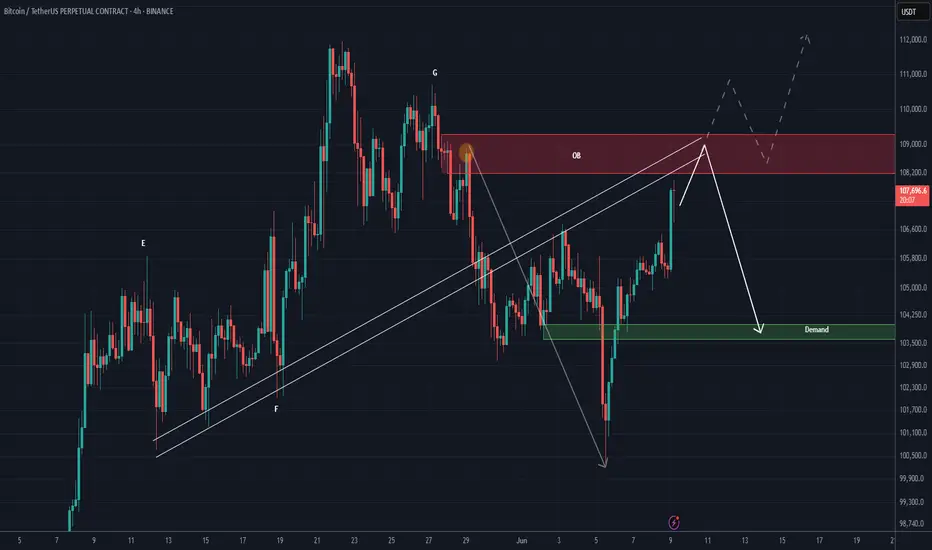
BTC NEW UPDATE (4H)This analysis is an update of the analysis you see in the "Related publications" section
These days, Bitcoin's movement is mostly driven by liquidity hunting and is caught in complex and risky corrections.
The resistance zone currently in front of Bitcoin is marked in red. If the price is going to get rejected, it should happen from this zone. However, if this zone is broken and price stabilizes above it, Bitcoin could turn bullish again.
Considering today is Monday, volumes are still low, and the price is near a strong order block | you should be careful with your positions.
For risk management, please don't forget stop loss and capital management
Comment if you have any questions
Thank You
Bitcoin’s Reversal from Supports — Is the Correction Over? Bitcoin ( BINANCE:BTCUSDT ) moved as I expected in the previous idea , and it also reversed the decline I intended and started to rise from the Support zone($102,000-$107,120) , Support lines , and 50_SMA(Daily) .
Bitcoin is trading near the Resistance zone($104,380-$103,670) , Cumulative Short Liquidation Leverage($105,500-$105,265) , and Resistance lines .
In terms of Elliott Wave theory , it seems that Bitcoin has managed to complete the main wave Y . The main corrective structure was the Double Three Correction(WXY) . If the Resistance lines are broken , we can confirm the end of the main wave Y .
I expect Bitcoin to start rising after a re-correction from Cumulative Long Liquidations Leverage and reach the targets I have specified on the chart.
Cumulative Long Liquidation Leverage: $102,883-$102,181
Cumulative Long Liquidation Leverage: $101,318-$100,748
Note: If Bitcoin falls below $100,200(Worst Stop Loss(SL)), we should expect further declines.
Note: $105,500 is an important price for Bitcoin, and if Bitcoin can close the 4-hour candle above it, we can expect a break of the Heavy Resistance zone($104,380-$103,670)
Please respect each other's ideas and express them politely if you agree or disagree.
Bitcoin Analyze (BTCUSDT), 1-hour time frame.
Be sure to follow the updated ideas.
Do not forget to put a Stop loss for your positions (For every position you want to open).
Please follow your strategy and updates; this is just my Idea, and I will gladly see your ideas in this post.
Please do not forget the ✅' like '✅ button 🙏😊 & Share it with your friends; thanks, and Trade safe.
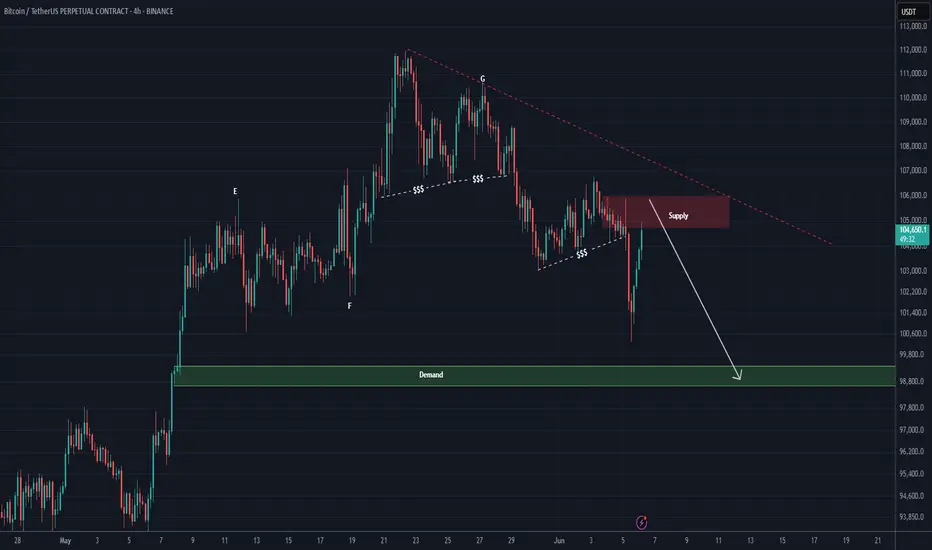
BTC NEW UPDATE (4H)After dropping toward the 100K zone and sweeping the liquidity pool, Bitcoin has made a strong rebound to the upside, putting high-leverage short positions at risk. However, it is now approaching a supply zone that could potentially push the price back down toward the 98K area.
If the market maker intends to drive the price lower and trigger a bearish scenario, this is the zone to do it from. Let’s see what happens.
A daily candle close above the invalidation level ($107,000) would invalidate this analysis.
Let’s see how Bitcoin reacts to the red box.
For risk management, please don't forget stop loss and capital management
When we reach the first target, save some profit and then change the stop to entry
Comment if you have any questions
Thank You
Bitcoin's Structure Breaks — PRZ May Trigger a BounceBitcoin ( BINANCE:BTCUSDT ) has finally continued its downward trend , as I expected in my previous idea .
Do you think this downward trend will continue or not?
Bitcoin has now managed to break the Support zone($104,180-$103,670) and the lower line of the Ascending Broadening Wedge Pattern .
In terms of Elliott Wave theory , Bitcoin appears to be completing microwave C of the main wave Y of the Double Three Correction(WXY) .
I expect Bitcoin to continue to decline to the Support zone($102,000-$107,120) and the Potential Reversal Zone(PRZ) and then start to rise again.
I choose to label this idea as ''Long''.
Note: If Bitcoin falls below $100,200, we should expect further declines.
Please respect each other's ideas and express them politely if you agree or disagree.
Bitcoin Analyze (BTCUSDT), 1-hour time frame.
Be sure to follow the updated ideas.
Do not forget to put a Stop loss for your positions (For every position you want to open).
Please follow your strategy and updates; this is just my Idea, and I will gladly see your ideas in this post.
Please do not forget the ✅' like '✅ button 🙏😊 & Share it with your friends; thanks, and Trade safe.

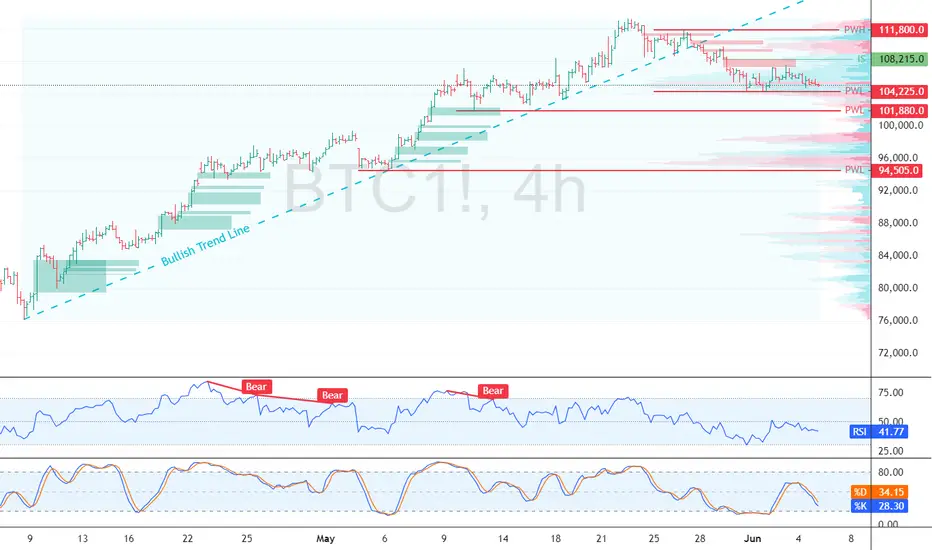
Bitcoin’s Bearish Signal: Key Levels to WatchFenzoFx—Bitcoin consolidates near $104,225 after breaking below the bullish trendline, signaling a possible break of structure. This level acts as immediate support, and a bearish wave could form if BTC closes below it, targeting the $101,880 demand zone.
The bearish outlook remains valid unless Bitcoin surpasses $108,215. If broken, price could rise toward $111,800.
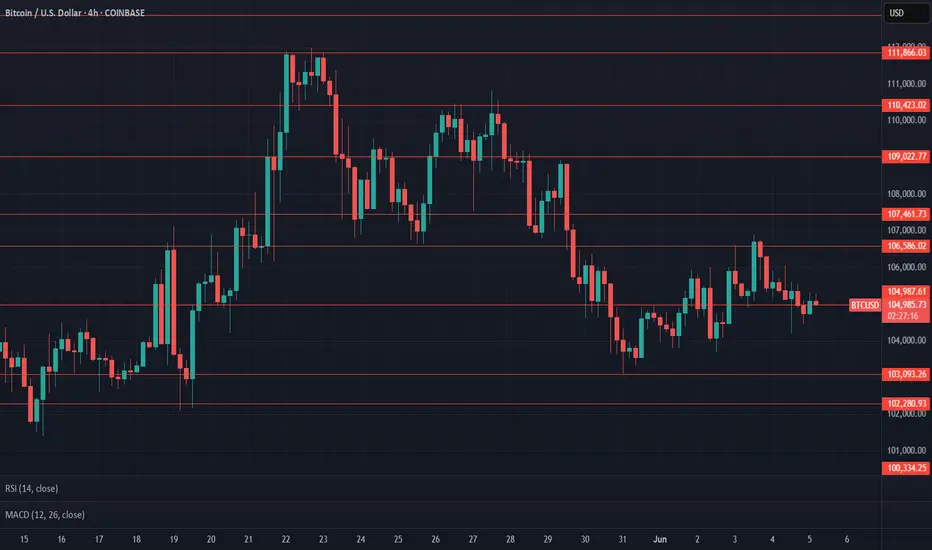
$BTC UpdateCRYPTOCAP:BTC #BTC $104,987 support in effect, previous weekly closed with bearish engulfing, 4h closed with bullish engulfing - current 4H trying to follow thru. $107,461 support needed to push for $110,423 resistance, and then the new ATH. $103,093 current support, $99,361 key support from here. Watch given S/R
Bitcoin’s Rally Fades Below Resistances — Bearish Wave Setup!Bitcoin ( BINANCE:BTCUSDT ) started to fall as I expected in the previous idea , but failed to break the Heavy Resistance zone($110,000-$105,820) .
Bitcoin is trading near the Resistance zone($107,520-$105,940) , Cumulative Short Liquidation Leverage($106,720-$105,948) , and the Resistance lines .
From the perspective of Elliott Wave theory , Bitcoin appears to have completed a main wave 4 near the Resistance lines. The structure of the main wave 4 was a Double Three Correction(WXY) . One of the signs of the completion of the main wave 4 could be the Evening Star Candlestick Pattern .
I expect Bitcoin to decline to at least Cumulative Long Liquidation Leverage($103,666-$102,800) AFTER breaking the Support line , and the next target is the Support zone($102,000-$107,120) .
Note: Rising tensions between Russia and Ukraine could help drive down Bitcoin.
Note: If Bitcoin touches $107,600, we can expect more pumps.
Please respect each other's ideas and express them politely if you agree or disagree.
Bitcoin Analyze (BTCUSDT), 1-hour time frame.
Be sure to follow the updated ideas.
Do not forget to put a Stop loss for your positions (For every position you want to open).
Please follow your strategy and updates; this is just my Idea, and I will gladly see your ideas in this post.
Please do not forget the ✅' like '✅ button 🙏😊 & Share it with your friends; thanks, and Trade safe.
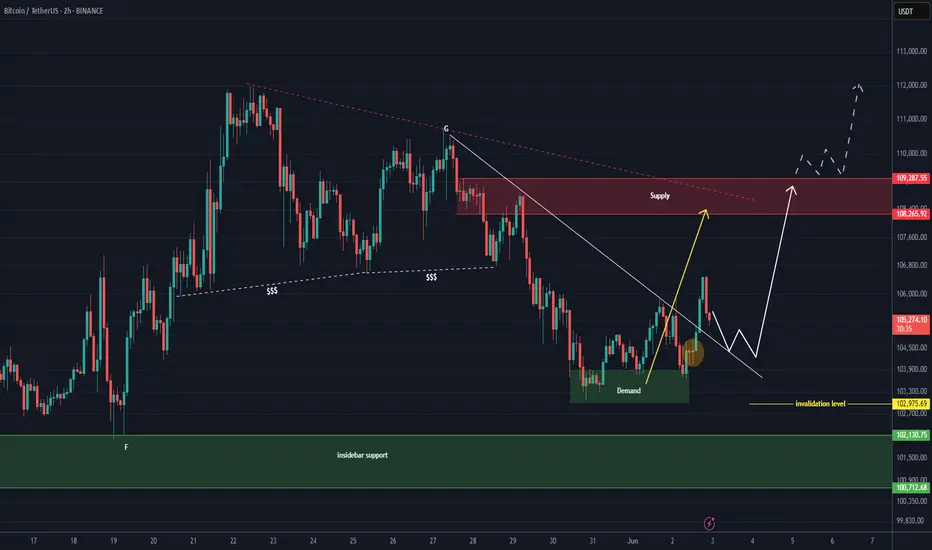
BTC NewUpdate (2H)This analysis is an update of the analysis you see in the "Related publications" section
As we had identified in the previous analysis, the price could have reversed to the upside from either the upper or lower green zone. It seems that the orders in the upper green zone were sufficient.
Given the break of the trigger line, the area marked by the yellow circle is now a key zone for us. If the price pulls back to this yellow circled area, it could move toward the red zone. And if the red zone is broken, we might witness a new all-time high (ATH).
The closure of a 4-hour candle below the invalidation level will invalidate this analysis.
For risk management, please don't forget stop loss and capital management
Comment if you have any questions
Thank You
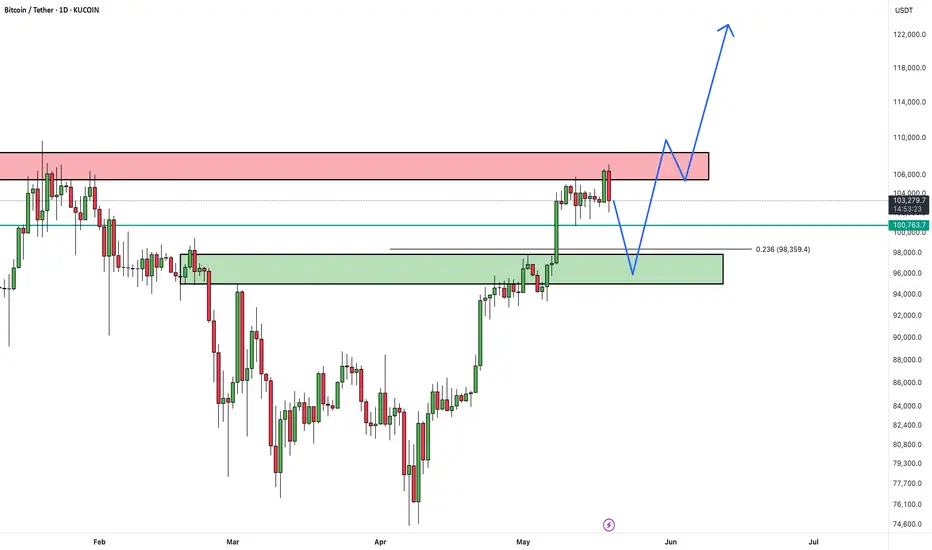
Hello Symmetrical triangleThe appearance of this symmetrical triangle marks the end of the decline in this cycle, in which the price is stabilizing in order to continue its upward movement. 109 is the next level.

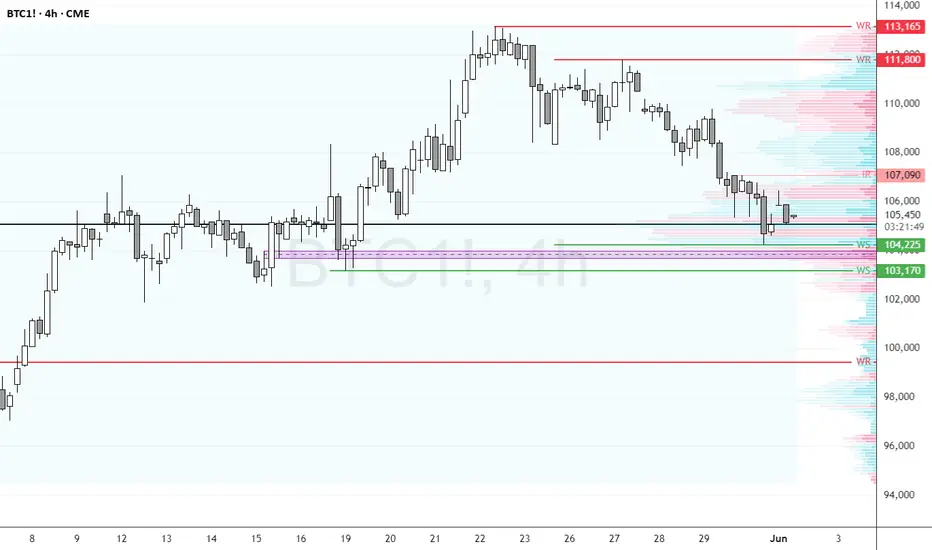
BTC Faces Critical Resistance—Breakout or Further Decline?FenzoFx—Bitcoin continues its bearish trend after hitting its 2025 all-time high at 113,165. BTC/USD is currently trading near $105,400, a high-volume area where price could either bounce or break lower.
The key resistance level rests at $103,170, supported by a bullish Fair Value Gap. If price holds above this zone, Bitcoin could rise toward $107,090.
However, a close below $103,170 would invalidate the bullish outlook, with the next bearish target at $99,435.
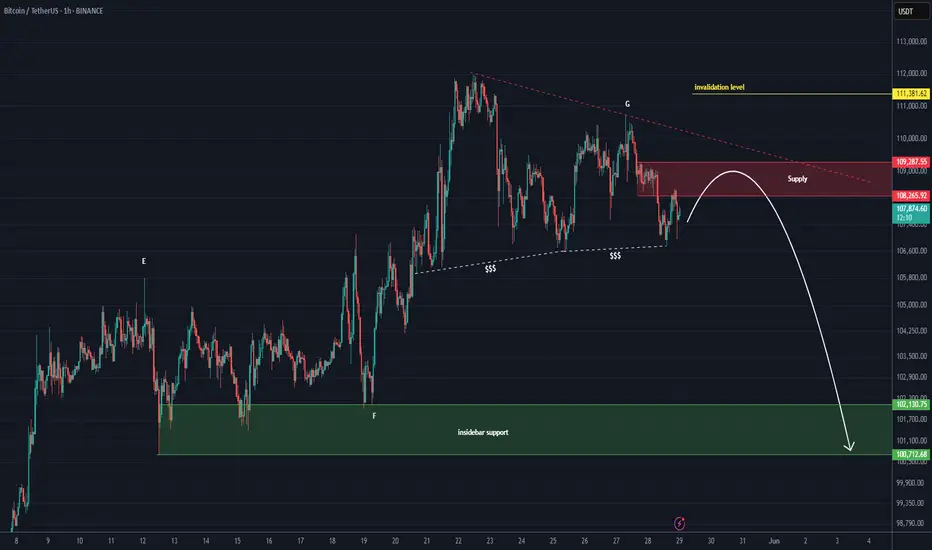
Bitcoin is bearish | stay cautious (1H)This analysis is an update of the analysis you see in the "Related publications" section
We have been warning about a potential Bitcoin correction for some time. It appears that wave G has ended, and key levels have been lost. If the price reaches the red box, it is expected to be rejected downward.
The green zone is a relatively strong support area for Bitcoin, and we should closely watch this level.
A daily candle closing above the invalidation level would invalidate this analysis.
For risk management, please don't forget stop loss and capital management
Comment if you have any questions
Thank You
Bitcoin Bounce on Trump Tariff Delay – Short Setup Still Valid!Bitcoin ( BINANCE:BTCUSDT ) started to fall as I expected in the previous idea , and declined near the Support lines .
Bitcoin started pumping after the news that " US President Trump agreed to postpone 50% EU tariffs until July 9th ." Do you think this pumping of Bitcoin will continue?
Bitcoin is trading in a Heavy Resistance zone($110,000-$105,800) near the Potential Reversal Zone(PRZ) .
From the Elliott Wave theory perspective , Bitcoin appears to be in corrective waves , which is why I am labeling this idea as a ''Short''. The corrective waves structure is of the Expanding Flat(ABC/3-3-5) type.
I expect Bitcoin to attack the Support lines once again, and if these lines are broken, it will decline to the Targets I have indicated on the chart.
Notes :
MicroStrategy bought another 4,020 Bitcoins, but it didn't have much of an impact on the market.
If the Bitcoin price falls back below $109,000, about $185 million in long Bitcoin positions will be liquidated . = Attractive for exchanges
Bitcoin 2025 Conference to be Held in Las Vegas, Tuesday-Thursday = Could Cause Market Excitement .
Note: If Bitcoin touches $112,080, we should expect more pumping.
Please respect each other's ideas and express them politely if you agree or disagree.
Bitcoin Analyze (BTCUSDT), 1-hour time frame.
Be sure to follow the updated ideas.
Do not forget to put a Stop loss for your positions (For every position you want to open).
Please follow your strategy and updates; this is just my Idea, and I will gladly see your ideas in this post.
Please do not forget the ✅' like '✅ button 🙏😊 & Share it with your friends; thanks, and Trade safe.
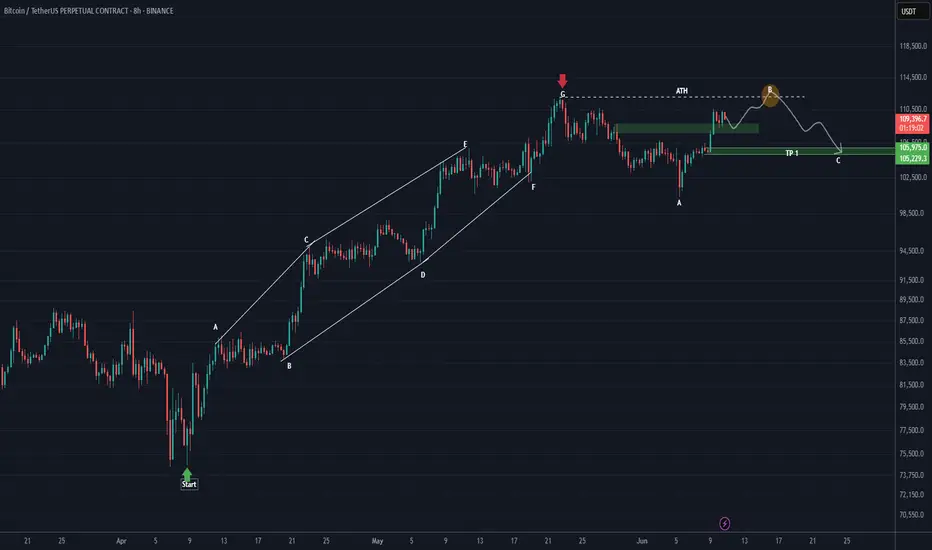
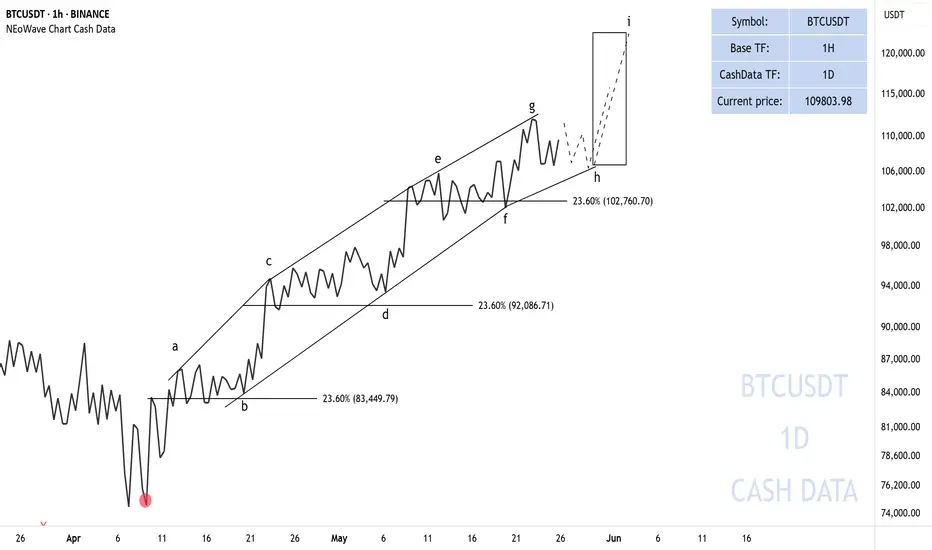
Bitcoin's upward movement continuesThe upward movement that Bitcoin started at $74,550 has many similarities between its waves. Considering the similarity in price and the large time between waves A-C-E-G and waves B-D-F, it is clear that a diametric or symmetrical is forming.
Considering that the post-pattern movement after the g-wave has not passed, there are two scenarios:
1- Formation of an x-wave after the diametric
2- Formation of a symmetrical
However, considering that the post-pattern movement after the g-wave has not been confirmed and the high similarity in price in all waves, my opinion is that a symmetrical is forming and we will have another upward wave. This upward wave could end at $115,500 or $123,000.
Good luck
NEoWave Chart
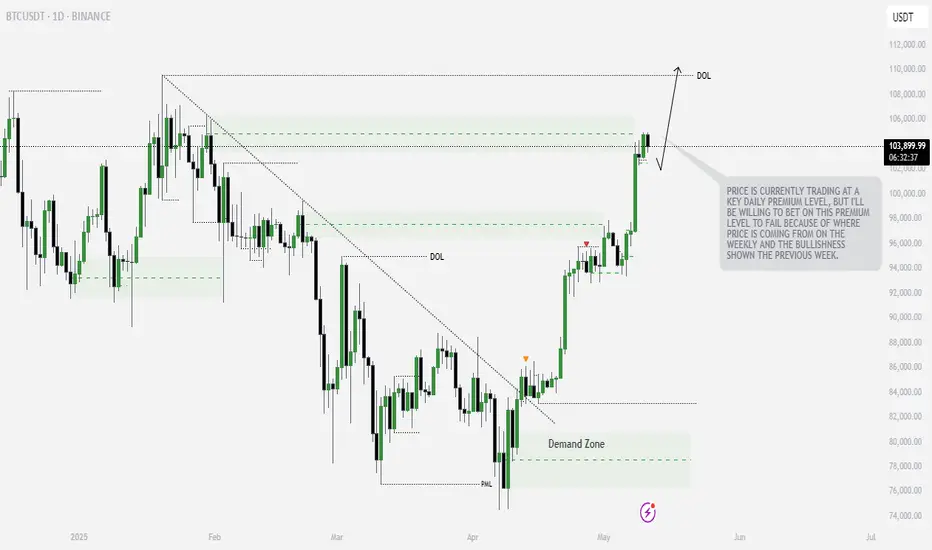
BTCUSD - $100K FINALLY!! WHAT NEXT?MARKET UPDATE
We've finally seen BTC @$100k after the long wait. So what's next on BTC Price Action?
My next Target is $110,000 which was the highest point it got to before the drop. With the current momentum i don't think it'll make a deep retracement before getting that price target.
MARKET PROFILE
I want to see a displacement to the upside earlier in the week(before CPI), with Tuesday's CPI forming the HOW(High of Week) after taking the High @$110k. I'll only be participating on the bullish run to $110k and once my DOL has been met i'll be neutral on BTC and sit on the sideline.
FINAL NOTICE
Patience pays, i'll wait for price to get to my level before executing(if it hasn't traded to my DOL). If price leaves me behind and makes the run to $110k i won't chase price.
What do you think BTC is likely to do next? Share your opinions in the comment guys.
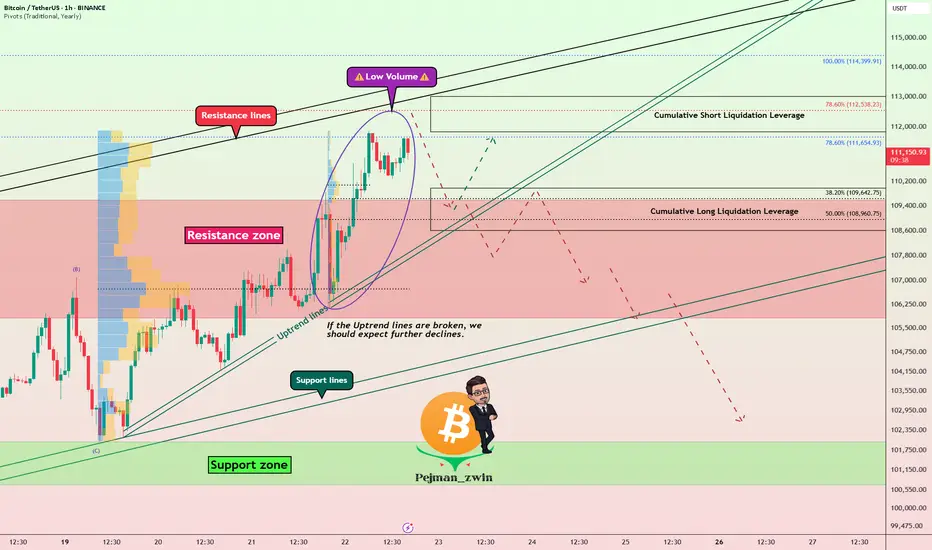
Bitcoin Be Setting Bull Trap?_Breakout Without High VolumeBitcoin ( BINANCE:BTCUSDT ) started to fall yesterday after forming a new All-Time High(ATH) with high volume , but started to rise again. One of the reasons for Bitcoin’s sudden drop yesterday was the sharp drop in the S&P 500 ( SP:SPX ) index .
First of all, I must say that Bitcoin’s situation is a bit complicated and difficult to analyze , so pay more attention to money management. Be prepared for any scenario.
Bitcoin is trading above the Resistance zone($109,588-$105,820) and near the Resistance lines and Cumulative Short Liquidation Leverage($113,020-$111,833) . What is worrying is that the break of the Resistance zone($109,588-$105,820) was NOT accompanied by high volume , suggesting a bull trap is possible .
I see a correction to at least Cumulative Long Liquidation Leverage($109,972-$108,609) given the low breakout volume for Bitcoin and the large sell orders in the upper prices for Bitcoin .
--------------------------------------------
Today, the Flash PMI data from the U.S . came in stronger than expected:
Flash Manufacturing PMI: 52.3 (vs. forecast 49.9, previous 50.2)
Flash Services PMI: 52.3 (vs. forecast 51.0, previous 50.8)
Analysis :
Both numbers exceeded expectations, signaling stronger economic activity in the U.S. This is bullish for the USD( TVC:DXY ) and could put short-term downward pressure on Bitcoin, as it lowers the chances of near-term Fed rate cuts.
--------------------------------------------
Do you think Bitcoin is completing a Bull Trap or should we expect Bitcoin to increase further?
Note: If Bitcoin breaks above $114,500 with high momentum, we can expect Bitcoin to rise to near $119,000.
Please respect each other's ideas and express them politely if you agree or disagree.
Bitcoin Analyze (BTCUSDT), 1-hour time frame.
Be sure to follow the updated ideas.
Do not forget to put a Stop loss for your positions (For every position you want to open).
Please follow your strategy and updates; this is just my Idea, and I will gladly see your ideas in this post.
Please do not forget the ✅' like '✅ button 🙏😊 & Share it with your friends; thanks, and Trade safe.
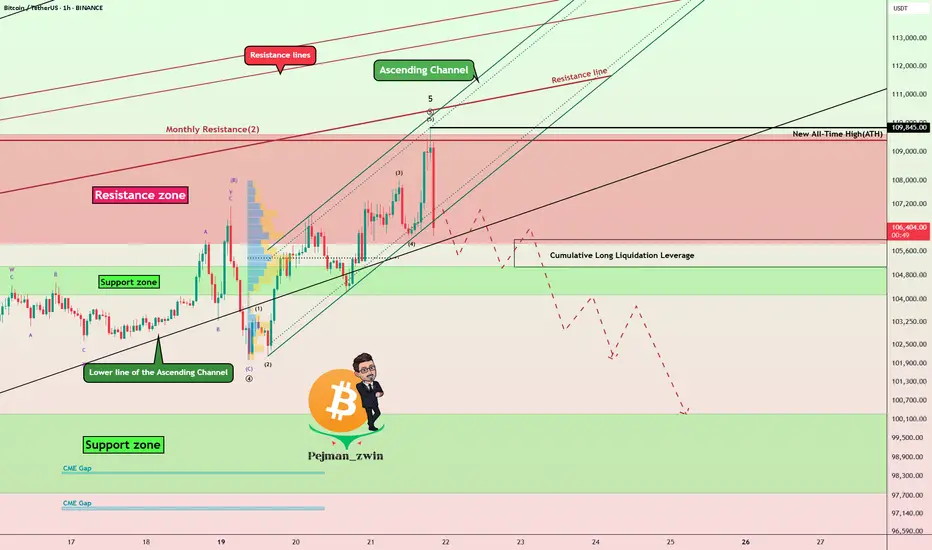
Bitcoin’s Pump to NEW ATH($109,845) Ends in High-Volume ReversalBitcoin ( BINANCE:BTCUSDT ) moved towards the targets as I expected in my previous idea , although it faced pump and dump moves in reaching the targets .
Bitcoin managed to create a new New All-Time High(ATH=$109,845) but immediately began to decline on high volume .
Bitcoin is trading in the Resistance zone($109,588-$105,860) and near the Resistance lines , Monthly Resistance(2) .
In terms of Elliott Wave theory , Bitcoin was able to complete main wave 5 .
I expect Bitcoin to fall to at least $102,200 AFTER breaking the Support zone($105,100-$104,140) , and the possibility of further declines is very high .
Also, on the 1-hour timeframe of the USDT.D% ( CRYPTOCAP:USDT.D ) chart, a bullish and regressive Falling Wedge pattern is visible , with its upper line broken.
Do you think Bitcoin can finally create a NEW All-Time High(ATH) Again!?
Note: If Bitcoin touches $110,100, we should expect a pump.
Please respect each other's ideas and express them politely if you agree or disagree.
Bitcoin Analyze (BTCUSDT), 1-hour time frame.
Be sure to follow the updated ideas.
Do not forget to put a Stop loss for your positions (For every position you want to open).
Please follow your strategy and updates; this is just my Idea, and I will gladly see your ideas in this post.
Please do not forget the ✅' like '✅ button 🙏😊 & Share it with your friends; thanks, and Trade safe.
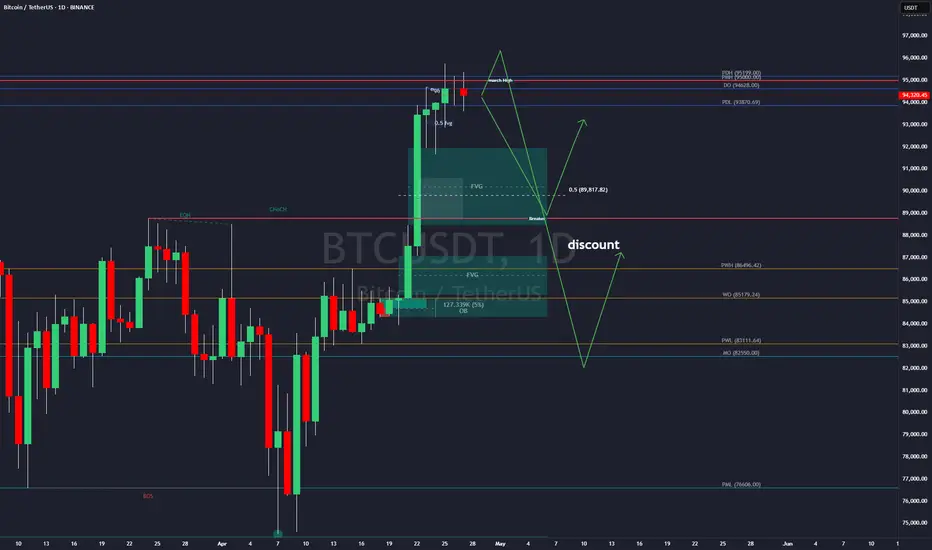
BTC- crash is coming? Most likely no)In its best traditions, bitcoin in one impulse reached the monthly target 95000, which I wrote about
The probability of a correction to set a higher low in the equilibrium area of the range is increasing.
Probably in May the crypto market will have to pass the last stability test, in case of success we will get excellent opportunities for spot and speculative positions before the next cyclical growth spiral.
For now have to wait for weekly open but there are 2 options:
pump till PWH and then move on correction
slow bleeding till 0.5 or mb till 83k in worst case and then pump to ATH
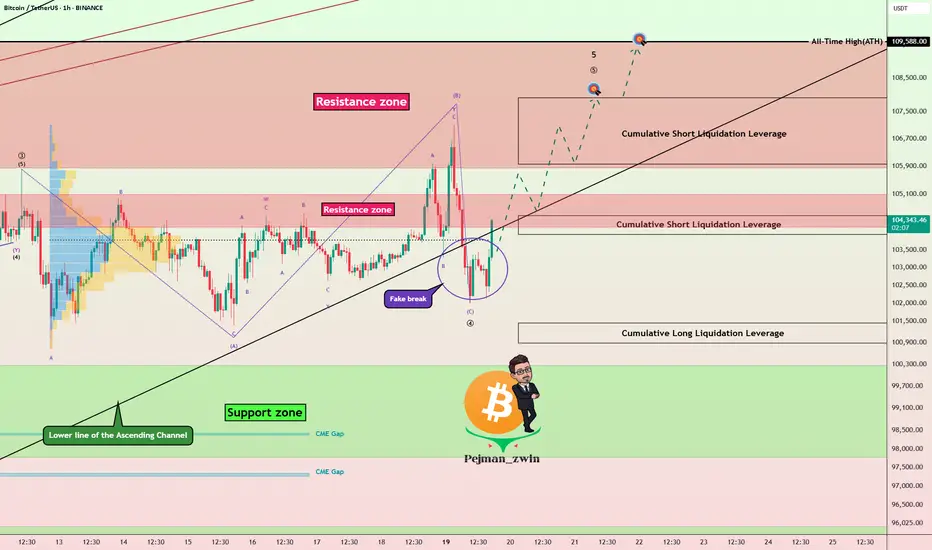
Bitcoin vs Resistance Zones | Fake Breakdown Below the Channel!Bitcoin ( BINANCE:BTCUSDT ) has been moving up and down with high momentum over the past 24 hours and finally fell below the lower line of the ascending channel . Is this break of the lower line of the ascending channel valid?
Bitcoin is trading near the Resistance zone($105,100-$104,140) , Cumulative Short Liquidation Leverage($104,478-$103,941) . Since the volume of breaking of the lower line of the ascending channel is NOT high, the probability of a fake break is very high (in my opinion).
In terms of Elliott Wave theory , the structure of the main wave 4 seems to be an Expanding Flat(ABC/3-3-5) . The main wave 5 could lead to the formation of a new All-Time High(ATH ).
One of the reasons why I think we saw a Fake Break below the lower line of the ascending channel is that I think the S&P500 Index ( SP:SPX ) will trend upward , and given the high correlation between Bitcoin and S&P500 Index these days, we can expect Bitcoin to increase .
I expect Bitcoin to start rising again AFTER breaking the Resistance zone($105,100-$104,140) and touch the targets I have indicated on the chart.
Note: If Bitcoin touches $101,800, we can expect more dumps.
Please respect each other's ideas and express them politely if you agree or disagree.
Bitcoin Analyze (BTCUSDT), 1-hour time frame.
Be sure to follow the updated ideas.
Do not forget to put a Stop loss for your positions (For every position you want to open).
Please follow your strategy and updates; this is just my Idea, and I will gladly see your ideas in this post.
Please do not forget the ✅' like '✅ button 🙏😊 & Share it with your friends; thanks, and Trade safe.
Bitcoin Hourly Analysis (2H)Given Bitcoin's rapid movement near previous highs, along with quick pump-and-dump action and liquidity grabs, it's expected that the liquidity pool below the price will be swept, collecting orders from the green zone, and then price may reverse back to the upside.
A 4-Hour candle closing below the invalidation level will invalidate this analysis.
For risk management, please don't forget stop loss and capital management
Comment if you have any questions
Thank You

BTCUSDTHello Traders! 👋
What are your thoughts on BITCOIN?
As expected, Bitcoin entered a corrective phase after reaching a key resistance zone. This move was accompanied by a bearish divergence, indicating weakening bullish momentum.
We expect the correction to extend toward the identified support zones, where price may find demand.
If Bitcoin holds at one of these key support levels, a bullish reversal could follow, potentially leading to a new upward leg and fresh all-time highs.
Is this correction setting the stage for the next big move? Share your thoughts below!
Don’t forget to like and share your thoughts in the comments! ❤️
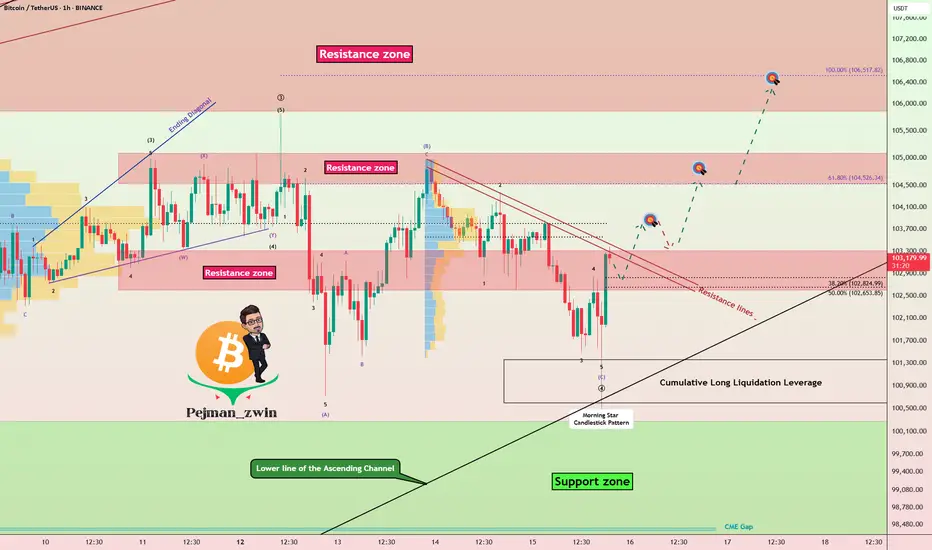
Bitcoin Breakout Loading: Resistance Zone Under Pressure!!!Bitcoin ( BINANCE:BTCUSDT ) made the correction I expected , as I predicted in my previous idea .
Bitcoin is trading in the Resistance zone($103,320-$102,600) and near the Resistance lines . Given the momentum of the previous hour's candle and the fact that the previous three candles together formed a Morning Star Candlestick Reversal pattern , it is expected that the Resistance lines will be broken soon.
In terms of Elliott Wave theory , it looks like Bitcoin has completed the main wave 4 as I expected with a Zigzag Correction(ABC/5-3-5) . A break of the Resistance lines by Bitcoin could confirm the end of the main wave 4 .
Also, given Bitcoin's higher correlation with the S&P500 Index ( SP:SPX ) and the fact that I expect the S&P500 Index to increase , the increase in the S&P500 Index could help Bitcoin increase further .
I expect Bitcoin to break the Resistance zone($103,320-$102,600) and Resistance lines soon and attack towards the Resistance zone($105,100-$104,520) .
Cumulative Long Liquidation Leverage: $101,360-$100,600
Note: If Bitcoin falls below $101,280, we should expect further declines.
Please respect each other's ideas and express them politely if you agree or disagree.
Bitcoin Analyze (BTCUSDT), 1-hour time frame.
Be sure to follow the updated ideas.
Do not forget to put a Stop loss for your positions (For every position you want to open).
Please follow your strategy and updates; this is just my Idea, and I will gladly see your ideas in this post.
Please do not forget the ✅' like '✅ button 🙏😊 & Share it with your friends; thanks, and Trade safe.