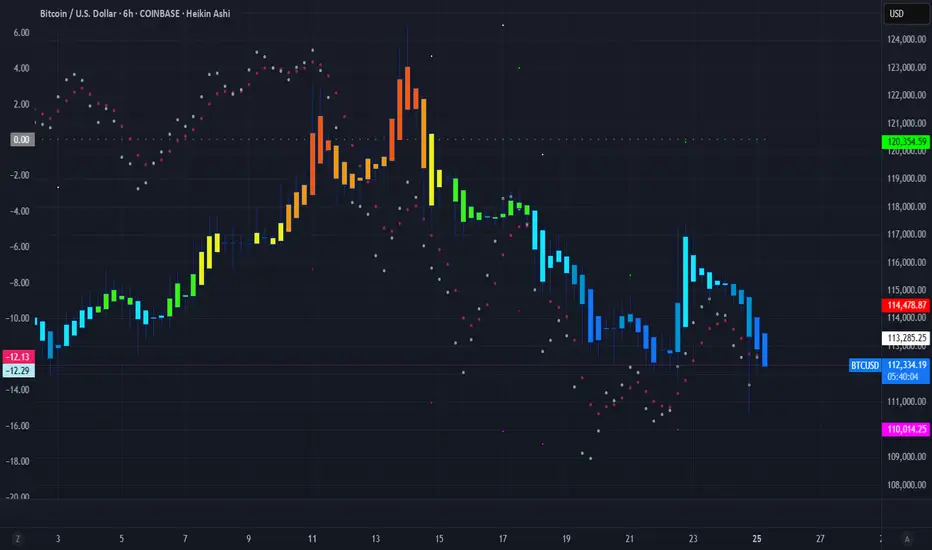
▒₿▒ Distribution Top - Anatomy of a Bitcoin Cycle Top ▒₿▒COINBASE:BTCUSD
I've identified key price action indications that we have "topped" with an ATH for this Bull Market Cycle. There is a much deeper analysis that needs to be done here.
While this price action is the first major clue, to confirm a true distribution top, we'll also need to analyze volume profiles for institutional selling, spot bearish divergences in key momentum oscillators, and watch on-chain metrics for any signs of whale or miner selling pressure.
Every Bitcoin cycle has a story, and the final chapter is always the most dramatic. I've been analyzing the price action at every major cycle peak, and there's a recurring pattern that acts like a final warning before the curtain falls. It’s not the explosive top itself, but the messy, indecisive period that follows: the Distribution Top .
This isn't just a pattern; it's the visual footprint of a massive transfer of wealth. It’s the moment when the cycle's early investors (smart money) begin to distribute their holdings to the late, euphoric buyers.
Look at the price action from the November 2021 ATH top. After the euphoric peak, the clean, powerful uptrend dies. It's replaced by a volatile, sideways "wiggle." The Heikin Ashi candles lose their bodies, showing long wicks on both sides. This is the signature of market conflict and exhaustion.
Cycle Tops vs. Local Highs: A Crucial Distinction
It's important to understand that this "wiggle" is unique to major, euphoric ATH cycle tops. Other tops, like the one from August 2021 shown below, have a much different character. Notice how the rejection is sharper, faster, and lacks the prolonged, grinding "wiggle." This is often a rejection from a known resistance level, not the slow, painful end of cycle-wide euphoria.
The "Distribution Top" is a process. It’s designed to churn, create confusion, and trap breakout traders before the real move down begins. It’s the market grinding at the highs, absorbing the last wave of FOMO. We saw this exact anatomy play out in the April 2021 top as well.
The Key Takeaway for Bitcoin Investors:
Recognizing this specific pattern is crucial for capital preservation. When you see this shift from clean momentum to choppy, indecisive grinding near an all-time high , it's a signal that the market character has changed. The risk is no longer to the upside; it's to the downside.
While this price action is the first major clue, to confirm a true distribution top, we'll also need to analyze key trend lines, candlestick patterns, seasonality, volume profiles for institutional selling, and watch on-chain metrics for any signs of whale or miner selling pressure.
Now, take a look at the most recent price action. We are seeing the early stages of this very same pattern developing after a new high.
The question every Bitcoin holder should be asking is: Is this history rhyming once again?
As I mentioned at the start of this post, there are much more metrics to analyze here, so I'll be updating this post with further findings.
DISCLAIMER
I AM NOT A FINACIAL ADVISOR, NOR AM I YOURS. THIS IS NOT FINANCIAL ADVICE. MEARLY DOODLINGS ON A MATHMATICALLY DRIVEN GRAPHICAL INTERFACE, TRACKING AN INVISIBLE 256BIT MILITARY-GRADE ENCRYPTED ASSET. . . FOR ENTERTAINMENT/AMUSEMENT PUROSES ONLY. ENJOY!
Looking to hear your thoughts on this @TradingView @Profit_Through_Patience @David_Perk @ProjectSyndicate @Xanrox_ @HAMED_AZ @melikatrader94
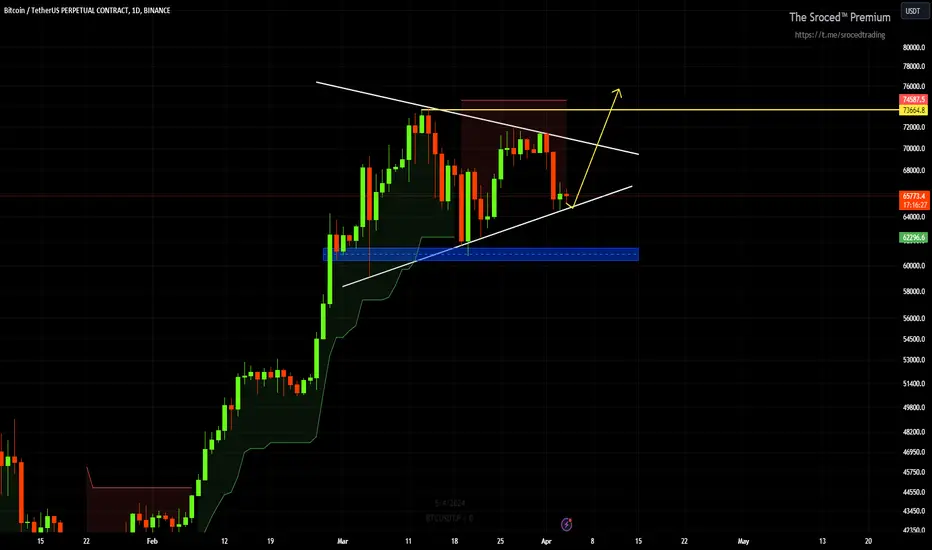
Btcchartpattern
BTC is showing Bullish Pennant Pattern in the 1D time frameBINANCE:BTCUSDT.P
BTC is showing Bullish Pennant Pattern in the 1D time frame and the price may increase between 71k and 73k if support is found from the underlying trendline. brake the trendline below, price can down between 61k and 60k!🌈🍀
NOTE: This is just my prediction. Be sure to use STOPLOSS and remember that I am not a financial adviser. your money, your risk!
Thanks
The sroced.
Bitcoin Could Reach high 38 before starting to collapseBTC been consolidating around high 37K and bouncing to the upside around 38.5.We could see a correction and another move to the upside around 38.8 before the main move to the downside starts.OR 38.2 was the top and we go down today.
Thanks for watching

Bitcoin Sudden SpikeUp Could Reverse SharplyBitcoin started to go up from sunday and now its at 35K with these sharp moves usually comes sharp retracements.
Thanks for watching

Bitcoin More Bullish Signals For 29.4!Bitcoin yesterday pump cleared weekly high and performed a SL hunt to 28.5, after that NY retraced it all back and In My Opinion we will crawl up today then jump to 29.4 at least. Could go to 26.9 or 26.8 but losing that level will send it down to 25.1.
Thanks for watching

Bitcoin Could Continue The Sell Off to 20KBitcoin finally moved yesterday and made a low.if 24.8 gets broken we could see 20K in no time.
We could go higher than 25K which I talked in the video
Thanks for all your support

Bitcoin Giving Us Daily Reversal PatternBitcoin Printed An 8H Reversal Pattern Yesterday And Daily reversal pattern Today.The signs are there for a huge reversal. Is it Real or Jebait ?
Thanks for watching
