$BTCDOM/USDT 2D (#BinanceFutures) Rising wedge on resistanceBitcoin Dominance Index looks locally topped and about to reverse mid-term, let's give it another try!
Current Price= 1517.1
Sell Entry= 1517.1 - 1572.5
Take Profit= 1411.7 | 1311.6 | 1211.1
Stop Loss= 1656.1
Risk/Reward= 1:1.2 | 1:2.1 | 1:3
Expected Profit= +17.24% | +30.20% | +43.20%
Possible Loss= -14.40%
Fib. Retracement= 0.236 | 0.382 | 0.559
Margin Leverage= 2x
Estimated Gain-time= 5-6 months
Tags: #BTCDOM #BTCDOMUSDT #BTCD #BitcoinDominance #Index #Futures #Derivatives #Dominance
Contract:
www.binance.com
Btcd

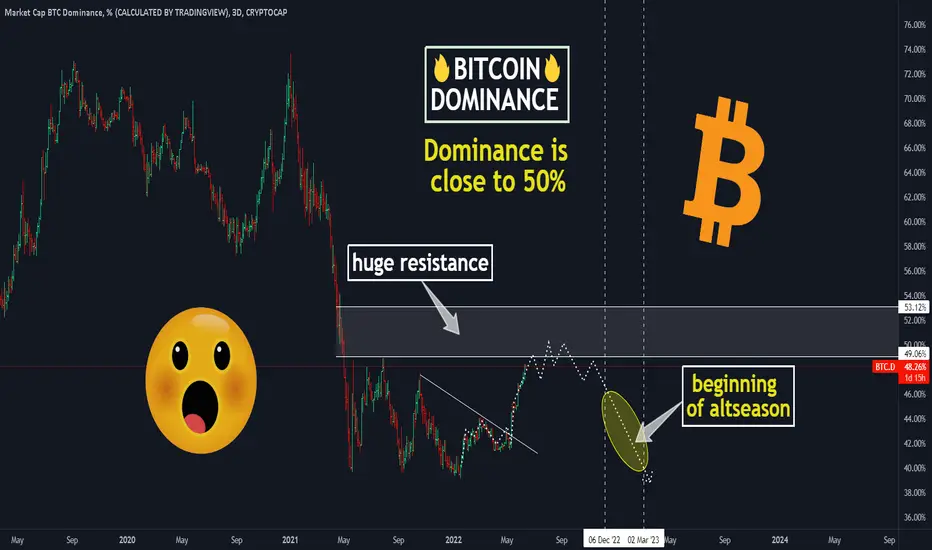
📊BITCOIN destroys ALTCOINS! How long will this go on?Bitcoin is falling but all money flows into it. Almost all alts are destroyed and fall for 85-90%. Only few of them still follow the BTC and fall for 65-75%. But is it finish for alternative coins fall?
Now the Dominance is close to the 50% which were described in this idea. I think the 50-53% are become the top for the BTC.D.
📊Even if Bitcoin falls to the bottom and consolidates there, altcoins continue to lose capitalization. And even if the decline of the crypto market has stopped, altcoins will continue to lose value. As a rule, this happens because long-term holders of altcoins become not by their own choice. If you know what I mean.
This was in 2018 and 2020 after Bitcoin fell to its lows. Altcoins begin their huge growth and Altseason✅ after the main cryptocurrency (BTC) renews✅ its highs and hype returns to the crypto market. So keep this in mind!
📈Why the Dominance in the long-term downtrend? The numbers of Altcoins is growing through the time and in any case money flows to the alternative coins. So, the dominance will fall to 20-30% with high possibility in 7-10 years .
Friends, press the "like"👍 button, write comments and share with your friends - it will be the best THANK YOU.
P.S. Personally, I open an entry if the price shows it according to my strategy.
Always do your analysis before making a trade.
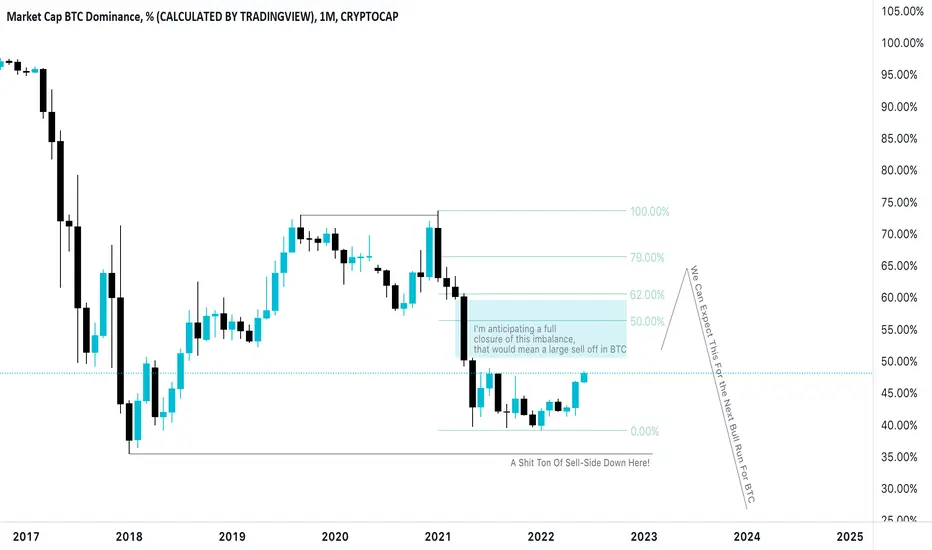
BTC.D Intermarket Analysis This is the BTC Dominance (BTC.D) chart.
BTC.D Down = BTCUSD UP
BTC.D UP = BTCUSD Down
Right now the BTC.D Chart is at a discounted market, however, it seems to be trading up into a premium market which is (technically speaking) why BTCUSD has been falling recently. Based on this chart, BTC will likely drop a lot more from where it's at should we reach up into a further premium for the BTC.D market.
What is BTCD? BTCD is short for Bitcoin dominance (BTCD) and is defined as the ratio of Bitcoin's market capitalization to that of the rest of the cryptocurrency markets. Bitcoin (BTC) is a digital currency that was first introduced back in 2009.
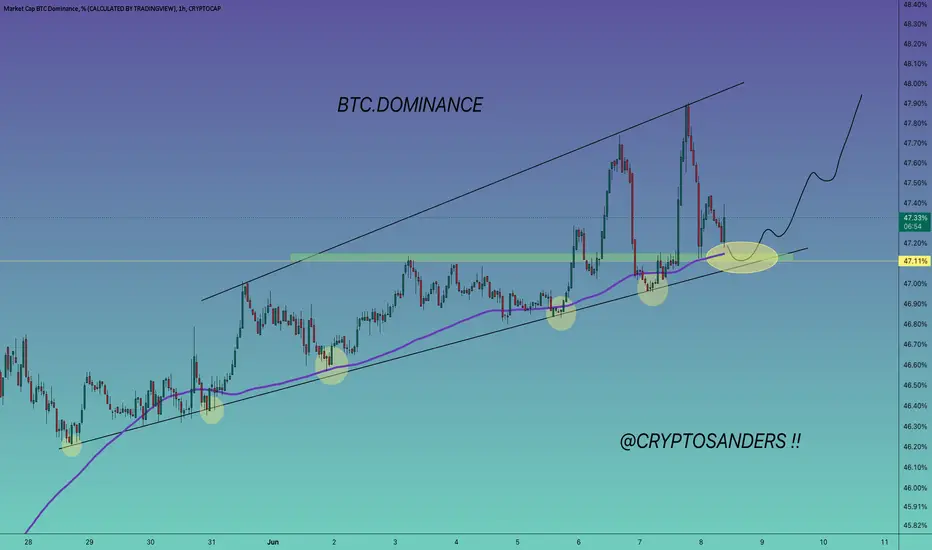
#BTC.DOMINANCE 1Hour CHART UPDATE !!Hello dear traders, we are new here so we ask you to support your ideas with your LIKE and COMMENT, feel free to ask any questions in the comments, and we will try to answer for all, thanks, Friends.
I have tried my best to get the best possible results in this chart.
Hello, dear traders welcome to this BTC.DOMINANCE 1Hr chart analysis.
Now Rejected from resistance and Holding 47.11% support.
We can see more Blood baths in #Altcoins
Remember:-This is not a piece of financial advice. All investment made by me is at my own risk and I am held responsible for my own profit and losses. So, do your own research before investing in this trade.
Sorry for my English it is not my native language.
Do hit the like button if you like it and share your charts in the comments section.
Thank you...
Bitcoin Dominance Mirror ImageBTC.D (Bitcoin Dominance) still needs to complete its "mirror image" back from December...
Currently, prices are trading safely above EMA10 and EMA50, long-term/weekly... This signal is strong enough.
We have multiple candles of bullish consolidation (green above EMA10) and the RSI is also super strong.
The signals are also bullish on this chart.
We wait and see how it goes.
Namaste.

USDT.D OutlookUSDT.D has made a descending pattern and cannot already tolerate above 6% range. Falls' phases expected by: 1st: 5.90% -- 2nd: 5.30% -- 3rd: 4.20%

BTC.Domination Analysis 4 June 2022#BTC.D ANALYSIS
we can see BTC.D now make a rising wedge pattern And also any bearish divergence in RSI . Rising wedge valid if BTC.D breakdown . if this can happen, good for ALTS coin

BTC.D Dominance of BTCBTC.D is on the daily resistant should be dump big and Altcoins pump big , will see
BTC.DOMINATION ANALYSIS BTC.D consolidation and make a bullish flag pattern . has breakout and also retest and now still consolidation in lower timeframe , we see have double doji pinbar candle on support and confirmation close with green candle , potential continue upward movement minimum 46.82%
so this is bad for ALTS if BTC.D up and BTC down ALTS will dump

Bitcoin To Continue Higher as Tether Dominance Goes LowerWe continue seeing bearish signals on the Tether Dominance Index (USDT.D) chart.
Yesterday we looked at the long-term chart and the RSI (weekly), the signals were clear there.
Looking at it closer today, our view remains the same.
- We can see prices moving below EMA10 on a full bearish candle.
- The RSI is trending down strong.
These signals are pointing lower.
The blue space on the chart is the main target/support.
Namaste.

Bitcoin Dominance RENKO (Weekly)We have a strong buy signal on the RENKO BTC.D index chart.
We can the last green brick closed above EMA10.
Supporter by really high volume.
A higher compared to February...
There is room for Bitcoin Dominance to go up.
Namaste.

Bitcoin Dominance Move Above EMA50 Weekly (Strong Signal)The Bitcoin Dominance Index (BTC.D) has gone bullish on the weekly timeframe.
We can see it growing above EMA50, which is a very strong signal.
We can also appreciate an RSI above 60 which is also really strong as this is the weekly timeframe.
Looking at the big trading channel above, it looks like Bitcoin Dominance is preparing from a strong price JUMP!
Namaste.

#BTC.DOMINANCE 1DAY UPDATE !!Hello dear traders, we are new here so we ask you to support your ideas with your LIKE and COMMENT, feel free to ask any questions in the comments, and we will try to answer for all, thanks, Friends.
I have tried my best to get the best possible results in this chart.
Hello, dear traders welcome to this BTC.DOMINANCE 1DAY chart analysis.
Dominance is getting rejection by the resistance. The reason we see some green in many Alts across the market.
ALT/ BTC Pairs are likely to continue the rally unless broken upside.
The trend for alts looks strong for now but keep in mind this will only stay this way as long as BTC holds the $28k level. That is the key level we need to keep an eye on.
Thank you for your time, we hope that our work is good for you, and you are satisfied, we wish you a good day and big profits.
Sorry for my English it is not my native language.
Thanks.

#BTC.DOMINANCE UPDATE BY CRYPTOSANDERS !Hello dear traders, we here new so we ask you to support our ideas with your LIKE and COMMENT, also be free to ask any question in the comments, and we will try to answer for all, thank you, guys.
Hello, dear traders welcome you to this BTC.DOMINANCE 1hr chart analysis.
Dominance is getting rejection by the resistance. The reason we see some green in many Alts across the market.
ALT/ BTC Pairs are likely to continue the rally unless broken upside.
The trend for alts looks strong for now but keep in mind this will only stay this way as long as BTC holds the $28k level. That is the key level we need to keep an eye on.
THANK YOU.Thanks for your time, we hope our work is good for you, and you are satisfied, we wish you a good day and big profits.
THANK YOU.
#BTC Dominance Rejection in progress.. ALTSEASON??#BTC Dominance getting rejection from the resistance. Reason we are seeing some green in many Alts across the market.
ALT/BTC Pairs are likely to continue the rally unless broken upside.
The trend for alts look strong for now but keep in mind this will only stay this way as long as BTC holds the $28k level. That is the key level we need to keep an eye on.
Make sure you keep enough cash to buy the Dips and always DCA your entires and use SLs.
Cheers
Smash that like button if you like it and share your views in the comment section.
Thank you
#PEACE

#BTC.DOMINANCE 1HOUR UPDATE BY CRYPTOSANDERS !! Hello dear traders, we here new so we ask you to support our ideas with your LIKE and COMMENT, also be free to ask any question in the comments, and we will try to answer for all, thank you, guys.
Hello, dear traders welcome you to this BTC.DOMINANCE 1hr chart analysis.
CHART ANALYSIS:-As we can see in the chart above BTC.D was trading inside the parallel channel pattern and broke above the 45% level.
Now, BTC.D is retesting the upper trend line, and here BTC.D can put towards the 49% level which is 8.5% from the retesting level.
It indicates that BTC can also pump at any time and we can witness short-term bull rallies in upcoming hours.
Thanks for your time, we hope our work is good for you, and you are satisfied, we wish you a good day and big profits.
THANK YOU.

#BTC.DOMINANCE 2HOUR UPDATE BY CRYPTOSANDRS !!Hello dear traders, we here new so we ask you to support our ideas with your LIKE and COMMENT, also be free to ask any question in the comments, and we will try to answer for all, thank you, guys.
Hello, dear traders welcome you to this BTC .DOMINANCE 2hr chart analysis.
CHART ANALYSIS:-BTC.DOMINANCE is flag brake out and the retest uper trand line and BTC pair altcoin is bearish.
Thanks for your time, we hope our work is good for you, and you are satisfied, we wish you a good day and big profits.
THANK YOU.

#BTC.DOMINANCE BART PATTERN CREATE !!Hello dear traders, we here new so we ask you to support our ideas with your LIKE and COMMENT, also be free to ask any question in the comments, and we will try to answer for all, thank you, guys.
Hello, dear traders welcome you to this BTC.DOMINANCE 2hr chart analysis.
CHART ANALYSIS:-This Bart pattern is forming so we can expect BTC dominance from here to be a power buying opportunity for 41.60% BTC pair, we will give you a slack BTC pair coin update soon.
Thanks for your time, we hope our work is good for you, and you are satisfied, we wish you a good day and big profits.
THANK YOU.

BTC.D to 50%#BTCD
Bitcoin Dominance broke out weekly descending resistance and confirmed it as support.
last week candle was a bullish master candle and probably it will drip to half of that candle for pullback that make an opportunity for BTC to rise to $34k.
and after that BTC.D can increase to long term support around 50% that will cause more drop in BTC price.

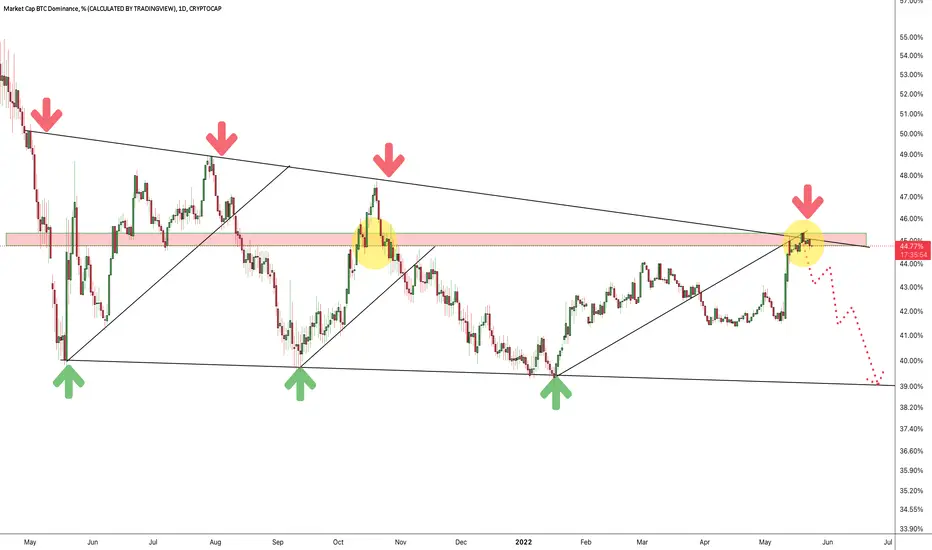
BTC Dominance - Market Update - 17.05.22Hello Traders!
If Bitcoin price goes below the current support in the $29500 - $31000 range, we should expect a continued decline in altcoins, which will lead to an increase in Bitcoin dominance.
On the chart, we see that the price value has found support near the 39.25% level and is currently approaching a breakout of the nearest resistance level of 44.50% and the local downtrend.
With significant selling pressure, we can expect an upward movement on the chart to the resistance level of 50.00% near which the MA100 on the weekly timeframe is located at the moment.
Good luck and watch out for the market
P.S. This is an educational analysis that shall not be considered financial advice

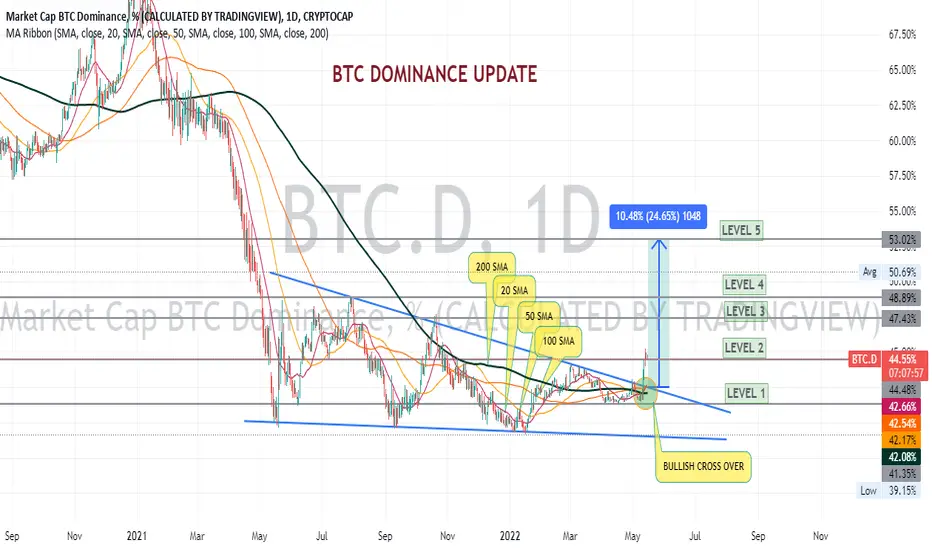
BTC DOMINANCE UPDATEHello friends,
Welcome to our BTC.D day chart.
As we are seeing in the chart how the SIMPLE MOVING AVERAGE has a bullish cross over.
And a BULLISH CHANNEL is forming in the chart.
Which is a Bullish sign.
Price is currently at Level 2.
On estimating the chart, we find that the price may increase by 10% in the coming time.
That is, the price can go from Level 2 to Level 5.
Thank You
and
God Bless You All!
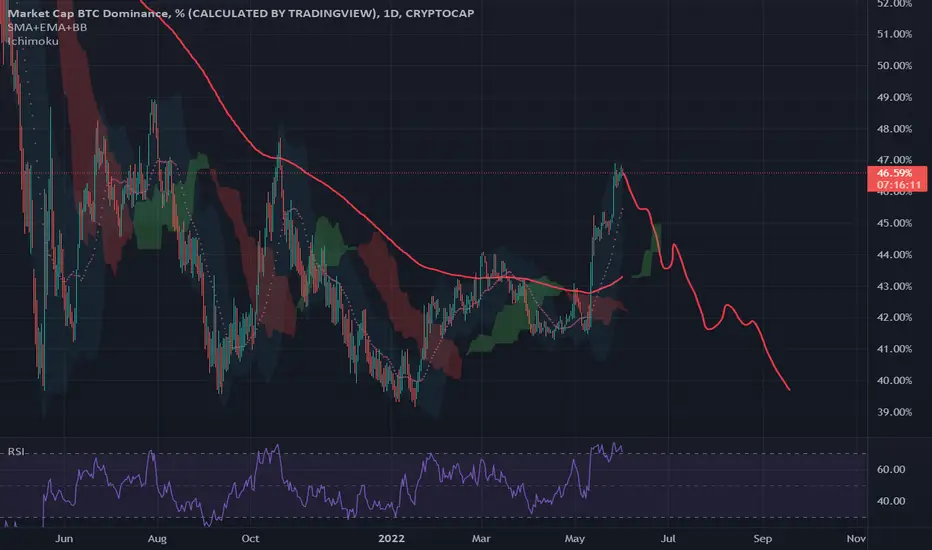
BITCOIN.DOMINANCE DAILY UPDATE BY CRYPTOSANDERS Hello, community members welcome you all to this market cap BTC.D 1D chart analysis.
As we can see from the above-mentioned chart that BTC.D war trading inside the parallel Chanel pattern.
Currently, BTC.D faces the upper trend line which is also a resistance level that BTC.D following for the last 355days.
Now here I am expecting a rejection from the resistance level and it will dump towards the middle trend line.
Which will be the green signal for BTC in the upcoming days
This is not a piece of financial advice.
Sorry for my English it is not my native language.
If you like it, hit the like button and share your charts in the comments section.
thank you..

$BTC.D Triangle still valid and playing out. So here we have 2 paths I think this might follow...
Green path illustrates the main count with E already finished and assuming we will go up soon to make wave (2) and retrace quite a bit to create a bit of havoc on the market. This has the potential to play out within the next few weeks at the most, followed by an ALT season.
The red path on the other hand assumes that E is actually A (leading diagonal) of E, and that the current retrace is B of E and that we will go higher and above the triangle diagonal. This would cause the market to to go below expectations and would cause some real FOMO selling.
I'm about 60/40 in favor of E being finished.
Safe Trades, avoid shitcoins, and remember, wave 4 never retraces into wave 1. *wink wink.
