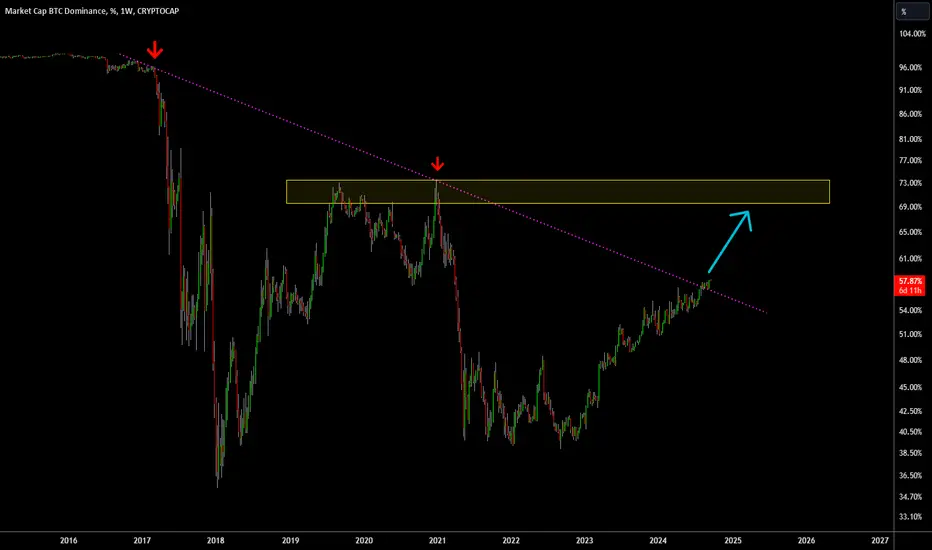
Bitcoin Dominance Update: BTC.D is about to surge to %68Bitcoin dominance has broken the main long-term resistance on the weekly and monthly charts, making it very bullish and likely to reach new highs.
In this case, we expect Bitcoin to dominate the crypto market and surpass altcoins in gains. After reaching the target of 67%, we can anticipate the alt-season to start, marking the time for altcoins to make moves.
I'm not sure if we’ll have an alt-season like before, but some altcoins are likely to experience good returns. DYOR
Btcd

BTC Dominance explained - Impact on Altcoins and Market CyclesBTC Dominance Explained 📊 – Impact on Altcoins and Market Cycles
Understanding Bitcoin dominance is crucial for navigating the crypto market, especially when planning moves with altcoins. Let’s dive into this BTC.D chart to get a clearer view of what BTC dominance signals and how it can shape your portfolio strategy.
The BTC Dominance Range and Altcoin Opportunities 🌐
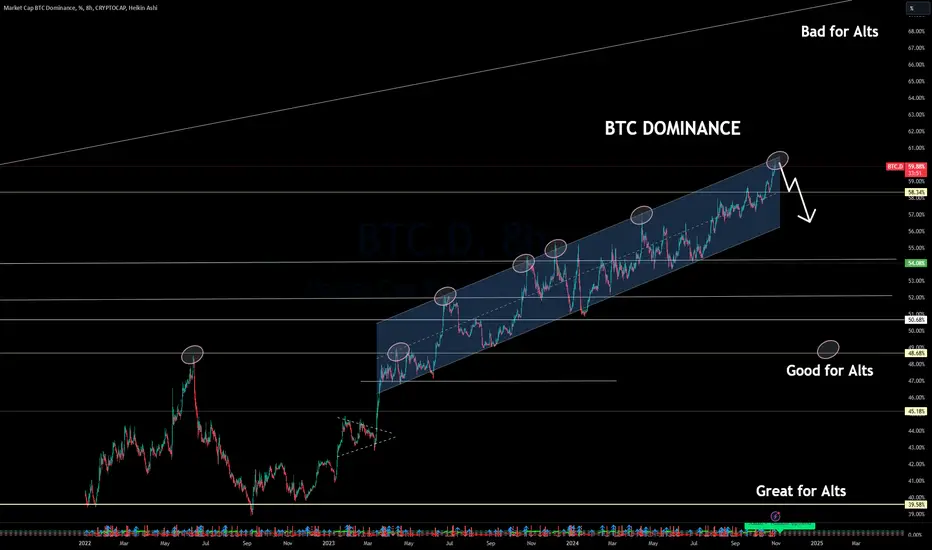
Bitcoin dominance measures BTC’s market share relative to all cryptocurrencies. Currently, we’re moving within an upward channel, nearing a significant resistance at 59%. Historically, levels above 58% have been challenging for altcoins, as a strong BTC dominance means funds flow primarily into Bitcoin rather than altcoins. The higher this percentage, the more “BTC-centric” the market becomes.
However, if BTC dominance reverses from this resistance, which the chart suggests as a possibility, it could open the door for altcoins to perform strongly. Key levels where altcoins tend to gain traction are around 54%, 50%, and ideally below 48%. Dropping to or below these levels is often where we see capital shifting into altcoins, allowing them to shine as BTC consolidates.
Why BTC Dominance Matters for Ethereum and Other Alts 🚀
As noted in my recent Ethereum analysis, a breakout for ETH could coincide with a decrease in BTC dominance. Ethereum, currently flirting with a big breakout level around $2,800, could see significant upward movement if BTC dominance declines. The fundamentals of ETH are also aligning with this technical picture, setting up a favorable environment for Ethereum to absorb some of Bitcoin’s market share.
How to Use BTC Dominance in Your Trading Strategy 📉
When BTC Dominance Rises: High BTC dominance typically signals caution for altcoin investors. When dominance is around 58% or higher, the market is likely to favor BTC over other coins. This is a “BTC season,” where Bitcoin absorbs most of the inflow, leaving altcoins with reduced momentum.
When BTC Dominance Declines: If BTC dominance drops below 54% and further towards 50%, it becomes “altcoin season,” a period where alts, especially high-cap projects like Ethereum, tend to outperform. Watch these support zones closely; they often indicate when BTC is overextended and funds may rotate into alts.
Channel Boundaries for BTC Dominance: This channel on the 8-hour BTC.D chart shows BTC dominance’s cyclical nature. Every time dominance reaches the channel’s top, altcoins often benefit if BTC reverses. Conversely, approaching the bottom of the channel can signal potential BTC strength, drawing funds away from alts.
Current Market Setup: Preparing for an Altcoin Move?
We’re at a tipping point, with BTC dominance testing upper resistance. Should we see a reversal, we could enter a favorable phase for alts, particularly Ethereum, which is primed for a breakout. The combination of Ethereum’s strong technical position and the possibility of BTC dominance declining is a powerful signal for the alt market.
By understanding and leveraging BTC dominance in your strategy, you can more effectively time your altcoin entries and exits, aligning with macro movements rather than just isolated setups. This cycle-driven approach is essential for maximizing gains across different market phases.
One Love,
The FXPROFESSOR 💙
BTC Dominance Analysis📌 Trading Instrument: 📌
🔶 BTC Dominance (BTC.D) 🔶
📝 Detailed Market Overview: 📝
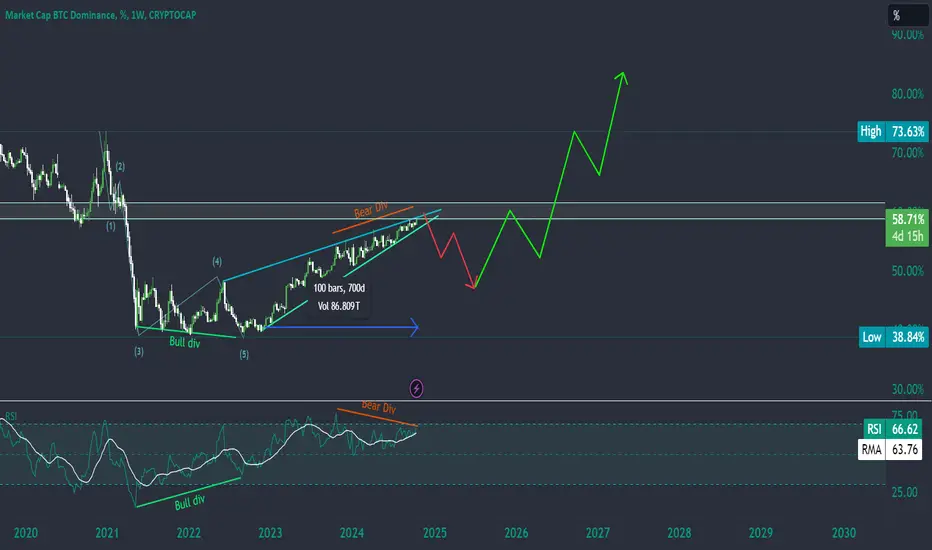
Bitcoin Dominance has reached an extremely bullish zone, nearing parabolic levels. Historically, such parabolic moves are often followed by a strong and fast correction. Currently, BTC.D is showing signs of bearish divergence, making it difficult to invalidate this signal. Additionally, BTC.D is around the 0.61-0.65 Fibonacci retracement level, a critical resistance zone.
Over the next 2-3 weeks, I anticipate a breakdown in BTC dominance. A confirmation of this will come if BTC.D breaks below the green diagonal support trendline, which has supported this uptrend for over 700 days.
Upon breaking this support, a retest of the previous key resistance, which is now expected to act as support, will likely occur around the 47-48% dominance level. This zone has not been retested since the breakout, and it aligns with the 0.5 Fibonacci retracement level. If BTC.D moves a bit higher before the rejection, this key level would coincide with the 0.61-0.65 Fibonacci zone, often referred to as the golden pocket, making it a high-probability reversal zone.
Following this correction, I expect BTC dominance to resume its upward momentum, targeting a minimum of 79-80% dominance in the longer term.
🔍 Key Signals:
Bearish divergence on multiple timeframes.
Proximity to the 0.61-0.65 Fibonacci retracement level.
A potential breakdown of the 700-day diagonal support.
🎯 Bearish Target:
47-48% dominance (retest of key support)
🚀 Bullish Outlook After Rejection:
A strong reversal after testing support could propel BTC dominance to 79-80% in the long run.
⚠️ Confirmation Needed:
Watch for a break below the green diagonal trendline to confirm the top and initiate the bearish retracement.
🚨 Disclaimer:
This is not financial advice. Always conduct your own research and trade responsibly. Markets are highly volatile, and you should only invest money you are prepared to lose.
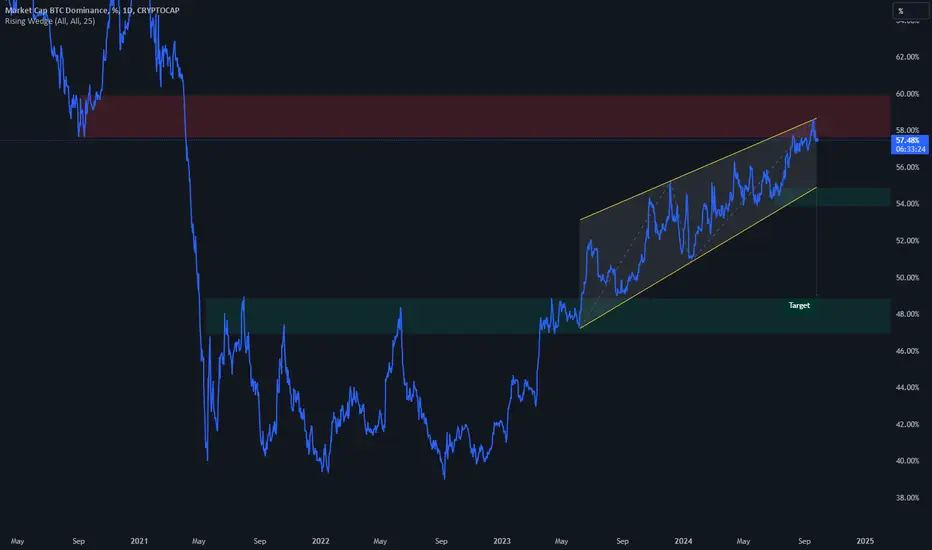
Rising Wedge Targeting Weekly SupportBTC Dominance has formed a rising wedge right into weekly resistance. If it loses local support around ~54-55%, it may drop to weekly support around 44-47-49%.
This could mean the entire market drops hard, or if Bitcoin holds up for the most part, it could instead mean a potential run for altcoins.
Bitcoin dominance breaking 59% and holding above it invalidates this idea.
USDTD important to whole crypto market ‼️ ❣️Already we are seeing present CRYPTOCAP:BTC.D is dumping with BITSTAMP:BTCUSD
Sign they money 💰 is going out 😬
Is really big player going out 😬 ??? Or manipulation before big players in 🟡📌
To get know only metric index we have CRYPTOCAP:USDT.D
above red ♥️ box day close 📌 whole market dump comfirm 👍
BINANCE:BTCUSDT won't go new low 🔅 instead test FWB:25K below 📍 ALTS will make new low 🔅
Below yellow 🟡 box day close 📌 present dump is nothing but manipulation ⚡
BITSTAMP:BTCUSD pump & CRYPTOCAP:BTC.D is important role for alts then
If USDTD reach 9% just BUY #BTC
If USDTD reach below yellow 💛 box meanwhile BTCD also dumping buy alts if pump 📌 sell alts
Understand index with market is very important ☺️
I already made CRYPTOCAP:BTC.D chart 📉 analysis ⏰ when to buy alts once I got cleared view i will update under that post ⁉️ this CRYPTOCAP:USDT.D is important only for BITSTAMP:BTCUSD

Sell Signal For Bitcoin DominanceOn Friday, my indicator combo gave us a big old SELL, meaning dominance by Bitcoin is about to dump. This does not mean the price of BTC will drop. In fact, it could continue to rise.
What it signals is that the altcoin market is about to 🚀🚀🚀! Therefore, if Bitcoin rises, Altcoins will rise even faster. Get ready! The rocket ship is about to launch for alts. Bull run incoming.

BTC DOMINANCE / BTC.DI think #BTC.D is done>>
Good Luck >>
• Warning •
Any deal I share does not mean that I am forcing you to enter into it, you enter in with your full risk, because I'll not gain any profits with you in the end.
The risk management of the position must comply with the stop loss.
(I am not sharing financial or investment advice, you should do your own research for your money.)
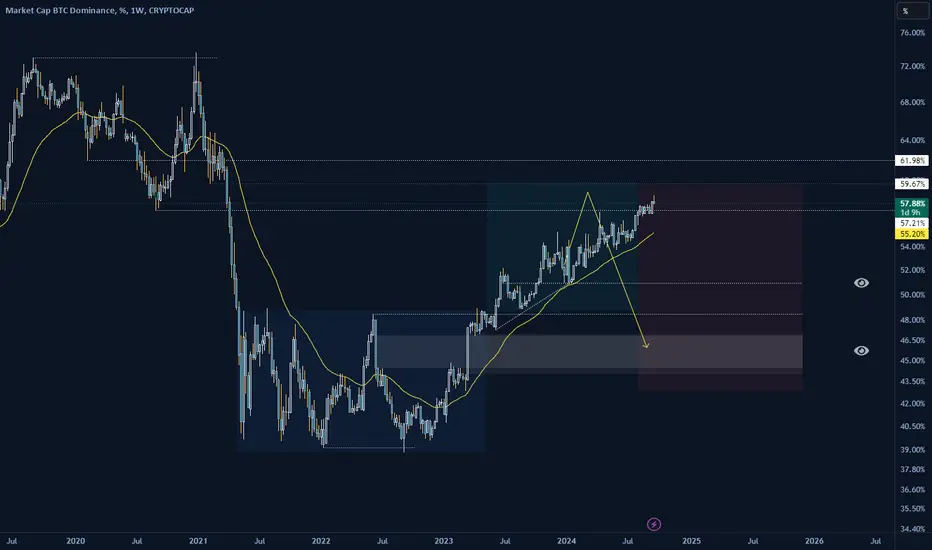
BTC.D is going where I thoughtTHere isn't much to say beside BTC dominance is going up to that resistance between 60% and 62% as I anticipated many months ago. It's likely we'll still have some bleeding for altcoins but as soon as BTC.D will reach that level I expect it to range close there after a rejection and follow the scheme you can see here
Just keep buying what you like, altseason is close!
Good luck!

Bitcoin Dominance Keeps Rising: Alts Will Keep Getting Rekt!Most altcoins have been underperforming BTC by quite a big margin over the last ~2 years. If you look at most alts, they are edging around the bear-market lows or trading slightly above it. A far cry from BTC's ~4x above the bear market low.
The result of BTC's overperformance is the sharp rise in Bitcoin Dominance (BTC.D).
As of last week, BTC.D has made a new high this cycle. With the risk of a recession increasing, there's a high probability that Bitcoin is going to be the investment of choice for crypto holders (apart from stablecoins).
My assumption is that the BTC.D will continue to rise towards the yellow area, potentially even higher if the recession actually hits.
Alts are prone to lose against BTC, and are likely to keep losing value against BTC for the foreseeable future. On the other hand, if the BTC.D keeps rising it will also come down at some point and cause a massive alt season.
Patience is key.
Bitcoin FULL Analysis PART 2In a previous analysis, I discussed the relationship between Bitcoin, the Altcoin market and Bitcoin Dominance.
An important rotation exists between these three; and by using TOTAL3 together with BTC.D, you can get a clearer picture of where BTC is trading in the current cycle.
In this video, I make an important suggestion based off Elliot Wave Theory. This theory is backed up by the points mentioned but also by the Logarithmic view:
From the log scale, we can see BTC is still trading relatively low compared to previous cycle top-outs. So the question remains - the end... or just the beginning?
________________________________________
COINBASE:BTCUSD BINANCE:BTCUSDT CRYPTOCAP:TOTAL3 CRYPTOCAP:BTC.D

WEN ALTSEASON?Let's start with #BTC.D
Short time frame
potential double top
with a head & shoulders on the RSI
Log tgt provided if this were to trigger and start breaking down.
BTC : Spot the DIFFERENCE - Why THIS TIME is DIFFERENTYesterday, I made a very comprehensive update on why BTC likely has a hard drop coming - the only problem is it published the video on the BTC.D chart 🥴 So, you've likely missed it and I will repeat it here today because it's a VERY clear signal.
Altcoin dump happened BETWEEN the first turquoise and the purple vertical line, from halfway onwards:
Up until this point BTC did correct, but only around -27%. (BTC has currently corrected -33%)
The price THEN went on to drop another -20% before bottoming out at point 4 on the Elliot Wave Theory:
RECAP: What happened AFTER the 27% drop that led to another hard drop, ending at -50%? The BTC.D started INCREASING whilst BTC price DECREASED and TOTAL3 DECREASED .
Now look at the chart again, again at point 3 of Elliot Wave Theory (the second turquoise vertical line). In other words - we're still waiting to reach point 4.
The in-depth explanation here:
______________________________________
CRYPTOCAP:BTC.D CRYPTOCAP:TOTAL3 COINBASE:BTCUSD COINBASE:BTCUSDT

BTC : HARD DROP Likely BEFORE New ATHHold on to your horses - in today's analysis we're going to do a really deep dive on Bitcoin, the altcoin market (TOTAL 3) and Bitcoin Dominance (BTC.D) Make sure you watch all the way until the end to reach the final conclusion!
In this video, I systematically point out two main reasons why the corrective phase isn't over, as well as what could possible happen NEXT based on the rotations between alts and BTC.
COINBASE:BTCUSD COINBASE:BTCUSDT CRYPTOCAP:BTC CRYPTOCAP:TOTAL3 CRYPTOCAP:BTC.D
For months I've been anticipating a multi-month corrective pattern, before another impulse wave up which I believe leads us to our final all time high (ATH) for this bullish cycle. Although I've said "multi-month" quite a few times... who knew it would be such a drag! I nearly thought BTC was ready to turn towards the upside, but after THIS* happened (together with the analysis in the video) it's likely we're still heading lower:
*https://tradingview.sweetlogin.com/chart/BTCUSD/h2bMes4J-BTC-FINALLY-Bullish-BREAKOUT/
THIS* is referring to my update on BTC two days ago, where it seemed like a bullish breakout. At this point however, the price is not able to hold the support zone (which was the condition I listed) and therefore it's likely a fakeout.
If you're looking for the idea I referred to in the analysis on the Altcoin dump find it here:👇
_________________________________

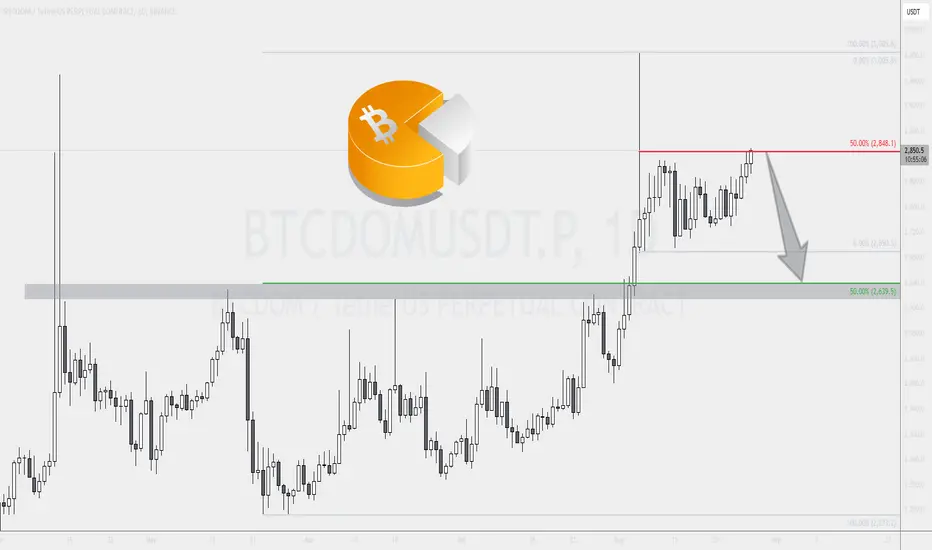
Altcoin Season Approaching? BTC Dominance Signals Major Shift!Yesterday, Bitcoin Dominance (BTCD) tested the 50% Fibonacci resistance level at 2,848, resulting in a significant daily bounce off this key level. Today, BTCD is attempting to break higher. However, if the daily close remains below this resistance, we anticipate a sharp decline.
In this scenario, Bitcoin Dominance could experience a substantial pullback, potentially targeting the 50% Fibonacci support area near 2,600. This support level not only aligns with Fibonacci analysis but also corresponds to a previous resistance zone, indicating strong market activity at this point.
If this bearish scenario unfolds, it may signal the onset of a robust Altcoin Season. Traders should prepare for the opportunities that may arise during this period!
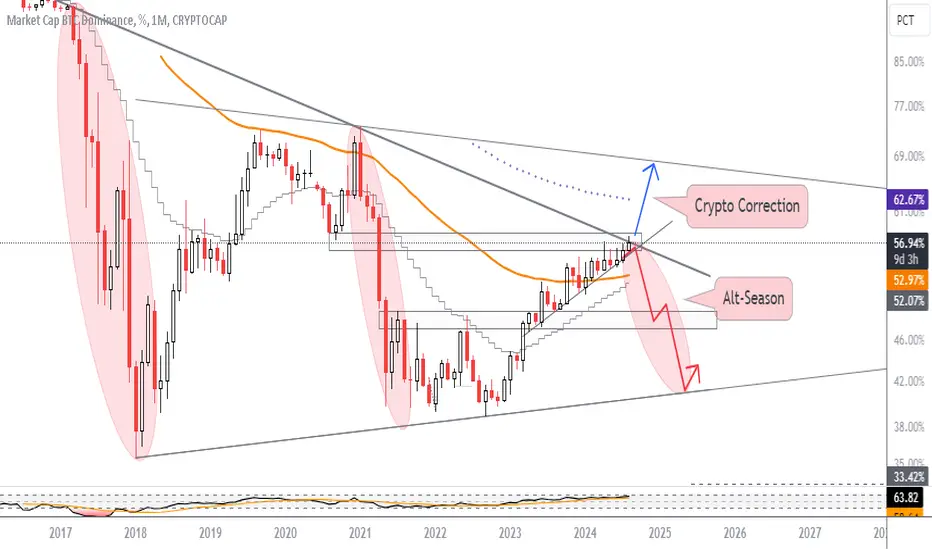
Bitcoin Dominance Update: Potential Market Dump!The Bitcoin Dominance chart has just reached a key resistance level, which is expected to trigger a rejection and initiate alt-season. However, given the market's volatility and technical structure, another short-term bearish scenario is also anticipated. In this scenario, BTC dominance could spike up to 67% over the next two months, potentially until November-December 2024. On the other hand, if the resistance level is rejected, we can expect a market pump accompanied by a strong alt-season. DYOR
Bitcoin dominance resistanceWill there be an alt season. I think it will happen. When? No idea. But it seems the BTC.D has reached serious resistance at this point. Let's see how this develops and what this will mean for the alts..

Is #Bitcoin Dominance falling down?#Bitcoin Dominance 1W chart;
I would like to start by telling you that I have some good news
As I mentioned in the previous chart, 58.25% and then the OB resistance level of 62% are important.
I think it will have much more positive effects if it reaches 62% because it will weaken the resistance at this level.
This is the level that will help us in the next bull cycle. That's why I care about it.
Now for the good news...
As can be seen on the weekly chart, the RSI seems to have begun to mismatch.
After a fake out to the resistance level at 58.25%, I think that it will ease down for the initial target of the pattern.
After the 50% level is seen, I expect it to start a rise again and to turn its direction down as it tests the OB level, which is the second resistance while completing this pattern.

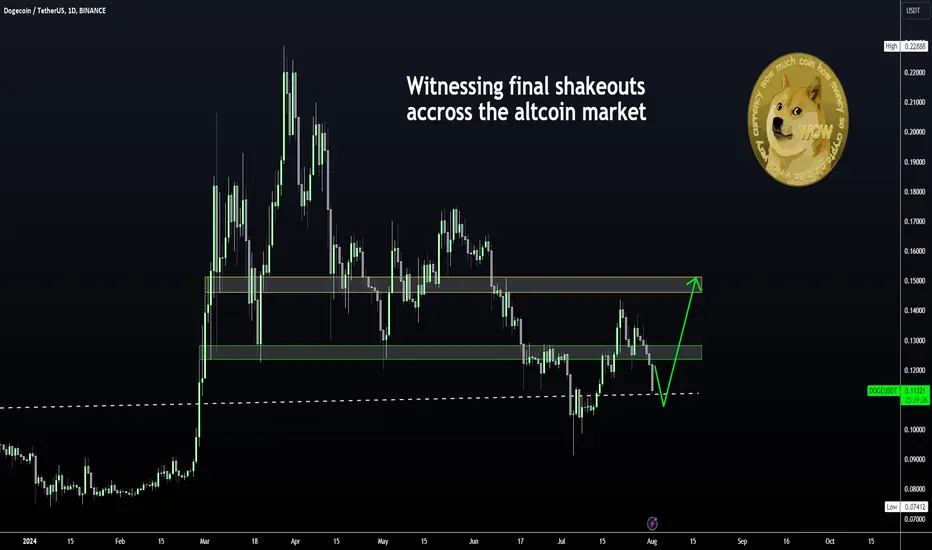
BULLISH Altcoins NOW: Final SHAKEOUT CompilationWe're seeing what could be the final shakeout across the entire altcoin market. This drain of liquidity will likely go into Bitcoin to propel the next impulse wave up, after which the money rotates BACK into alts for Altseason2.0.
We're spotting multiple bottom patterns across the altcoin markets such as inverse head and shoulders and W-bottom patterns.
1) FLOW
2) RNDR
3) SOLANA
4) LINK
5) ETH
__________________________________
I'll keep adding to the list over the next few days as there are MANY more. FOLLOW for alerts!
Bitcoin All Time High NOT PRICED IN YETFor weeks now, I've been talking about why the all time high for Bitcoin is NOT YET in. (Proof here)
Here are the main reasons why.
👉 Elliot Wave Theory
I've been discussing EWT for many weeks alongside with the bearish M-Pattern that marked the beginning of the corrective wave (3-4). Once the corrective wave finishes, which I expected to be a multi-month playout, the final impulse wave up awaits us (4-5).
👉 Bitcoin-Dominance Increasing & ALTS Bottom
Considering MANY alts have seen bottom patterns after corrections (as discussed in the video), its safe to say the dump is over. But BTC.D is still increasing... If you want to further understand WHY this is a good sign, see HERE:
_____________________________
KUCOIN:BTCUSDT CRYPTOCAP:TOTAL3

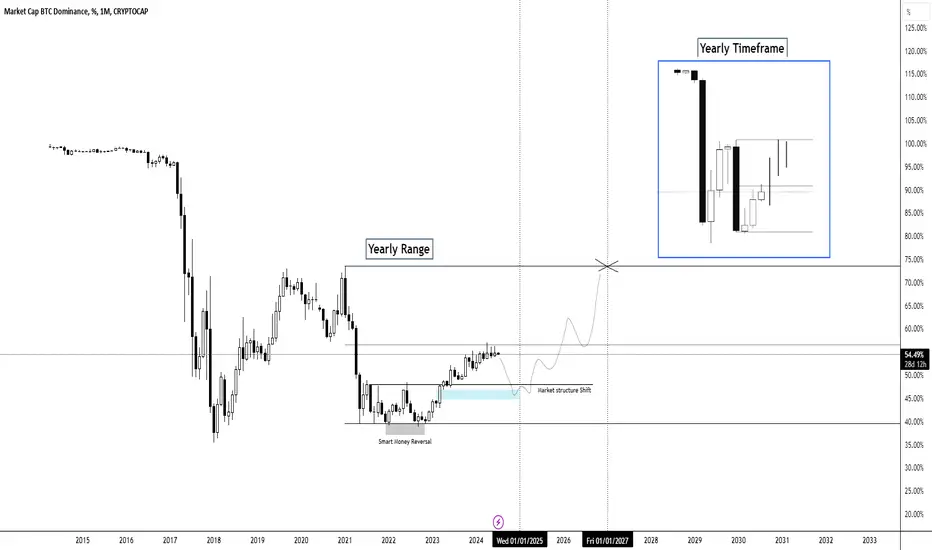
BTC.D looking to decrease -> Altcoin Run until the end of 2024- Yearly range provided a reversal point with a clean market strcuture shift to the uspide, which price bounced off from to the 50% of the range.
In range trading we call this take profit nr 1.
- Price now usually bounces off a bit from the 50% (which price is currently at) into a FVG (marked in blue) / support level targetting the high of the range.
With the expectation to drop into the fvg, altcoins should witness a push to the upside until the end of the year 2024.
Afterwards we are expecting a rapid upmove of BTC.D to target 2 until the year of 2027, which would result in altcoins bleeding out.
This idea gives us a great confluence with the TOTAL3 chart analysis, which we published before. You should have a look at this as well.
(tradingview.sweetlogin.com)
#BTCDOMUSDT #1D (Binance Futures) Ascending trendline breakdownBitcoin Dominance is pulling back towards 50MA resistance on daily, seems likely to get rejected next.
⚡️⚡️ #BTCDOM/USDT ⚡️⚡️
Exchanges: Binance Futures
Signal Type: Regular (Short)
Leverage: Isolated (6.0X)
Amount: 6.0%
Current Price:
2374.2
Entry Targets:
1) 2411.5
Take-Profit Targets:
1) 2010.3
Stop Targets:
1) 2612.6
Published By: @Zblaba
BINANCE:BTCDOMUSDT.P CRYPTOCAP:BTC.D #Bitcoin #Dominance #Index
Risk/Reward= 1:2.0
Expected Profit= +99.8%
Possible Loss= -50.0%

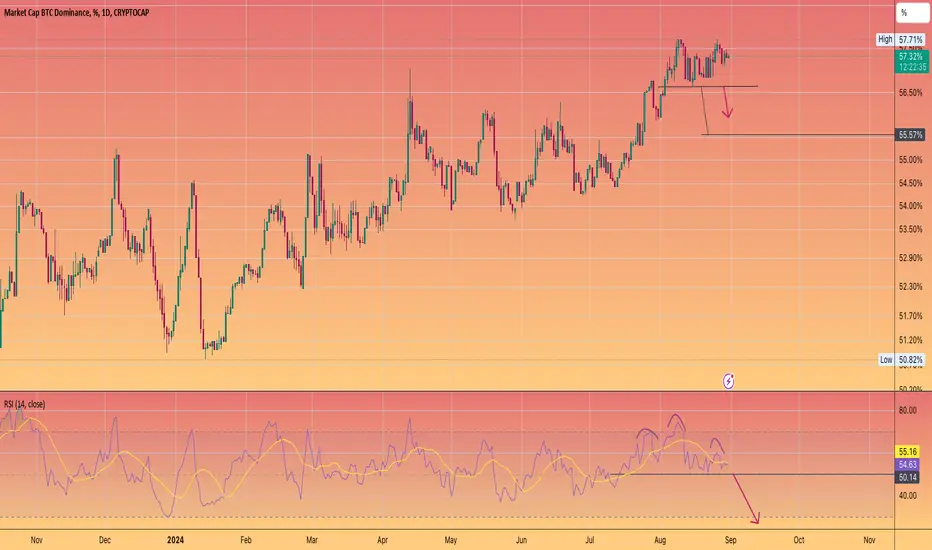
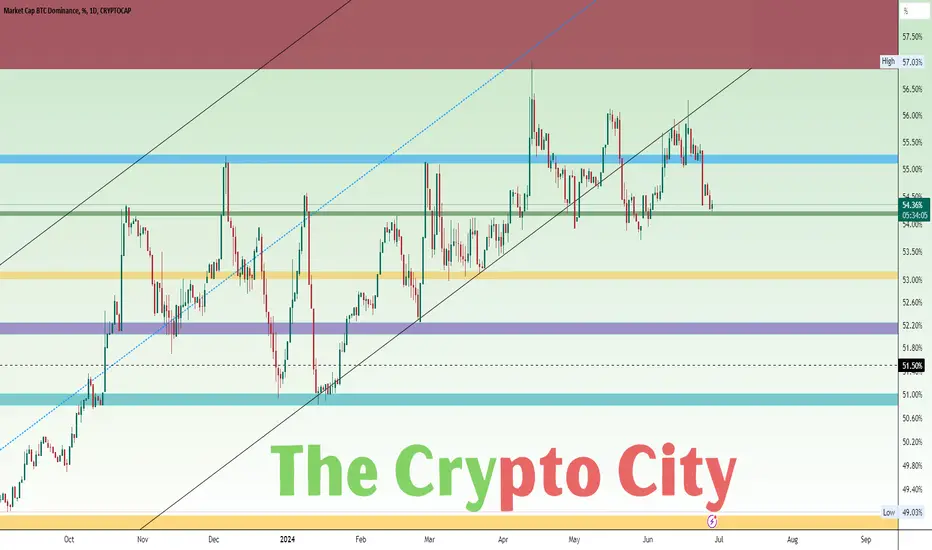
Bitcoin Dominance UpdateBTC.D was rejected from the channel's trend line and consolidated above the 55% zone (blue). It then broke down and found support at the 54% zone (green).
If BTC.D falls below this 54% support, it could drop to the 53% zone (yellow), which would be positive for altcoins, as a lower BTC dominance usually benefits them.
However, if BTC.D bounced back from the 54% zone back to the 55% zone, it would be very bad for altcoins, as previously BTC.D bounced many times from this zone. Increase in dominance causing further declines in the altcoin market.
BTC.D - KEY LEVELS FOR THE NEXT ALT SEASON (MAY 2024)BTC.D - KEY LEVELS FOR THE NEXT ALT SEASON (MAY 2024)
When can we expect the next Alt season? It's been a long time since the last one. For a potential Alt season to occur, we need to break through the critical 54% level. If that doesn't happen, then the 58% level has the potential to trigger this scenario.
