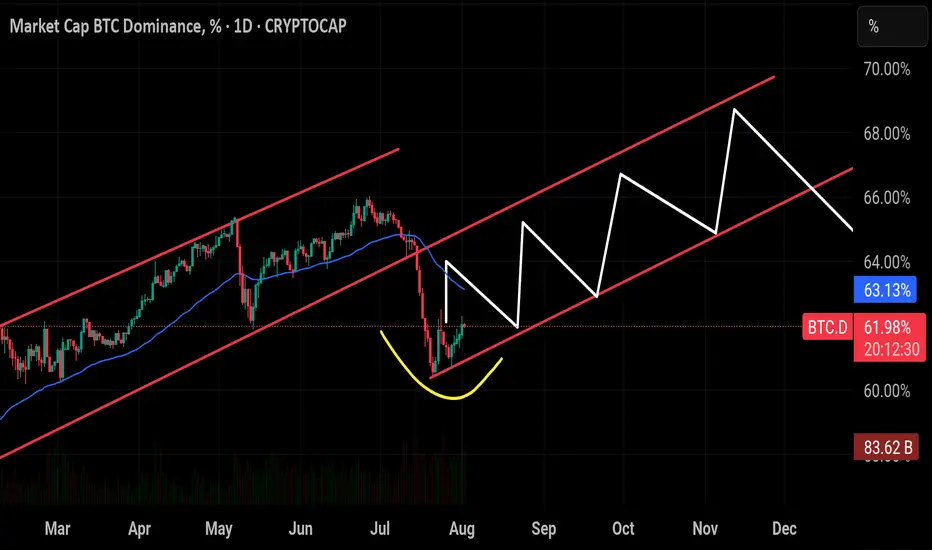
$BTC Dominance seems to be replaying its historical pattern —CRYPTOCAP:BTC Dominance seems to be replaying its historical pattern — after peaking around 66%, it’s now pulling back toward the critical 60% support zone. If the breaks below this level have triggered sharp drops toward 54%, often marking the start of strong altcoin seasons. Unless BTC.D closes back above 65%–66%, history suggests we could see another wave of altcoin outperformance in the weeks ahead. And looking at the chart structure, a breakout in BTC’s price action could align with this cycle, potentially driving Bitcoin toward a new all-time high soon.
Btcdominance
BTC DOMINANCE UPDATE- So, all elements are annotated throughout the graphic, like always.
- Timeline.
- Older Top Dom (2021) (red doted line).
- New Top Dom (2025) (red line).
- Some supports ( Orange Line ).
- Some Bottoms ( Green Lines ).
- Most important in chart : Fibonnacci Retracements.
- After this chart, I’ll drop links to my older BTC dominance posts.
- Not much to say, just look at the chart :
- In 2021, BTC.D formed a double top because Bitcoin spiked twice and hit two all-time highs.
- That doesn’t mean BTC.D will behave the same way in 2025. I don't expect another double top, but who knows.
- We could see a retracement down to the 45–47% range. That would likely signal the start of a new bear market.
- For now, i don’t see the end of the bull run yet. I’m mostly waiting for a strong BTC push in price, a fast dip in BTC Dominance, and the kickoff of Altseason.
— it’s going to be wild and fast! Just my personal opinion.
Stay Safe !
Happy Tr4Ding !

BTCDOM : Near to breakout from trendline resistanceBitcoin dominance is nearing a breakout from trend line resistance. Keep a close watch as a breakout from here could lead to a short-term market correction, negatively affecting altcoins. Stay cautious with your long positions and use proper stop loss strategies.
KEEP A CLOSE WATCH ON IT
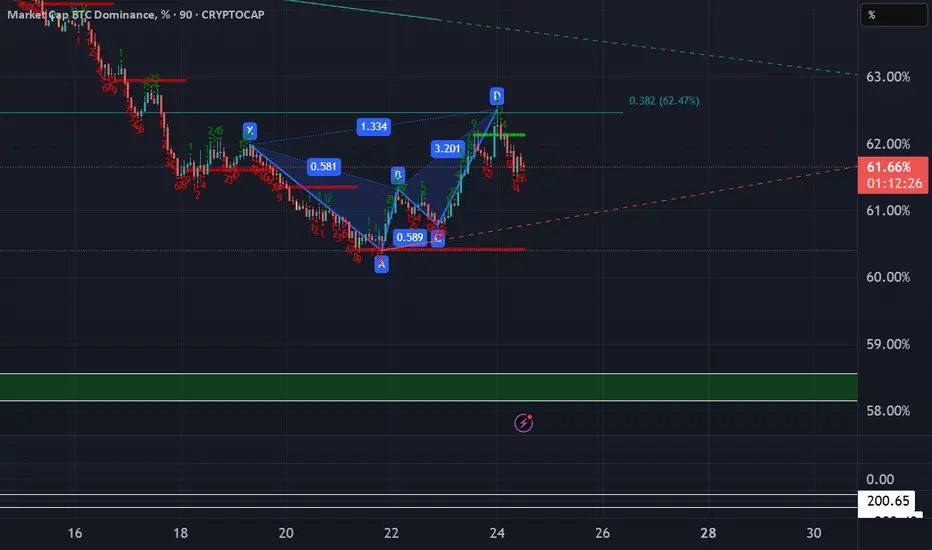
Is Alt Season Underway?CRYPTOCAP:BTC.D | 6h
We're approaching the monthly close, and many are eyeing a potential breakdown in Bitcoin dominance — a key trigger for altcoin season.
On the mid-term chart, BTC dominance held support at 60.43% and recently retested the 60.65% base.
A sustained drop below 61.20% would favor altcoins. But if dominance accepts above 62%, it opens the door to a move toward 63.3%–63.8% level, likely putting pressure on alts.

BTC.D FIB Lvl RejectionI'm liking the recent pullback in Bitcoin dominance - we're finally getting a taste of those altcoin gains we last saw around December. Each time dominance hits a key level on the Fibonacci retracement, we tend to see a pullback, and this recent rejection near the 0.786 level is no exception. It's a recurring pattern worth keeping an eye on.
That said, I still believe there’s a chance for one final rally in Bitcoin dominance - a potential shakeout before the real altseason begins. Historically, when Bitcoin breaks out of consolidation and pushes to new all-time highs with strong displacement, dominance tends to dip shortly after. So if BTCUSD continues to range at these current levels, I wouldn’t be surprised to see dominance spike again before we get the real altcoin momentum everyone’s waiting for.
This can also relate to what I've been reviewing in my previous charts published on my page
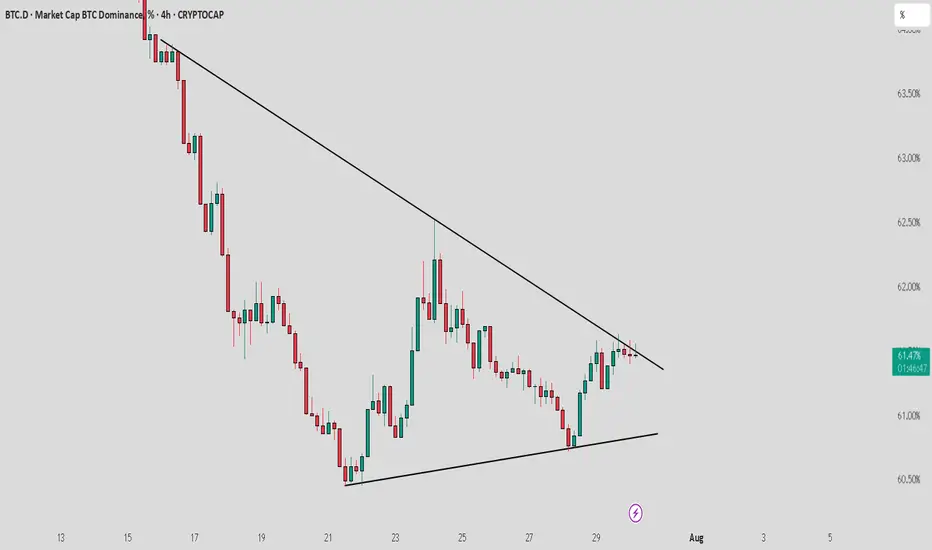
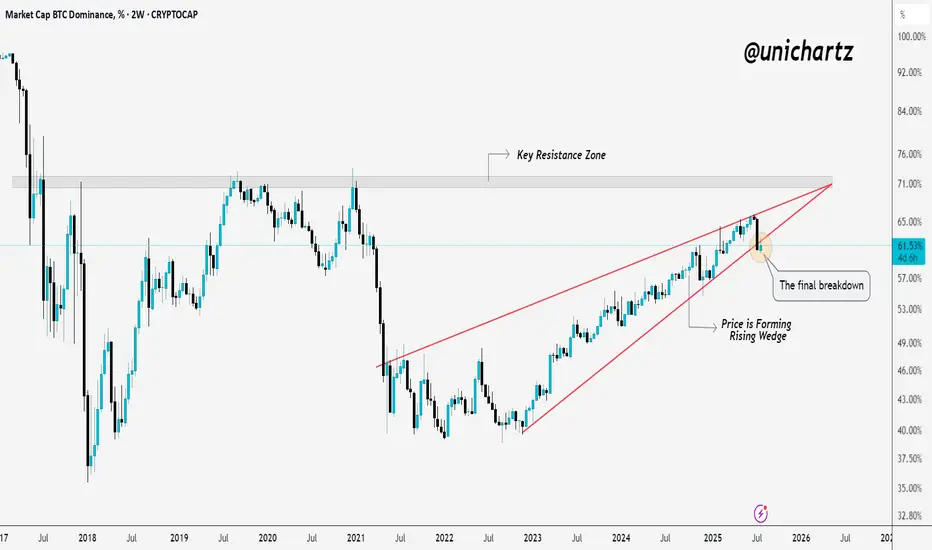
Final Breakdown from Rising Wedge – Alts About to Run?BTC dominance has been rising steadily inside a rising wedge, but now it looks like the structure is giving up.
Price just broke below the wedge, a move many traders watch as a potential shift in momentum.
If this breakdown holds, it could be the final breakdown before altcoins start gaining serious strength.
Eyes on alts, the rotation might be starting.
Bitcoin Dominance Still Bearish · Bullish Altcoins ContinuesThe Bitcoin Dominance Index will continue bearish as long as the action happens below resistance as shown on the chart.
An uptrend has been broken with the highest volume in a single session since February 2021. When this same signaled showed up back in Feb. 2021, what follows was a major drop (a marketwide bull-run.).
Seeing Bitcoin Dominance in the same situation as in early 2021 predicts the start of the 2025 bull market phase. This is all to say that the Altcoins market will continue to grow; Bitcoin will continue to consolidate to end up moving higher; the altcoins will resume growing within days.
The chart supports only little time for a break before the next bearish continuation, it should happen within days. At this point, the altcoins will rally up. We are very close and indeed we are already in-the-action. These short retraces should be used as opportunity to rebuy and reload.
Namaste.
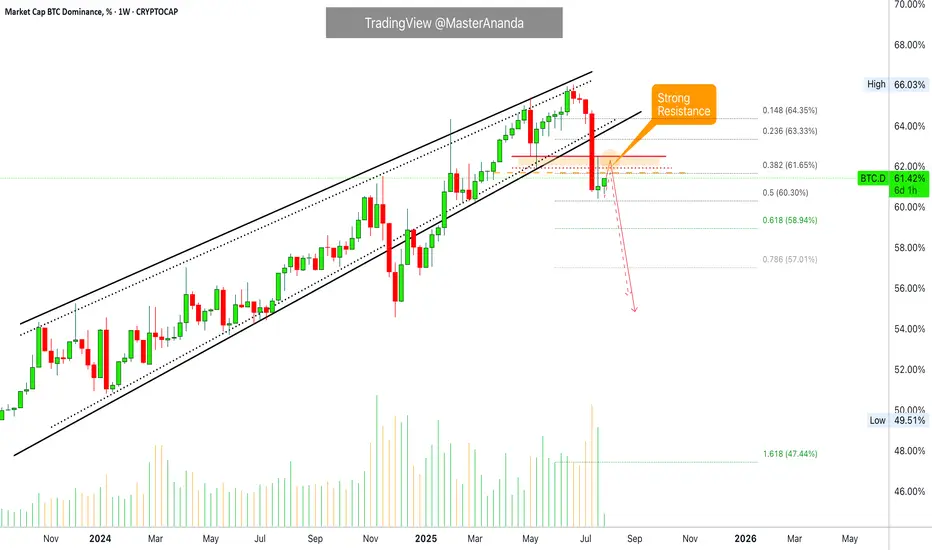
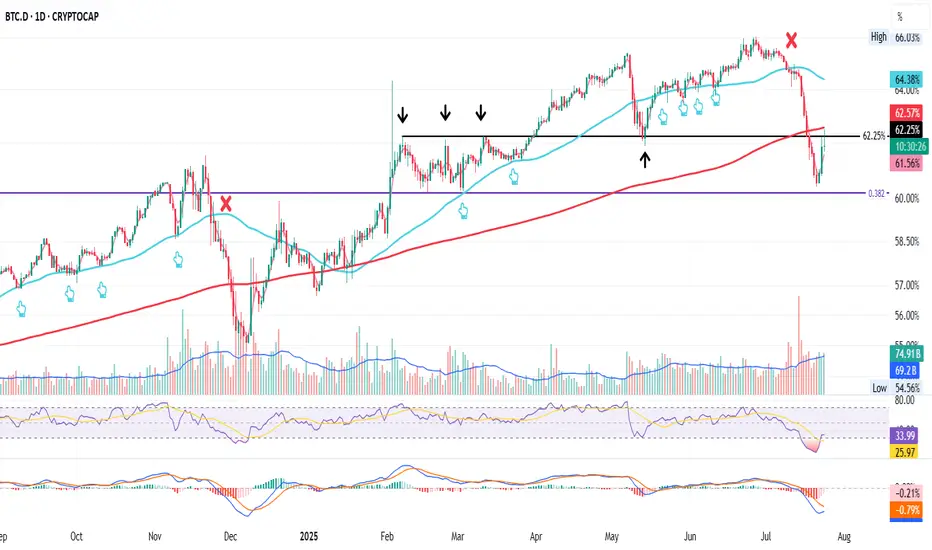
BTC.D Stuck in the MiddleThis is BTC.D on the daily
After losing the 50MA in the final days of the first half of the month, BTC dominance found support at the 0.382 Fib level, only to bounce back up and get rejected at 62.25%.
From here, it all depends on which level breaks first: the 0.382 support or the 62.25% resistance.
Whichever way it goes, we’ll be here to watch it unfold.
Always take profits and manage risk.
Interaction is welcome.

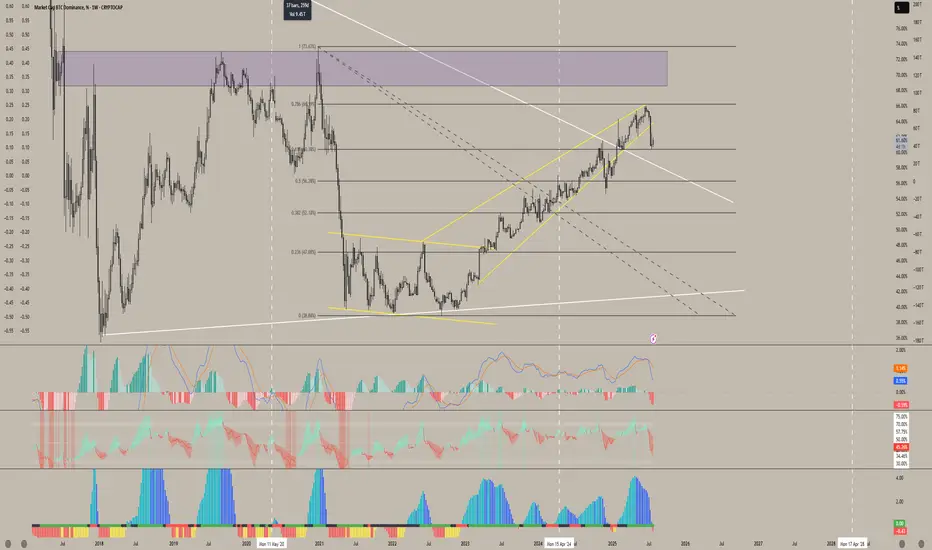
$BTC.D: Cycle tops are in. $ETH.D: Bounce form the all-time lowsIn my opinion the most important chart in all Crypto is the $BTC.D. We have been writing and observing CRYPTOCAP:BTC.D for almost 6 months. I predicted here that we will see CRYPTOCAP:BTC dominance @ 66% before the end of this cycle. And we saw CRYPTOCAP:BTC.D touch 65.9% on June 23 as visible from the weekly chart, which is close to our cycle target of 66%. See my blog from April 14.
CRYPTOCAP:BTC.D to 66%, CRYPTOCAP:TOTAL2 / BTC down to 0.43 for CRYPTOCAP:BTC.D by RabishankarBiswal — TradingView
But since then, CRYPTOCAP:BTC.D is going through reversal. Currently @ 61% the dominance has tumbled in July. Even if CRYPTOCAP:BTC is holding on to its ATH with price near to 118K $ the dominance is clearly in a downtrend.
But then we see something which CRYPTOCAP:ETH.D has not done since 2019. In the chart below we have super imposed the CRYPTOCAP:ETH dominance on the CRYPTOCAP:BTC Dominance. CRYPTOCAP:ETH Dominance as the name suggests is the % of Crypto Market Cap that can be attributed to $ETH. The CRYPTOCAP:ETH.D double bottomed in 2019 @ 8% and then went on for a reversal with CRYPTOCAP:ETH.D peaking @ 22% on Nov 21. Both the Dominance charts have an inverse correlation but have one thing in common. The trend in the Dominance charts is lower. In each cycle the CRYPTOCAP:BTC.D makes a lower low peaking at 95% in 2017 cycle, 73.5% in last cycle and 66% in this cycle. The same is true for CRYPTOCAP:ETH.D , starting @ 26% in 2017, 21.5% in the last cycle. So, the obvious question in your mind is where will the CRYPTOCAP:ETH.D peak this cycle. If we draw the downward slopping wedge in the CRYPTOCAP:ETH.D and assume the cycle end by Dec 2025, then we can see the CRYPTOCAP:ETH.D will peak around 17% in this cycle. Currently at 12%, I am predicting another 40% upside form here. Pricewise BITSTAMP:ETHUSD may give a higher return than the $ETH.D.
Verdict: CRYPTOCAP:BTC.D top for this cycle is 66%. CRYPTOCAP:ETH.D can top @ 17% this cycle. BITSTAMP:ETHUSD can double from here for CRYPTOCAP:ETH.D to top @ 17%.

Mastering XRP Structure with Bitcoin Dominance - (Hedge is Edge)📉📊 Mastering XRP Structure with Bitcoin Dominance - Educational Breakdown 🧠💡
Hey traders! FXPROFESSOR here 👨🏫
From now on, my TradingView Crypto posts will be 100% educational only . I won’t be sharing target charts or trade setups here anymore. Why? Because even with the best chart, most traders still struggle to execute properly. So instead, I’ll teach you how to think, read, and act like a real trader.
👉Let’s jump into today’s educational case:
🔍 Chart 1: XRP/BTC
We're facing a clear resistance zone around 0.00002780, rejecting after several tests. There’s also a wedge pattern forming, suggesting a drop is likely — possibly toward 0.00002690 or even further to the unchecked support at 0.00002469. That’s a 9.4% move — but remember, this becomes invalidated if XRP breaks back above 0.00002780.
🔍 Chart 2: Bitcoin Dominance
Dominance is sitting right on support. If BTC dominance rises, it means Bitcoin could gain strength relative to altcoins. This typically leads to:
BTC holding steady or rising
Some major Alts (like XRP) might correct
Watch this carefully — a BTC dominance rebound strengthens the XRP short thesis.
🔍 Chart 3: XRP/USD
XRP/USD is moving inside a large wedge formation. The current rejection level is around $3.34, with price possibly aiming for $2.88 or lower if the wedge plays out. Until we break above that resistance, the bias remains bearish.
🎯 Strategy Insight – The Hedge
What’s a calculated way to play this setup?
→ Go long Bitcoin (dominance at support)
→ Go short XRP (at resistance)
This way, you hedge your exposure while staying aligned with market structure. This is not financial advice — but a great exercise in developing strategic thinking.
📌 Remember: Managing the position is a whole different skill — one that you must learn through real-time practice and proper mentorship. But the charts today give you valuable food for thought to sharpen your edge.
Let’s stop gambling and start thinking like traders. No hype. No signals. Just structure, context, and logic.
One Love,
The FX PROFESSOR 💙
Disclosure: I am happy to be part of the Trade Nation's Influencer program and receive a monthly fee for using their TradingView charts in my analysis. Awesome broker, where the trader really comes first! 🌟🤝📈

Bitcoin Dominance Topping Out? Bitcoin dominance ( CRYPTOCAP:BTC.D ) may be hitting a cycle top, signaling a potential major shift in capital rotation across the crypto markets.
Historically, when Bitcoin dominance peaks, we tend to see:
🔄 A rotation of capital into altcoins
🚀 Explosive rallies in ETH, SOL, and mid-cap alts
💰 Increased retail speculation and trading volume across DeFi and meme coins
Previous cycle tops in BTC dominance (e.g., 2017, 2021) preceded major altcoin seasons, with dominance falling sharply while total crypto market cap continued to grow.
⚠️ A rejection at key resistance (like the 200-week MA or golden fib levels) could confirm a reversal, hinting that altseason is around the corner.
💡 Keep an eye on:
ETH/BTC breakout potential
Total3 (crypto excluding BTC & ETH) trends
Risk-on sentiment and social metrics
Will history repeat? Or is this cycle different?
📈 Chart shows confluence of horizontal resistance, weakening RSI, and declining momentum on BTC.D.
Not financial advice. Always DYOR. Use proper risk management.

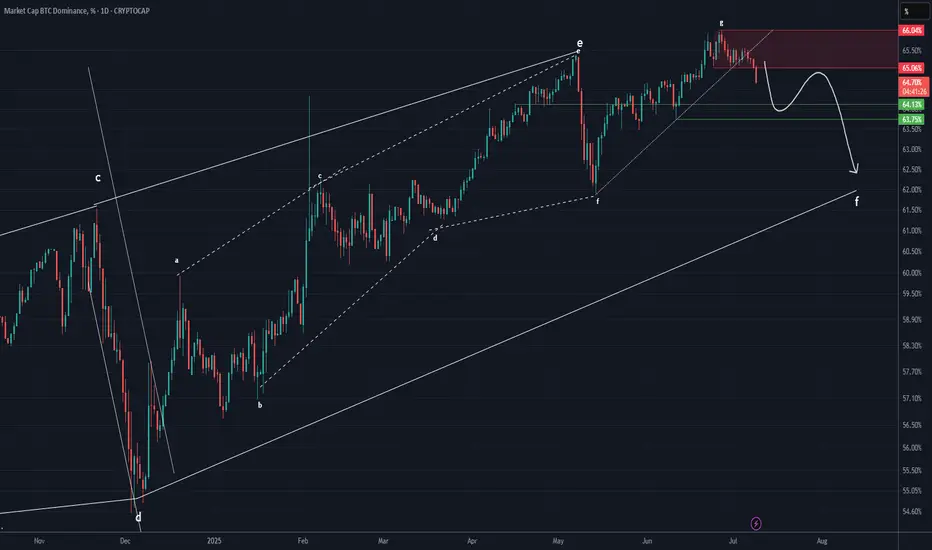
BTC DOMINANCE Update (1D)It seems that Bitcoin dominance may soon experience upward corrections, as it has broken through several support zones to the downside without any reaction and is now close to another support area. Usually, when the market maker pushes the price through multiple supports without a reaction, the price can retrace from a nearby support.
The price may soon move to complete wave G.
We have considered two different scenarios for the fluctuations of this index. However, note that this chart is a derivative chart, and the fluctuations may not follow the schematic exactly, but this analysis gives us a good view of the support and resistance zones and the probable path.
For risk management, please don't forget stop loss and capital management
Comment if you have any questions
Thank You

BTC DOMINANCE Looks Bearish (1D)Bitcoin Dominance seems to have completed its bullish structure.
An order block is forming and has been broken to the downside, a trigger line has been lost, and wave g has come to an end.
If Tether dominance also declines, altcoins may remain in the green.
The 62 level is the target drop zone for this index.
For risk management, please don't forget stop loss and capital management
Comment if you have any questions
Thank You
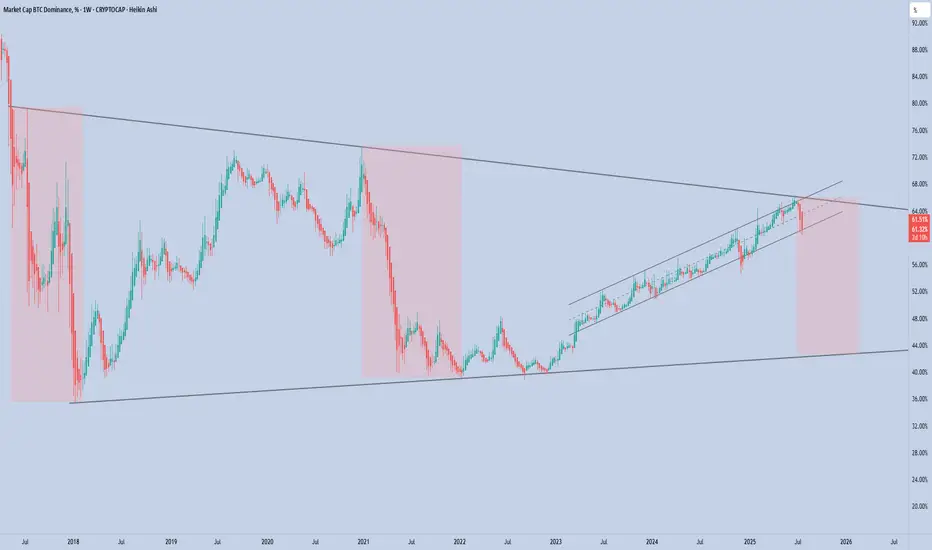
The End of the Altcoins Bull Market? BTC.D Turns Bullish?Bitcoin Dominance produced a bullish trend that was more than 1,000 days long. While this was a major development, the action never happened just straight up. There were always fluctuations.
Bitcoin Dominance broke out of a major rising wedge pattern. A pattern that lasted years in the making.
Recently, Bitcoin Dominance produced the highest bearish volume since 2021. A strong chart signal.
The major breakdown following the multiple years long uptrend signals the start of a change of trend. A downtrend. This downtrend is extremely bullish for the altcoins market because BTC.D only goes down when the altcoins are going up and doing so faster than Bitcoin.
What we are seeing now is an inverted correction, a pullback. Simply put, BTC.D already made a strong drop and it needs some relief. This relief is not the end. Bitcoin Dominance can move just a little higher to later resume its newly developing downtrend. Which means that the altcoins market bull market has not reached its end, it is only getting started.
Thank you for reading.
Namaste.

Bitcoin Dominance – Critical Breakdown on the Horizon
Bitcoin dominance is currently testing a major long-term resistance zone formed by the upper boundary of a multi-year wedge. After months of steady climb, the structure is now showing the first signs of exhaustion
If dominance loses the key 60% support zone, that would mark a major structural shift — historically followed by downtrends in dominance and strong capital rotation into altcoins.
Until dominance reclaims the upper trendline or regains bullish momentum, the risk-reward now favors altcoins. Momentum is shifting. Altseason might just be around the corner.
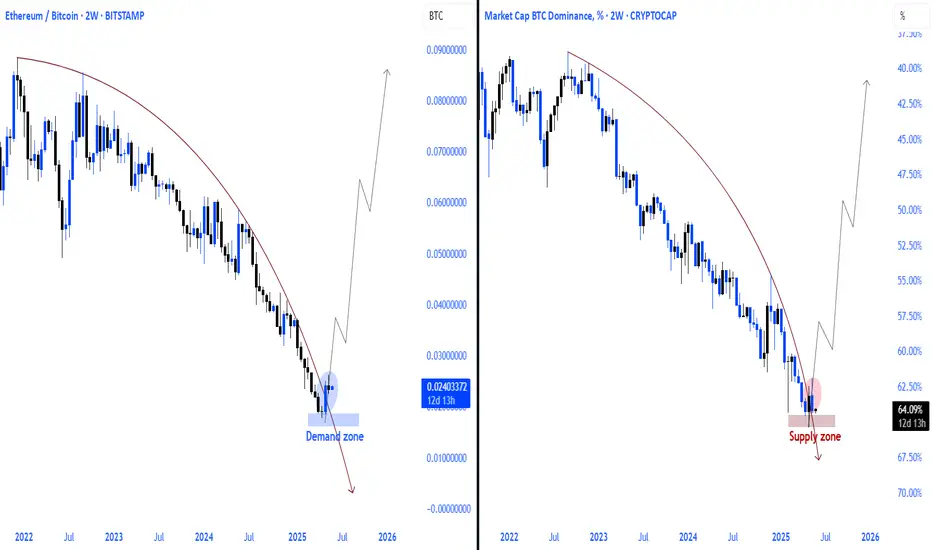
ETH/BTC vs btc dominanceethereum received a reaction as we expected from the current demand zone in the bitcoin pair, and it seems inevitable that the upward momentum from the current area will continue. on the bitcoin dominance side, the same situation exists, but I think we will witness a bearish absolute process.
BTC Dominance continues downward Despite the recent aggressive fall in BTC Dominance, we still see a path down towards 58%. This ratio, which is determined by dividing the total value of the cryptocurrency market by the market value of Bitcoin, can help us understand where the market will go.
BTC.D drop plan 2025 Q4 - 2026 Q1After the liquidity was removed at 61.87%, I’d like to see a sweep at 73.53%, followed by a sharp drop down into the 55–50% zone.
The blue bars represent a fractal pattern from the previous cycle when the altseason began in 2021–2022.
The white trajectory is one of the possible scenarios. In this case, the altseason would be postponed to Q1 of 2026.
CRYPTOCAP:BTC.D

BTC.D in Play! Rejection or Reversal? This is BTC.D on the daily chart
It recently dropped below the 200MA and found support at the 0.382 Fib level
Today price is getting rejected by both the 200MA and the 62.25 Fib level
If it stays below we could see a move back down to 0.382
If it closes above the confluence area more upside is possible
Or it could simply range here for a while
We cant control what happens so best to stay patient and ready
Always take profits and manage risk.
Interaction is welcome.
TradeCityPro | Bitcoin Daily Analysis #136👋 Welcome to TradeCity Pro!
Let’s get into the analysis of Bitcoin and major crypto indices. As usual in this analysis, I’m going to review the futures triggers for the New York session.
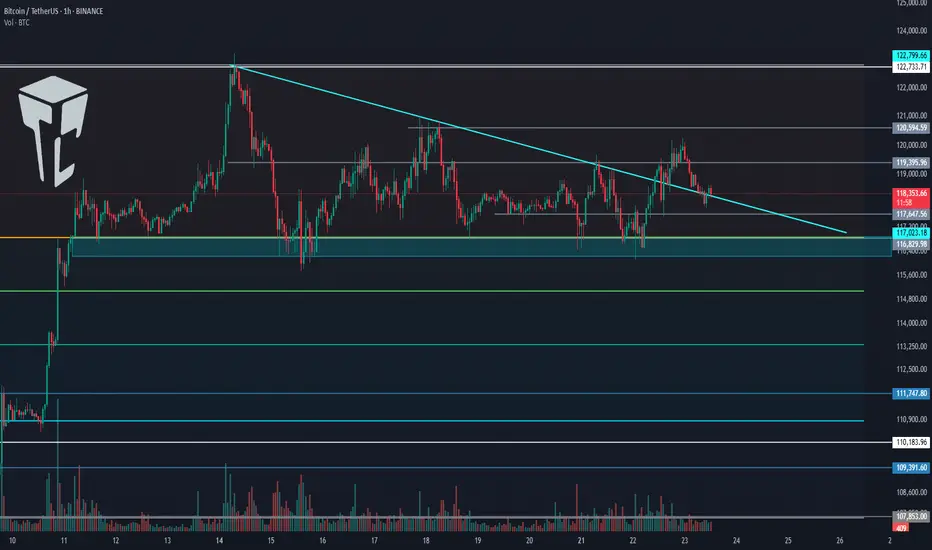
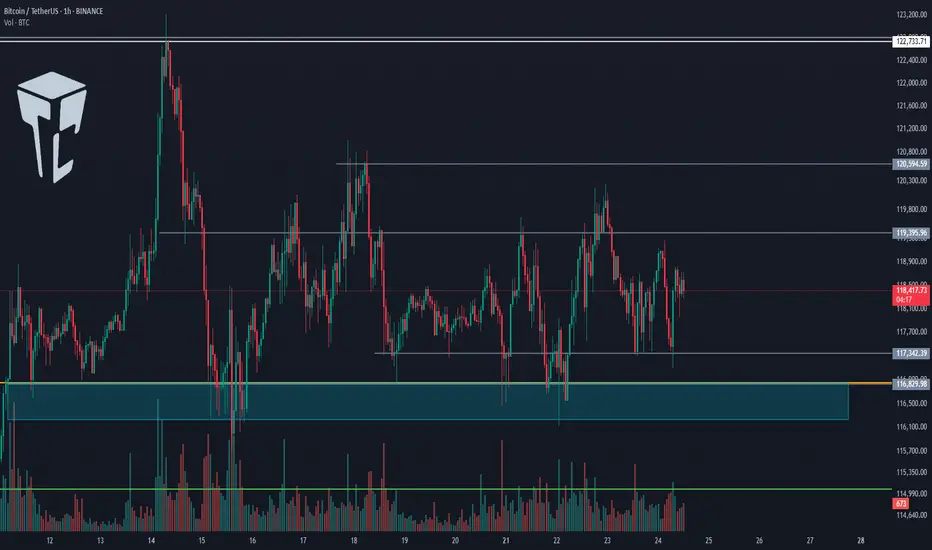
⏳ 1-Hour Timeframe
On the 1-hour timeframe, price is still ranging inside the box, and none of its triggers were activated yesterday.
✔️ The support floor is at 117,342, and another key support zone is around 116,000.
✨ If these zones break, Bitcoin may begin a deep correction. In that case, we can open short positions or close long-term long positions that we’re already holding.
⭐ For long positions, we still have the 119,395 and 120,594 triggers. A breakout of either zone could provide a very good entry point for the next bullish leg of Bitcoin.
👑 BTC.D Analysis
Let’s move on to Bitcoin Dominance. Yesterday, dominance stabilized above the 61.20 zone, and as I mentioned before, breaking this zone led to a bullish leg, which continued up to 62.41, and currently, it has more bullish momentum.
💥 If 62.41 breaks, the bullish momentum will intensify. However, I still believe the overall trend is bearish, and if 60.46 breaks to the downside, the decline could continue.
📅 Total2 Analysis
Let’s go over Total2. This index has continued to correct and has now dropped to the 1.41 zone, which corresponds to the 0.5 Fibonacci level. It has now created a trigger around 1.47.
⚡️ If 1.47 breaks, we can open a long position. Our next trigger will be 1.53.
A breakout of 1.53 would signal the start of the next bullish wave.
📅 USDT.D Analysis
Now to Tether Dominance. This index has finally exited its range box and has broken the 4.25 level.
The current resistance stopping price is 4.36.
🔔 If dominance drops back below 4.25, strong bearish momentum could hit, increasing the likelihood of a breakdown of 4.13.
❌ Disclaimer ❌
Trading futures is highly risky and dangerous. If you're not an expert, these triggers may not be suitable for you. You should first learn risk and capital management. You can also use the educational content from this channel.
Finally, these triggers reflect my personal opinions on price action, and the market may move completely against this analysis. So, do your own research before opening any position.
Why Alts Dump Again?? Altseason cancel?After forming a minor rejection at both the trendline and support level, BTC dominance may need to retest the 62% level or higher following the recent sharp dump.

Altcoin Season Has Started. And A Quick Look At The Stock MarketHey Traders,
Time for me to catch you up on the latest price action in both the stock market and crypto as well as touch upon a few changes on my platform and subscription services and what I plan for the future.
Timestamps:
00:00 | Housekeeping - site changes, etc
04:35 | BTC Dominance
06:45 | DXY Dollar Chart
10:00 | SPY
14:25 | BTC Bitcoin Chart
15:45 | Bitcoin Liquidity Heatmap
17:30 | Solana
19:05 | Ethereum
20:20 | Crypto & Stock Trackers
24:25 | My Indicator
26:10 | Where I Went Wrong & How I Plan To Course Correct
✌️ Stew

TradeCityPro | Bitcoin Daily Analysis #135👋 Welcome to TradeCity Pro!
Let’s move on to the analysis of Bitcoin and major crypto indices. In this analysis, as usual, I’m going to review the futures triggers for the New York session.
⏳ 1-Hour Timeframe
Yesterday, Bitcoin broke the 119,395 level but couldn’t hold above it and has now returned below this level, currently sitting on its previous trendline.
✔️ Today, the market will probably try to form more structure, and I think Bitcoin will range.
⭐ However, if it wants to move, we can enter a long position with the trigger at 120,594.
🔽 For a short position, we can enter if the 116,000 support area breaks.
👑 BTC.D Analysis
Let’s move on to Bitcoin Dominance. Yesterday, dominance had a bullish move, and finally, a support floor managed to prevent further drop in dominance.
🧩 A retracement to 61.20 has occurred. If this retracement continues, the upper levels are 61.53 and 62.
A break of 60.46 will start the next bearish leg.
📅 Total2 Analysis
Let’s go to Total2. This index has formed a range box between 1.48 and 1.55 and is still oscillating within it.
🎲 If 1.55 breaks, we can open a long position, and on the other hand, if 1.48 breaks, the price could correct to lower support levels.
📅 USDT.D Analysis
Let’s move on to Tether Dominance. This index also has a range box and is still moving inside it.
🔑 Breaking 4.13 is very important for the future market trend and could lead to a drop in dominance.